| Param | Original file | Final file |
|---|---|---|
| Filename | modeM0/AS1T05_026T01_9000005092_35569cztM0_level2.evt | modeM0/AS1T05_026T01_9000005092_35569cztM0_level2_quad_clean.evt |
| Size (bytes) | 516,818,880 | 67,671,360 |
| Size | 492.9 MB | 64.5 MB |
| Events in quadrant A | 5,271,930 | 379,548 |
| Events in quadrant B | 3,545,502 | 437,369 |
| Events in quadrant C | 3,382,655 | 438,645 |
| Events in quadrant D | 3,098,105 | 427,730 |
| Mode SS | |||
|---|---|---|---|
| Quadrant | BADHDUFLAG | Total packets | Discarded packets |
| A | 0 | 106 | 0 |
| B | 0 | 106 | 0 |
| C | 0 | 106 | 0 |
| D | 0 | 106 | 0 |
| Mode M9 | |||
|---|---|---|---|
| Quadrant | BADHDUFLAG | Total packets | Discarded packets |
| A | 0 | 29 | 0 |
| B | 0 | 29 | 0 |
| C | 0 | 29 | 0 |
| D | 0 | 30 | 0 |
| Mode M0 | |||
|---|---|---|---|
| Quadrant | BADHDUFLAG | Total packets | Discarded packets |
| A | 0 | 18995 | 3 |
| B | 0 | 14129 | 2 |
| C | 0 | 13344 | 2 |
| D | 0 | 12869 | 2 |
| Quadrant | Total seconds | Saturated seconds | Saturation percentage |
|---|---|---|---|
| A | 5211 | 1238 | 23.757436% |
| B | 5211 | 423 | 8.117444% |
| C | 5211 | 148 | 2.840146% |
| D | 5211 | 111 | 2.130109% |
Noise dominated data is calculated using 1-second bins in cleaned event files. If a bin has >2000 counts, and if more than 50% of those come from <1% of pixels, then it is considered to be noise-dominated and hence unusable.
| Quadrant | # 1 sec bins | Bins with >0 counts | Bins with >2000 counts | High rate bins dominated by noise | Noise dominated (total time) | Noise dominated (detector-on time) | Marked lightcurve |
|---|---|---|---|---|---|---|---|
| A | 7035 | 5212 | 1120 | 1120 | 15.92% | 21.49% | 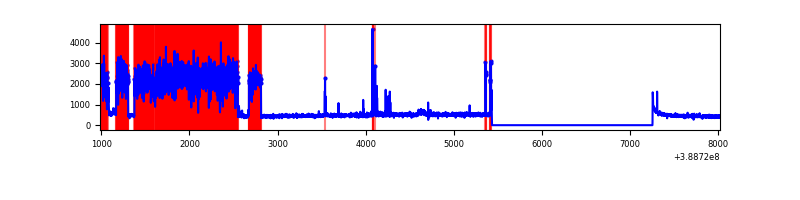 |
| B | 7035 | 5212 | 270 | 270 | 3.84% | 5.18% | 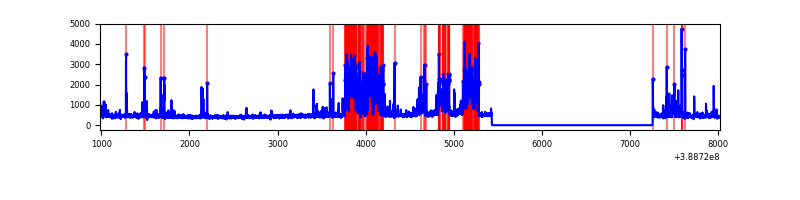 |
| C | 7035 | 5212 | 108 | 108 | 1.54% | 2.07% | 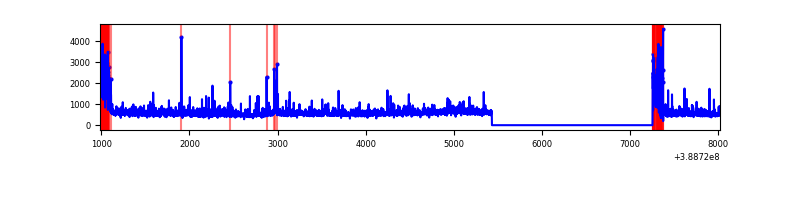 |
| D | 7035 | 5212 | 98 | 98 | 1.39% | 1.88% | 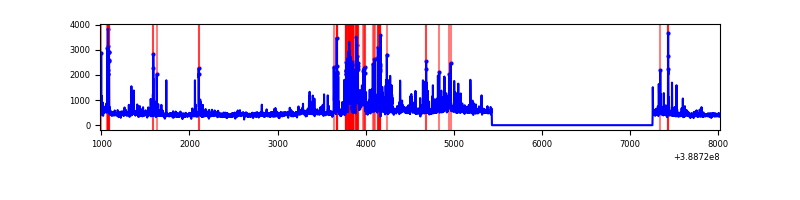 |
Top three noisy pixels from each quadrant. If the there are fewer than three noisy pixels in the level2.evt file, extra rows are filled as -1
| Pixel properties | Quadrant properties | ||||||
|---|---|---|---|---|---|---|---|
| Quadrant | DetID | PixID | Counts | Sigma | Mean | Median | Sigma |
| A | 15 | 169 | 3017223 | 27399.7 | 545 | 533 | 110.1 |
| A | 10 | 83 | 127444 | 1152.69 | 545 | 533 | 110.1 |
| A | 13 | 6 | 13957 | 121.93 | 545 | 533 | 110.1 |
| B | 5 | 172 | 1219675 | 11262.61 | 571 | 557 | 108.2 |
| B | 4 | 81 | 32974 | 299.48 | 571 | 557 | 108.2 |
| B | 0 | 189 | 20174 | 181.23 | 571 | 557 | 108.2 |
| C | 0 | 10 | 473460 | 3556.66 | 570 | 574 | 133.0 |
| C | 9 | 187 | 382808 | 2874.85 | 570 | 574 | 133.0 |
| C | 15 | 214 | 232698 | 1745.85 | 570 | 574 | 133.0 |
| D | 7 | 80 | 250583 | 1798.61 | 569 | 552 | 139.0 |
| D | 8 | 195 | 166647 | 1194.81 | 569 | 552 | 139.0 |
| D | 13 | 249 | 112552 | 805.68 | 569 | 552 | 139.0 |
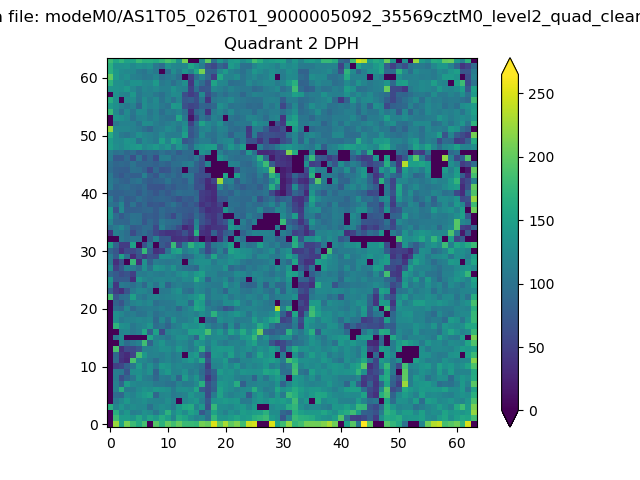
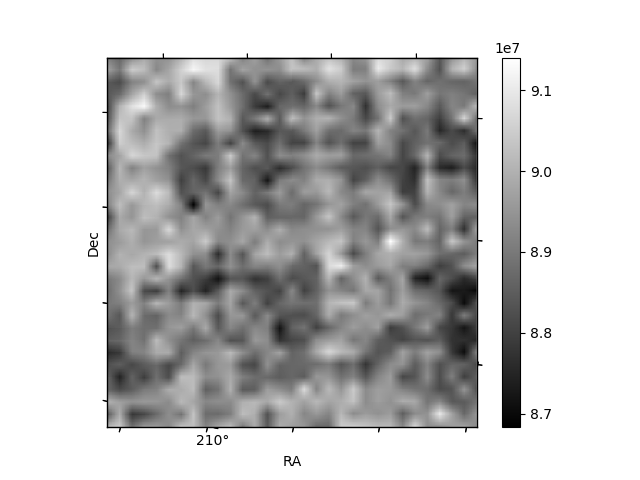
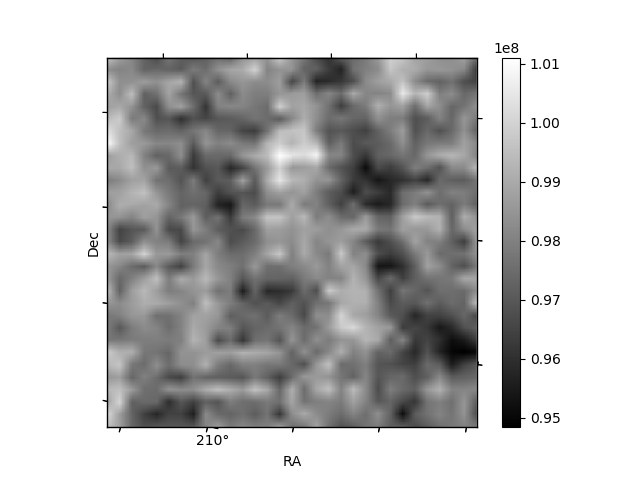
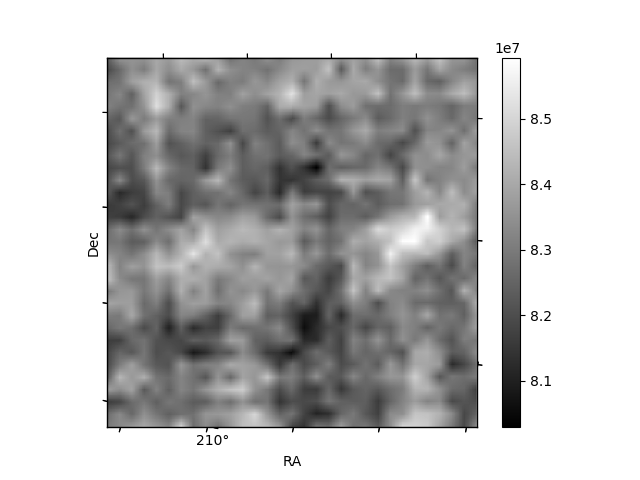
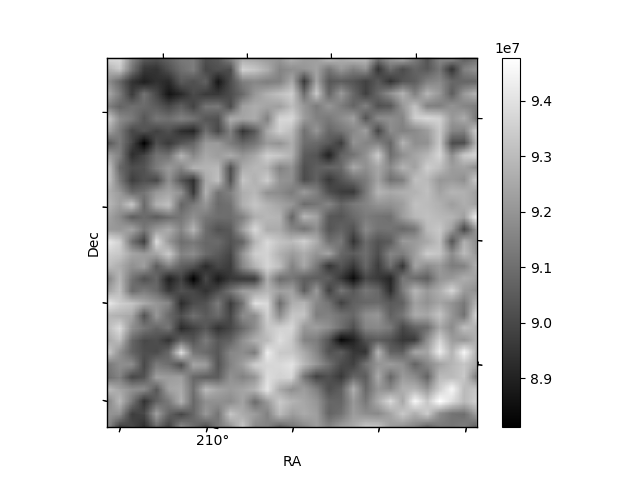
Histogram calculated using DETX and DETY for each event in the final _common_clean file
| Quadrant A | 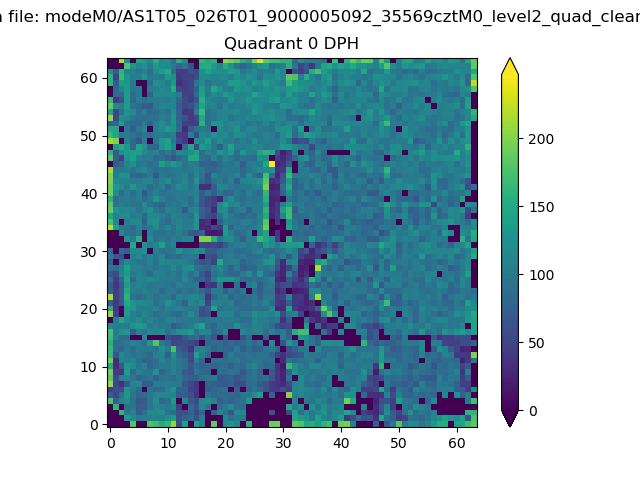 |
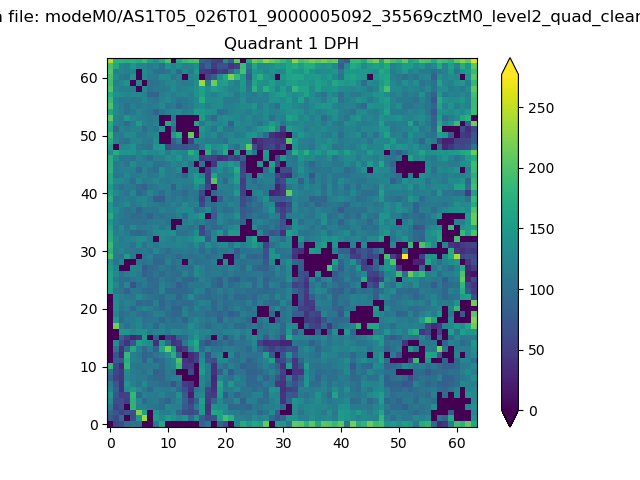 |
Quadrant B |
|---|---|---|---|
| Quadrant D | 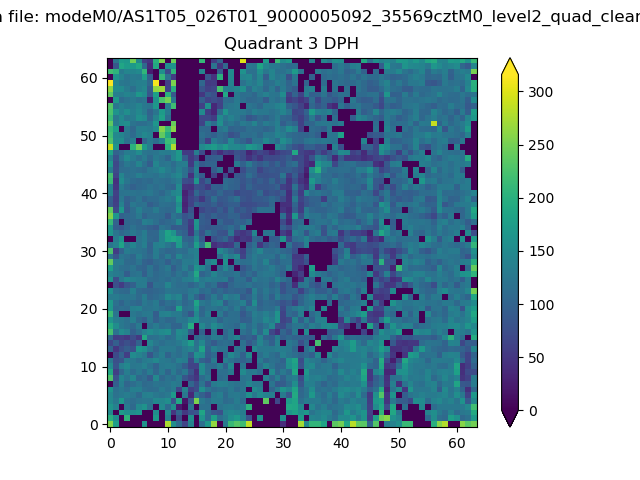 |
 |
Quadrant C |
| Plot type | Count rate plots | Images |
|---|---|---|
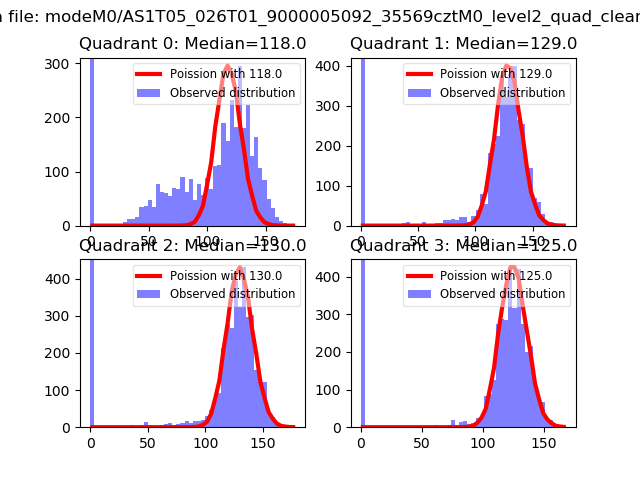
| Comparison with Poisson distribution Blue bars denote a histogram of data divided into 1 sec bins. Red curve is a Poisson curve with rate = median count rate of data. |
 |
 |
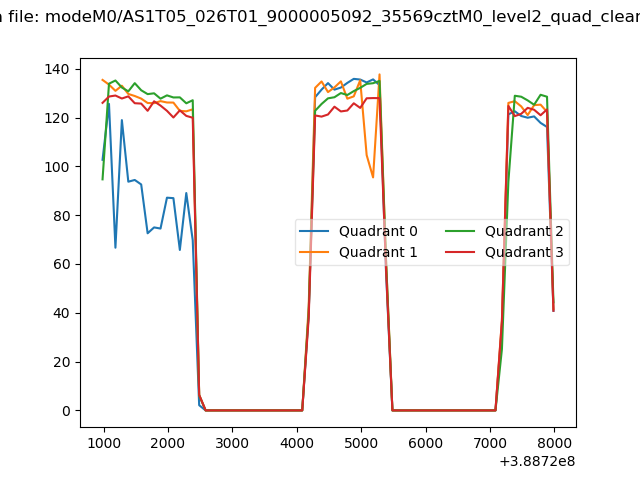
| Quadrant-wise count rates Data is divided into 100 sec bins |
 |
|
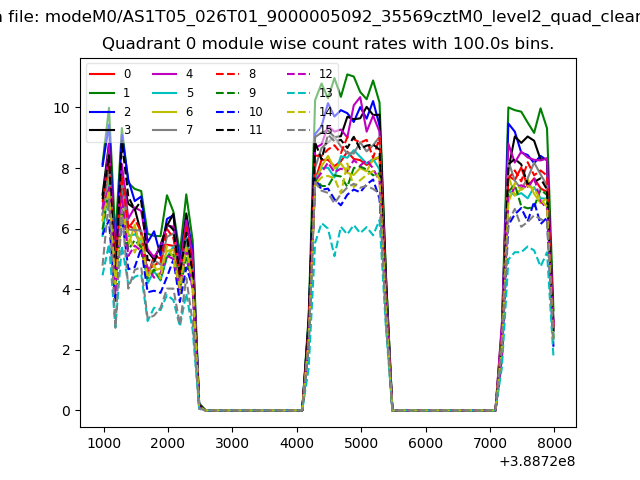
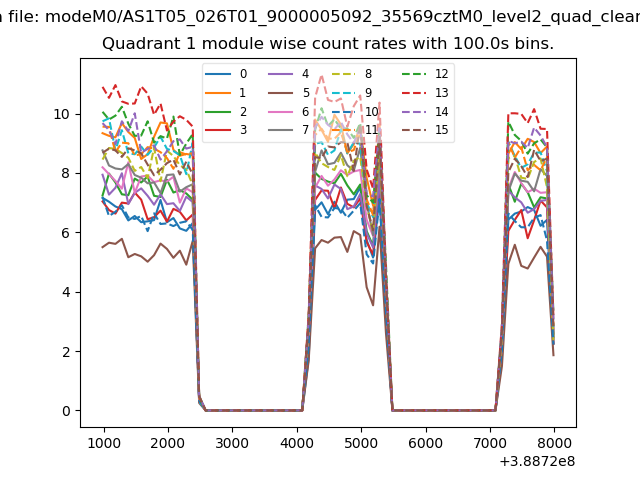
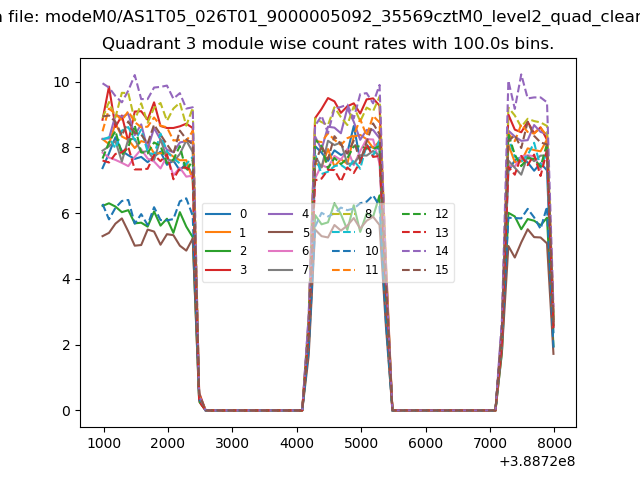
| Module-wise count rates for Quadrant A Data is divided into 100 sec bins |
 |
 |
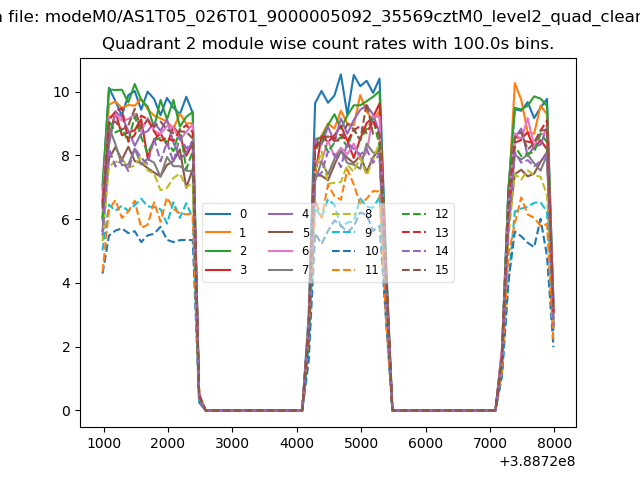
| Module-wise count rates for Quadrant B Data is divided into 100 sec bins |
 |
 |
| Module-wise count rates for Quadrant C Data is divided into 100 sec bins |
 |
 |
| Module-wise count rates for Quadrant D Data is divided into 100 sec bins |
 |
 |
| Parameter | Plot |
|---|---|
| CZT HV Monitor | 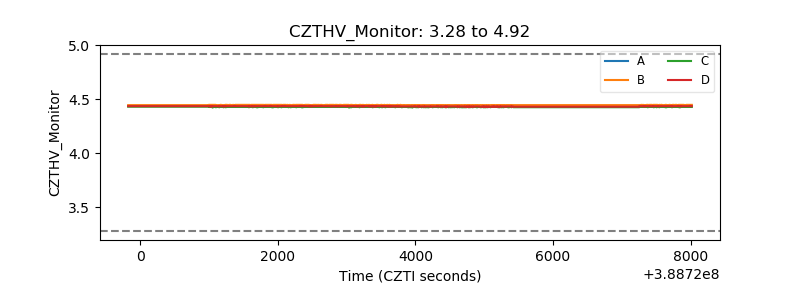 |
| D_VDD | 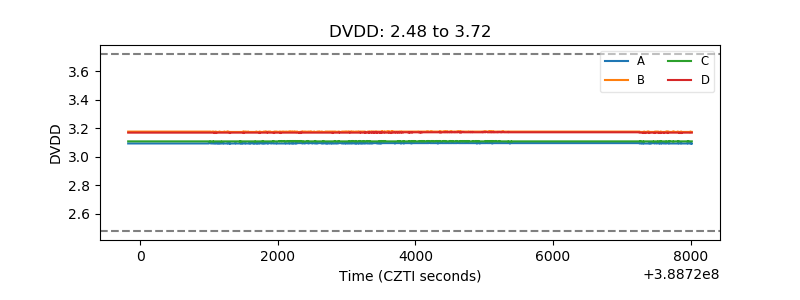 |
| Temperature 1 | 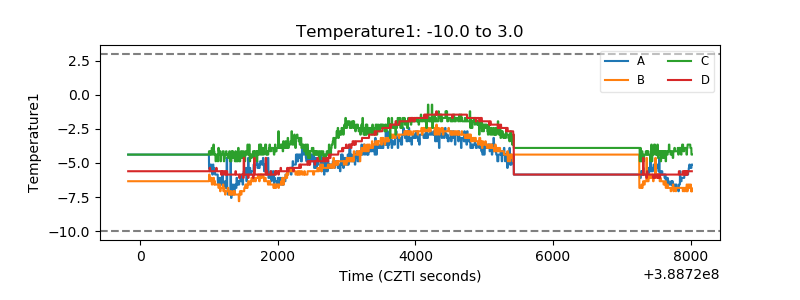 |
| Veto HV Monitor | 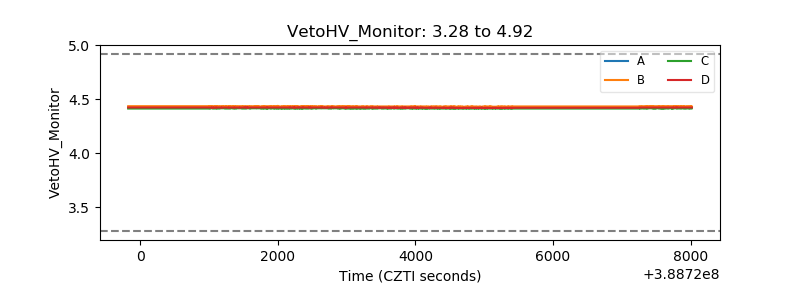 |
| Veto LLD | 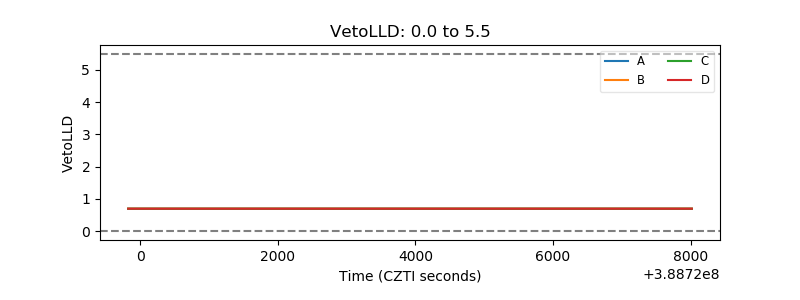 |
| Alpha Counter | 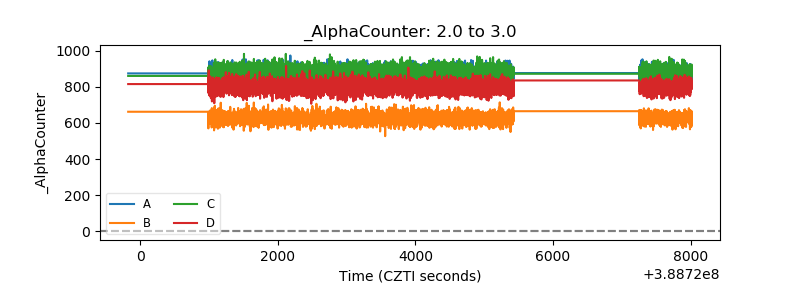 |
| _CPM_Rate | 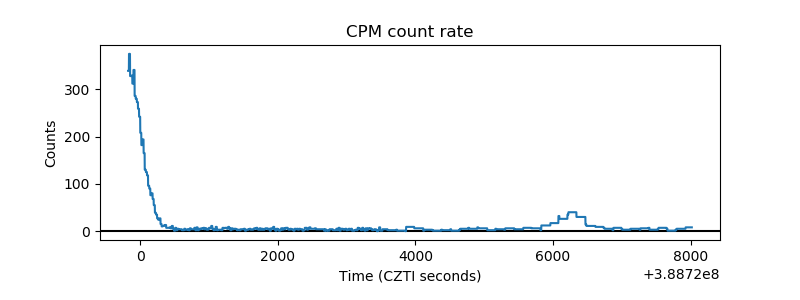 |
| CZT Counter | 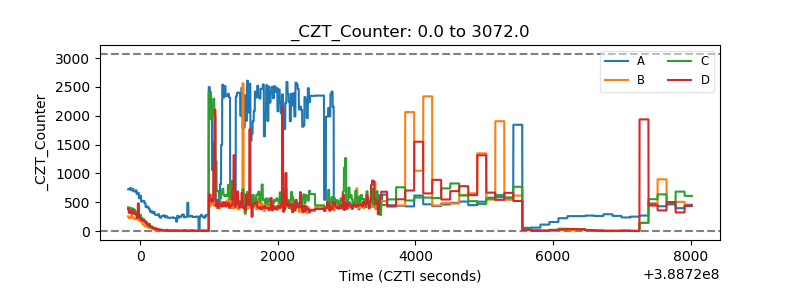 |
| +2.5 Volts monitor | 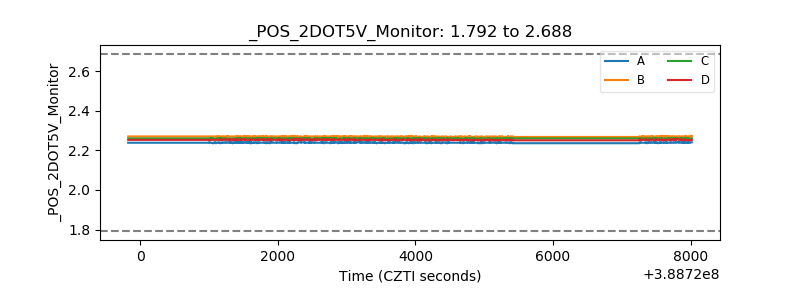 |
| +5 Volts monitor | 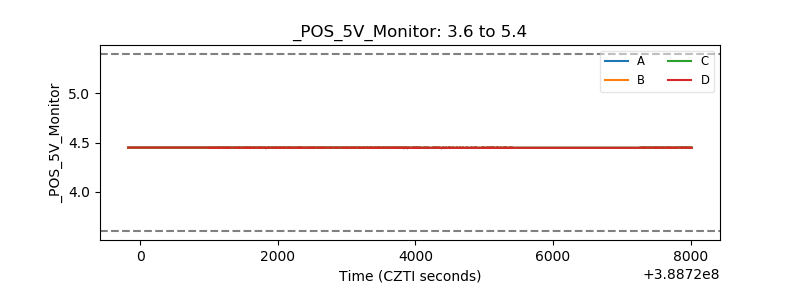 |
| _ROLL_ROT | 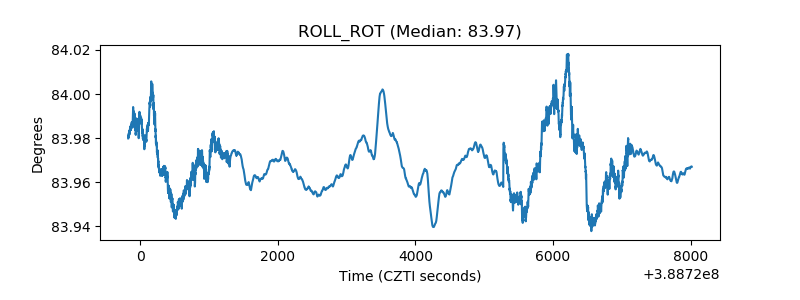 |
| _Roll_DEC | 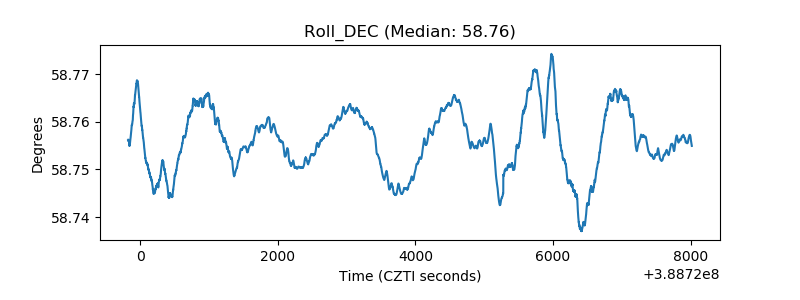 |
| _Roll_RA | 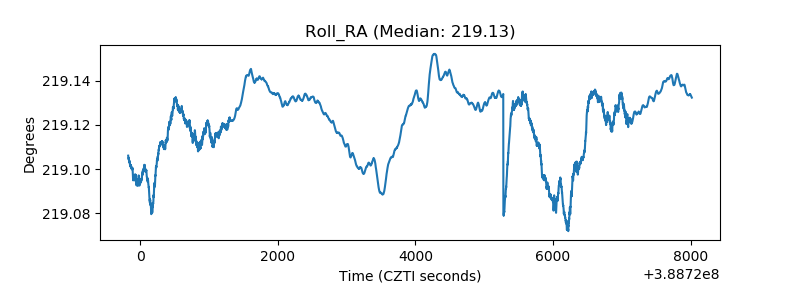 |
| Veto Counter | 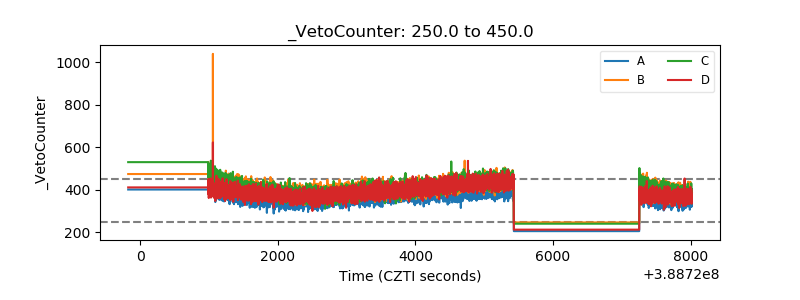 |