| Param | Original file | Final file |
|---|---|---|
| Filename | modeM0/AS1T05_026T01_9000005092_35565cztM0_level2.evt | modeM0/AS1T05_026T01_9000005092_35565cztM0_level2_quad_clean.evt |
| Size (bytes) | 431,818,560 | 89,029,440 |
| Size | 411.8 MB | 84.9 MB |
| Events in quadrant A | 3,192,561 | 573,351 |
| Events in quadrant B | 3,144,272 | 586,584 |
| Events in quadrant C | 3,284,698 | 607,071 |
| Events in quadrant D | 3,114,261 | 576,139 |
| Mode SS | |||
|---|---|---|---|
| Quadrant | BADHDUFLAG | Total packets | Discarded packets |
| A | 0 | 104 | 0 |
| B | 0 | 104 | 0 |
| C | 0 | 104 | 0 |
| D | 0 | 104 | 0 |
| Mode M9 | |||
|---|---|---|---|
| Quadrant | BADHDUFLAG | Total packets | Discarded packets |
| A | 0 | 29 | 0 |
| B | 0 | 29 | 0 |
| C | 0 | 29 | 0 |
| D | 0 | 30 | 0 |
| Mode M0 | |||
|---|---|---|---|
| Quadrant | BADHDUFLAG | Total packets | Discarded packets |
| A | 0 | 13034 | 3 |
| B | 0 | 12483 | 2 |
| C | 0 | 12898 | 2 |
| D | 0 | 12446 | 2 |
| Quadrant | Total seconds | Saturated seconds | Saturation percentage |
|---|---|---|---|
| A | 5028 | 24 | 0.477327% |
| B | 5028 | 254 | 5.051710% |
| C | 5028 | 184 | 3.659507% |
| D | 5028 | 114 | 2.267303% |
Noise dominated data is calculated using 1-second bins in cleaned event files. If a bin has >2000 counts, and if more than 50% of those come from <1% of pixels, then it is considered to be noise-dominated and hence unusable.
| Quadrant | # 1 sec bins | Bins with >0 counts | Bins with >2000 counts | High rate bins dominated by noise | Noise dominated (total time) | Noise dominated (detector-on time) | Marked lightcurve |
|---|---|---|---|---|---|---|---|
| A | 7061 | 5029 | 10 | 10 | 0.14% | 0.20% | 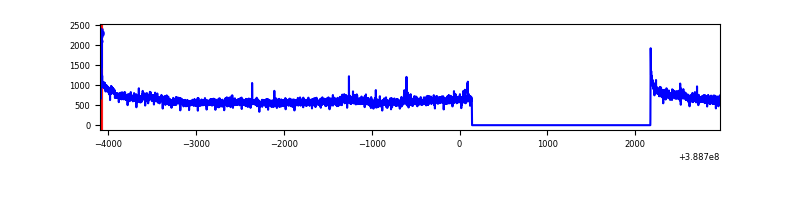 |
| B | 7061 | 5029 | 199 | 199 | 2.82% | 3.96% | 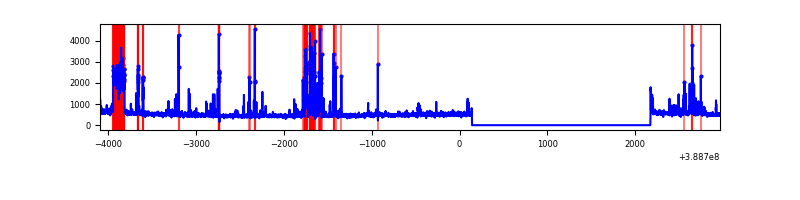 |
| C | 7061 | 5029 | 117 | 117 | 1.66% | 2.33% | 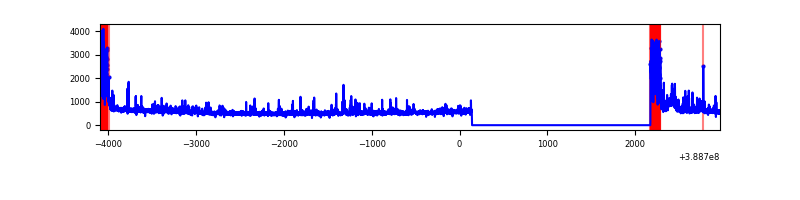 |
| D | 7061 | 5029 | 83 | 83 | 1.18% | 1.65% | 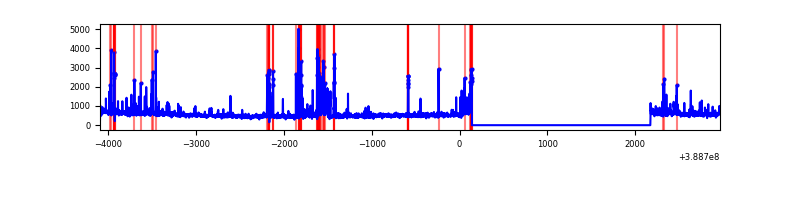 |
Top three noisy pixels from each quadrant. If the there are fewer than three noisy pixels in the level2.evt file, extra rows are filled as -1
| Pixel properties | Quadrant properties | ||||||
|---|---|---|---|---|---|---|---|
| Quadrant | DetID | PixID | Counts | Sigma | Mean | Median | Sigma |
| A | 15 | 169 | 676250 | 5621.04 | 603 | 593 | 120.2 |
| A | 10 | 83 | 131625 | 1090.1 | 603 | 593 | 120.2 |
| A | 7 | 192 | 30973 | 252.74 | 603 | 593 | 120.2 |
| B | 5 | 172 | 457549 | 4103.93 | 600 | 586 | 111.3 |
| B | 5 | 200 | 272960 | 2446.16 | 600 | 586 | 111.3 |
| B | 0 | 189 | 22519 | 196.98 | 600 | 586 | 111.3 |
| C | 0 | 10 | 634274 | 4590.57 | 607 | 614 | 138.0 |
| C | 15 | 214 | 223725 | 1616.34 | 607 | 614 | 138.0 |
| C | 3 | 233 | 31064 | 220.6 | 607 | 614 | 138.0 |
| D | 13 | 249 | 296186 | 2059.45 | 601 | 587 | 143.5 |
| D | 8 | 195 | 207434 | 1441.11 | 601 | 587 | 143.5 |
| D | 2 | 250 | 64549 | 445.63 | 601 | 587 | 143.5 |
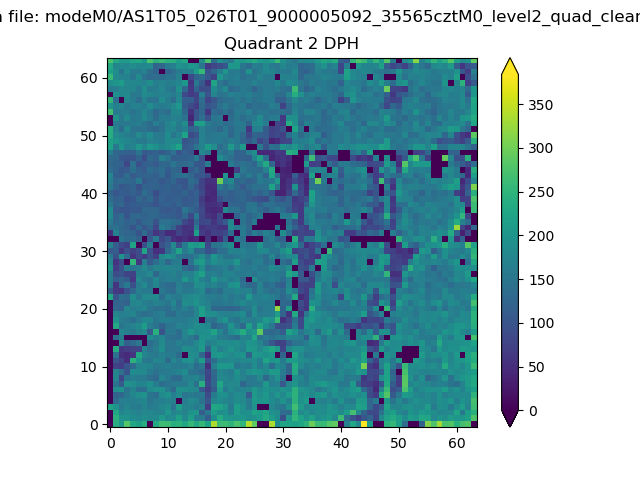
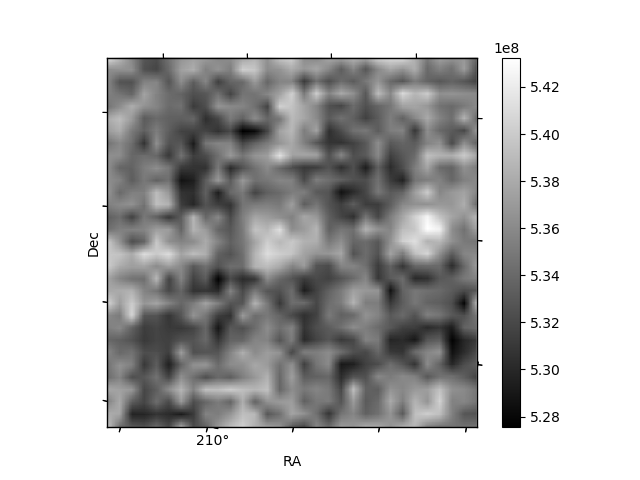
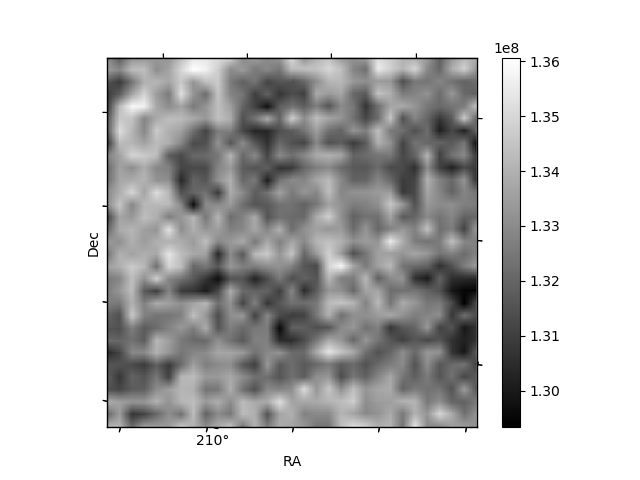
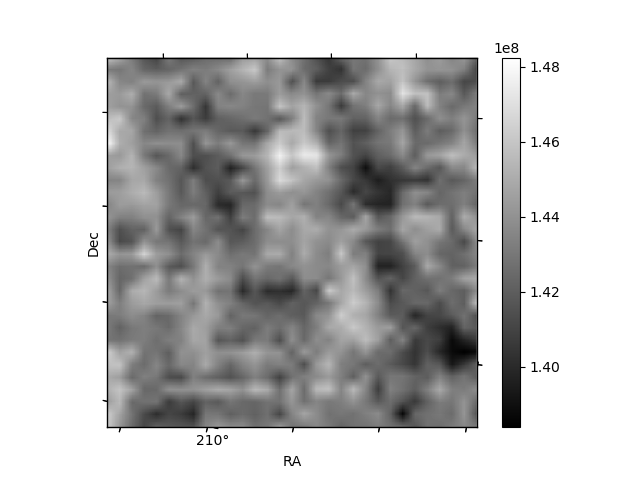
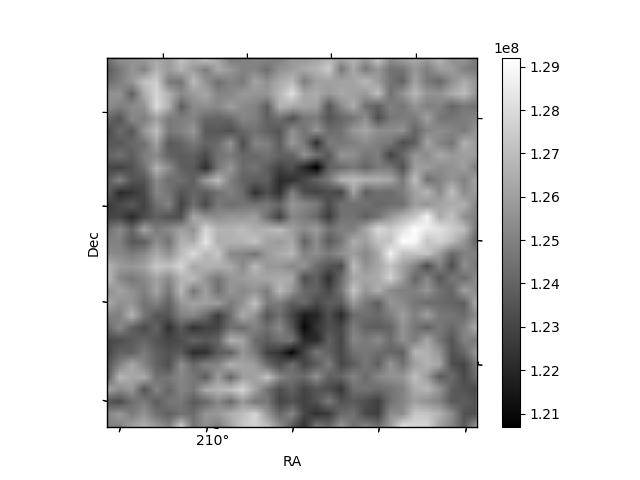
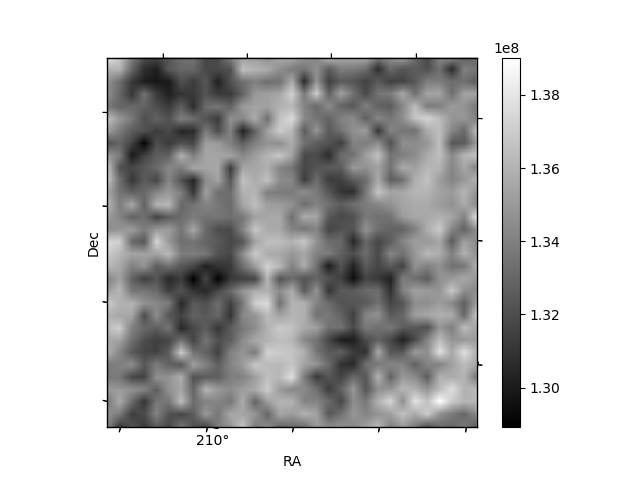
Histogram calculated using DETX and DETY for each event in the final _common_clean file
| Quadrant A | 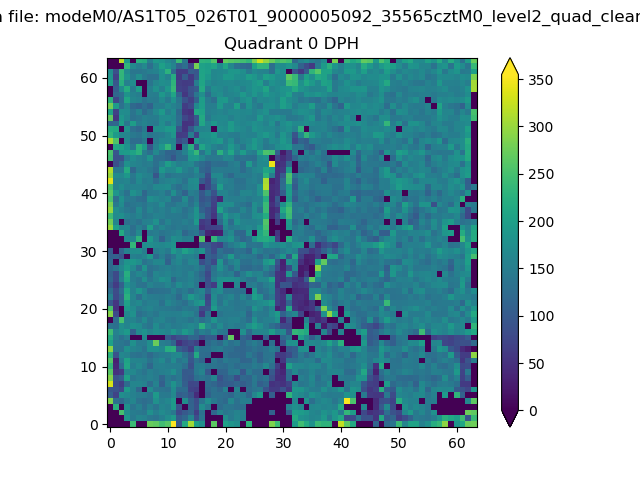 |
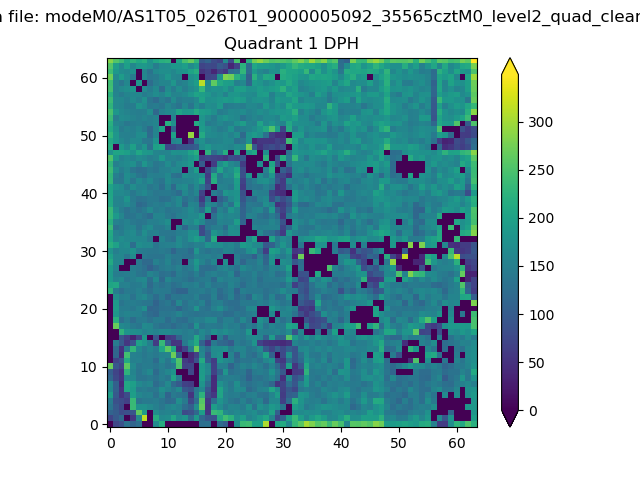 |
Quadrant B |
|---|---|---|---|
| Quadrant D | 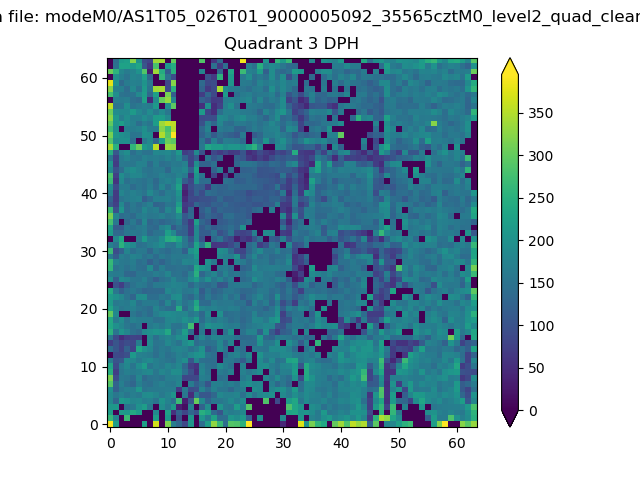 |
 |
Quadrant C |
| Plot type | Count rate plots | Images |
|---|---|---|
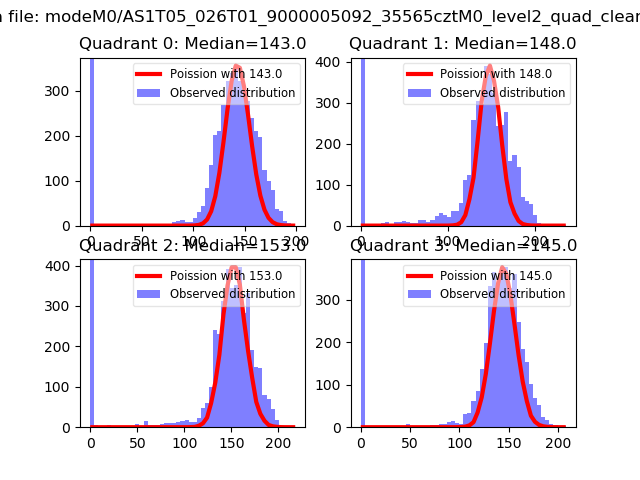
| Comparison with Poisson distribution Blue bars denote a histogram of data divided into 1 sec bins. Red curve is a Poisson curve with rate = median count rate of data. |
 |
 |
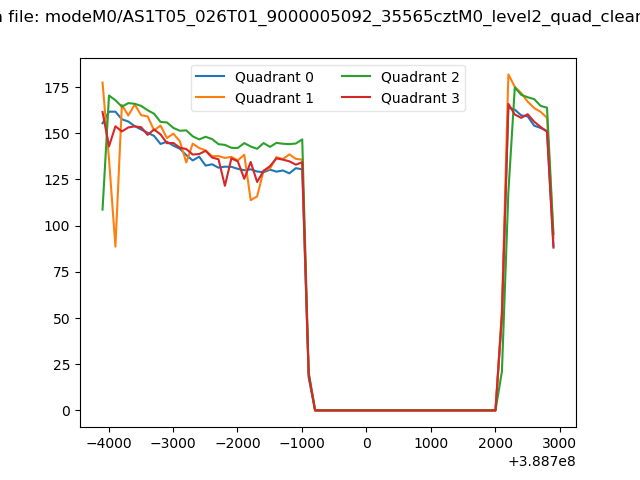
| Quadrant-wise count rates Data is divided into 100 sec bins |
 |
|
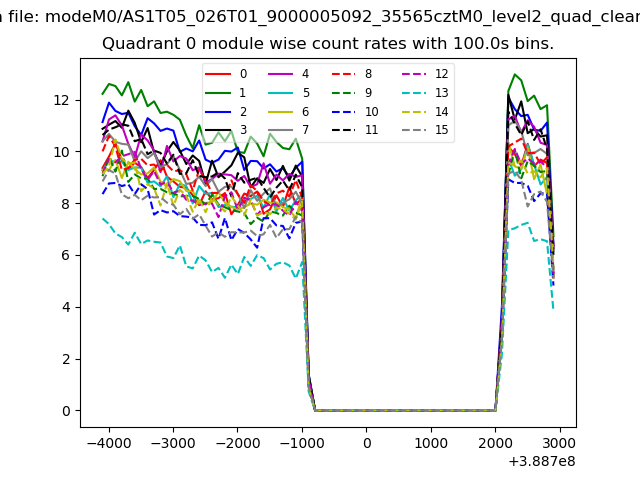
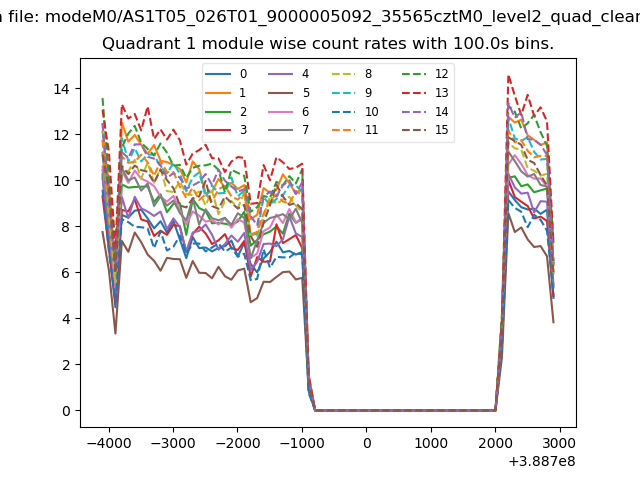
| Module-wise count rates for Quadrant A Data is divided into 100 sec bins |
 |
 |
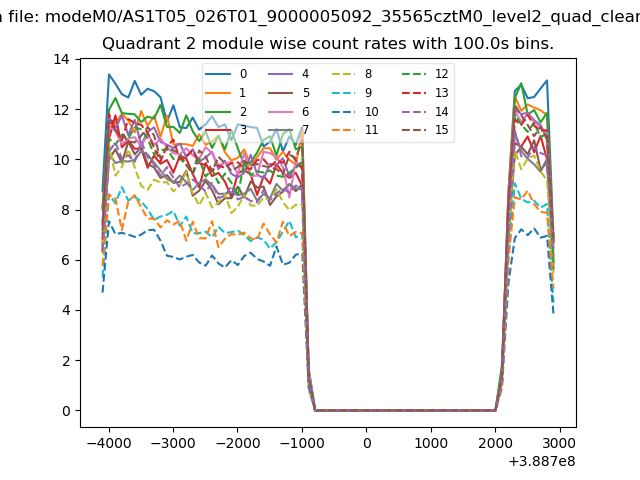
| Module-wise count rates for Quadrant B Data is divided into 100 sec bins |
 |
 |
| Module-wise count rates for Quadrant C Data is divided into 100 sec bins |
 |
 |
| Module-wise count rates for Quadrant D Data is divided into 100 sec bins |
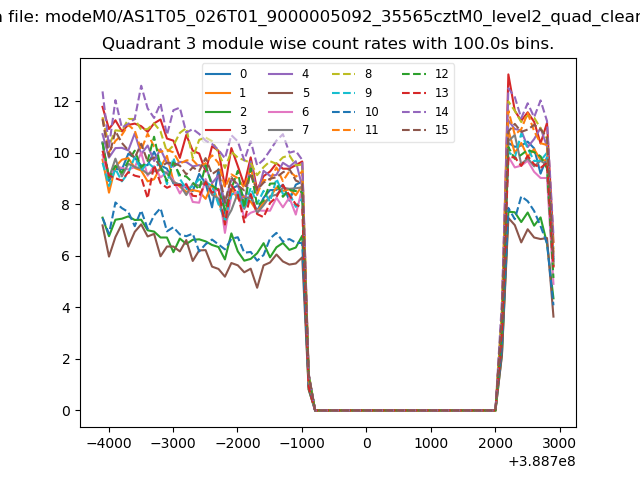 |
 |
| Parameter | Plot |
|---|---|
| CZT HV Monitor | 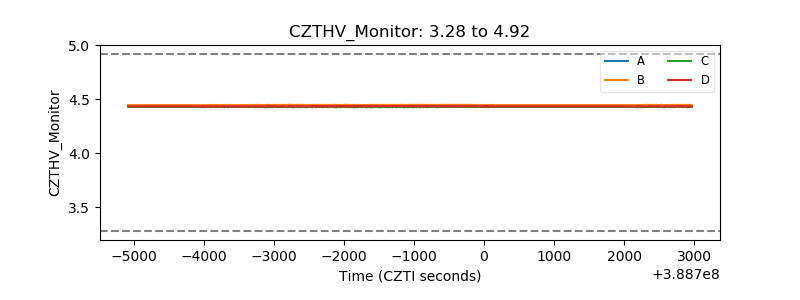 |
| D_VDD | 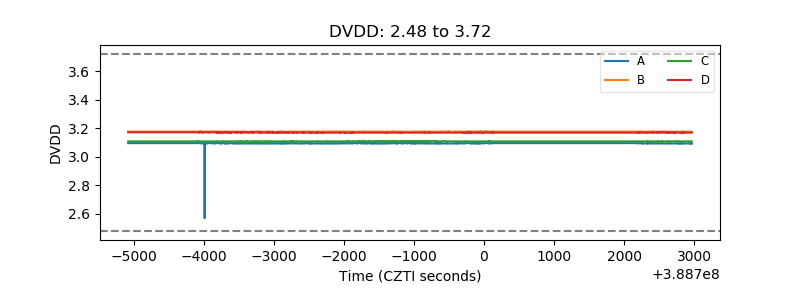 |
| Temperature 1 | 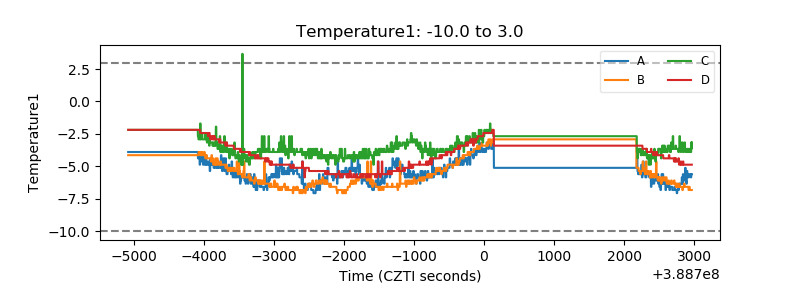 |
| Veto HV Monitor |  |
| Veto LLD | 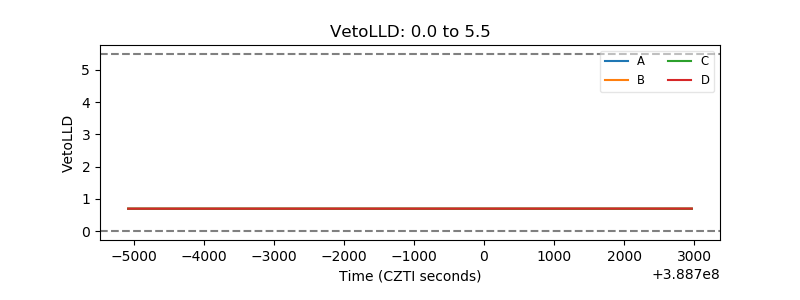 |
| Alpha Counter | 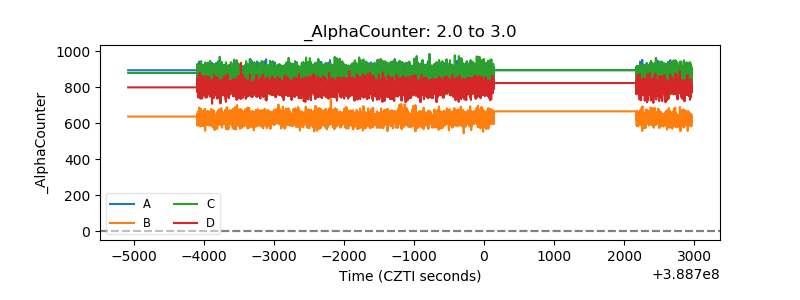 |
| _CPM_Rate | 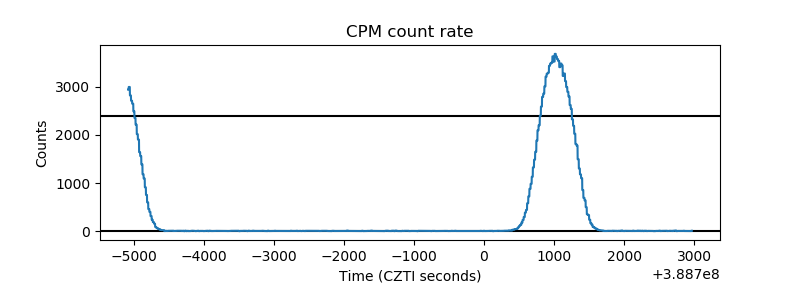 |
| CZT Counter | 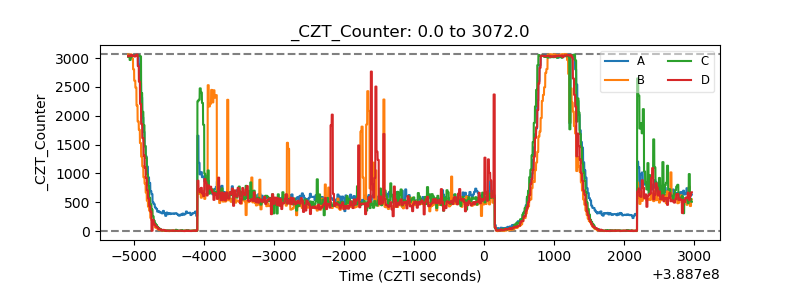 |
| +2.5 Volts monitor | 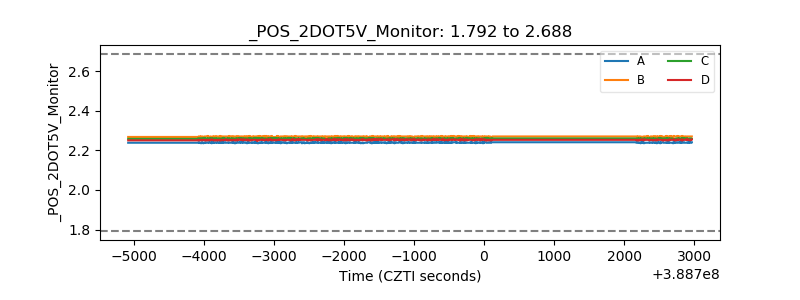 |
| +5 Volts monitor | 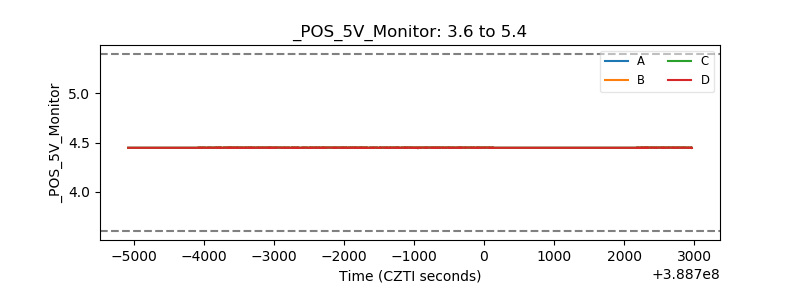 |
| _ROLL_ROT | 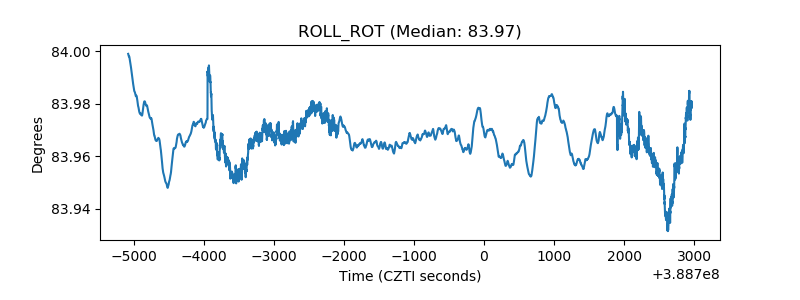 |
| _Roll_DEC | 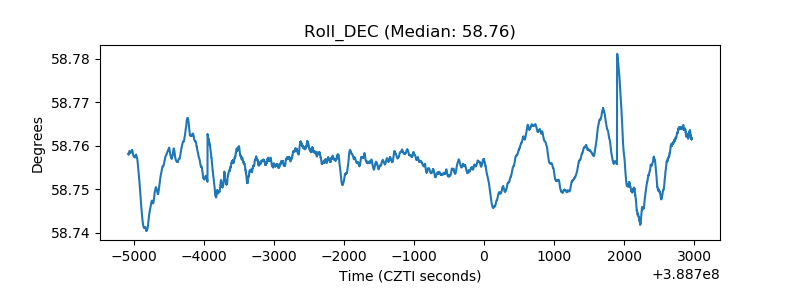 |
| _Roll_RA | 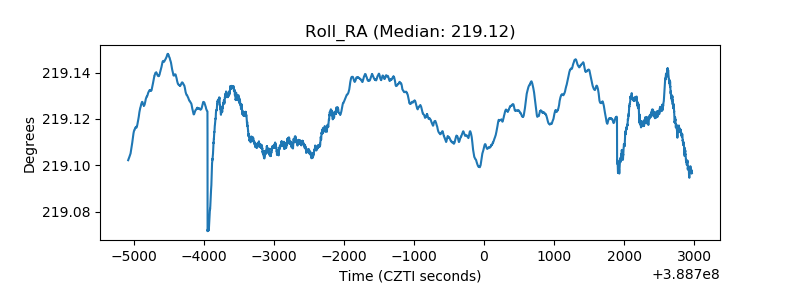 |
| Veto Counter | 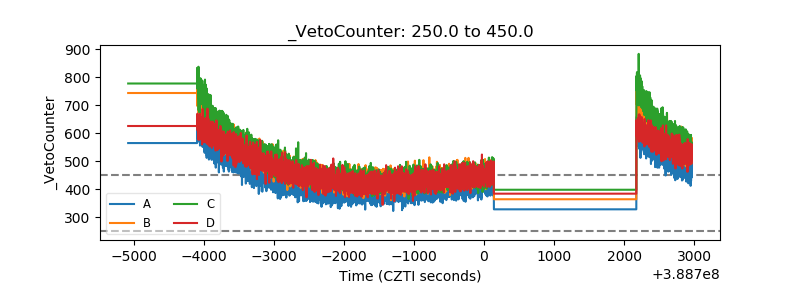 |