| Param | Original file | Final file |
|---|---|---|
| Filename | modeM0/AS1T05_026T01_9000005092_35564cztM0_level2.evt | modeM0/AS1T05_026T01_9000005092_35564cztM0_level2_quad_clean.evt |
| Size (bytes) | 457,421,760 | 96,264,000 |
| Size | 436.2 MB | 91.8 MB |
| Events in quadrant A | 3,663,585 | 620,671 |
| Events in quadrant B | 3,107,554 | 638,554 |
| Events in quadrant C | 3,262,069 | 653,287 |
| Events in quadrant D | 3,445,007 | 616,494 |
| Mode SS | |||
|---|---|---|---|
| Quadrant | BADHDUFLAG | Total packets | Discarded packets |
| A | 0 | 114 | 0 |
| B | 0 | 114 | 0 |
| C | 0 | 114 | 0 |
| D | 0 | 114 | 0 |
| Mode M9 | |||
|---|---|---|---|
| Quadrant | BADHDUFLAG | Total packets | Discarded packets |
| A | 0 | 37 | 0 |
| B | 0 | 37 | 0 |
| C | 0 | 37 | 0 |
| D | 0 | 37 | 0 |
| Mode M0 | |||
|---|---|---|---|
| Quadrant | BADHDUFLAG | Total packets | Discarded packets |
| A | 0 | 15269 | 3 |
| B | 0 | 12813 | 2 |
| C | 0 | 12990 | 2 |
| D | 0 | 13879 | 2 |
| Quadrant | Total seconds | Saturated seconds | Saturation percentage |
|---|---|---|---|
| A | 5524 | 25 | 0.452571% |
| B | 5524 | 168 | 3.041274% |
| C | 5524 | 131 | 2.371470% |
| D | 5524 | 105 | 1.900797% |
Noise dominated data is calculated using 1-second bins in cleaned event files. If a bin has >2000 counts, and if more than 50% of those come from <1% of pixels, then it is considered to be noise-dominated and hence unusable.
| Quadrant | # 1 sec bins | Bins with >0 counts | Bins with >2000 counts | High rate bins dominated by noise | Noise dominated (total time) | Noise dominated (detector-on time) | Marked lightcurve |
|---|---|---|---|---|---|---|---|
| A | 9229 | 5526 | 11 | 11 | 0.12% | 0.20% | 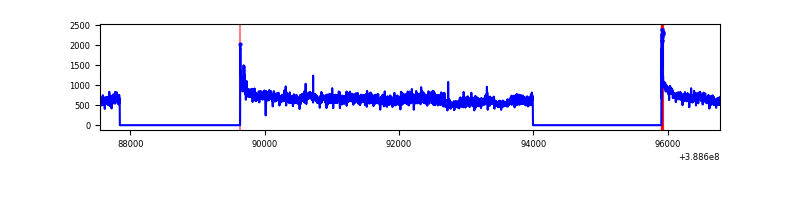 |
| B | 9229 | 5526 | 134 | 134 | 1.45% | 2.42% | 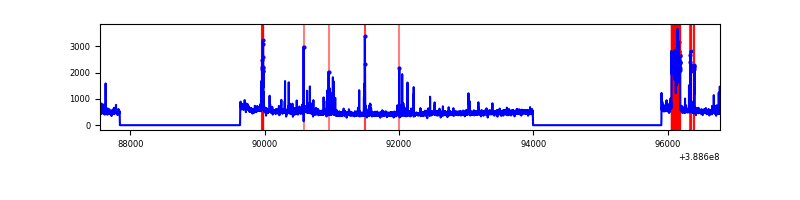 |
| C | 9229 | 5526 | 89 | 89 | 0.96% | 1.61% | 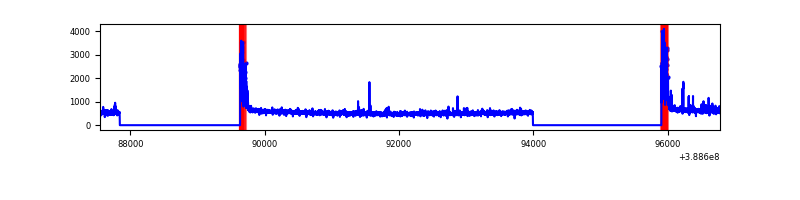 |
| D | 9229 | 5526 | 73 | 73 | 0.79% | 1.32% | 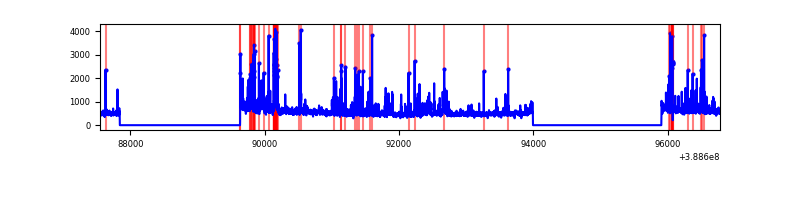 |
Top three noisy pixels from each quadrant. If the there are fewer than three noisy pixels in the level2.evt file, extra rows are filled as -1
| Pixel properties | Quadrant properties | ||||||
|---|---|---|---|---|---|---|---|
| Quadrant | DetID | PixID | Counts | Sigma | Mean | Median | Sigma |
| A | 15 | 169 | 961774 | 7340.63 | 654 | 642 | 130.9 |
| A | 10 | 83 | 139410 | 1059.84 | 654 | 642 | 130.9 |
| A | 13 | 6 | 17940 | 132.11 | 654 | 642 | 130.9 |
| B | 5 | 200 | 274031 | 2220.95 | 654 | 637 | 123.1 |
| B | 5 | 172 | 195734 | 1584.9 | 654 | 637 | 123.1 |
| B | 0 | 189 | 27672 | 219.62 | 654 | 637 | 123.1 |
| C | 0 | 10 | 410466 | 2708.79 | 658 | 664 | 151.3 |
| C | 15 | 214 | 246692 | 1626.25 | 658 | 664 | 151.3 |
| C | 14 | 67 | 27578 | 177.9 | 658 | 664 | 151.3 |
| D | 8 | 195 | 281668 | 1807.16 | 652 | 636 | 155.5 |
| D | 10 | 118 | 123602 | 790.72 | 652 | 636 | 155.5 |
| D | 13 | 249 | 81783 | 521.81 | 652 | 636 | 155.5 |
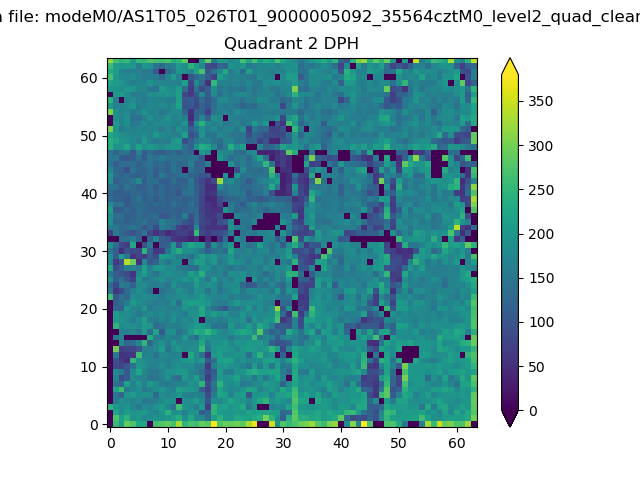
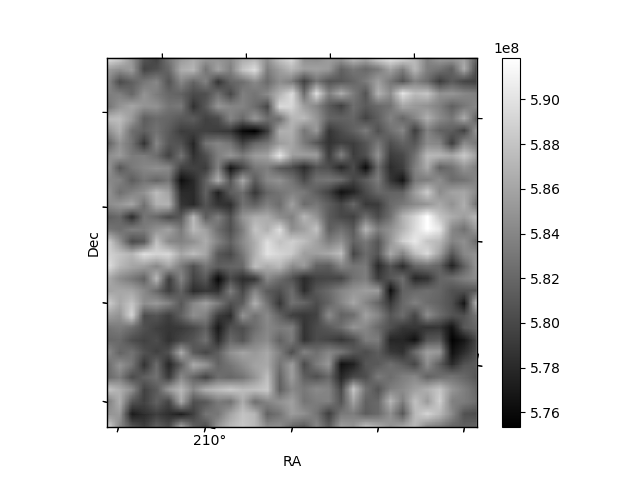
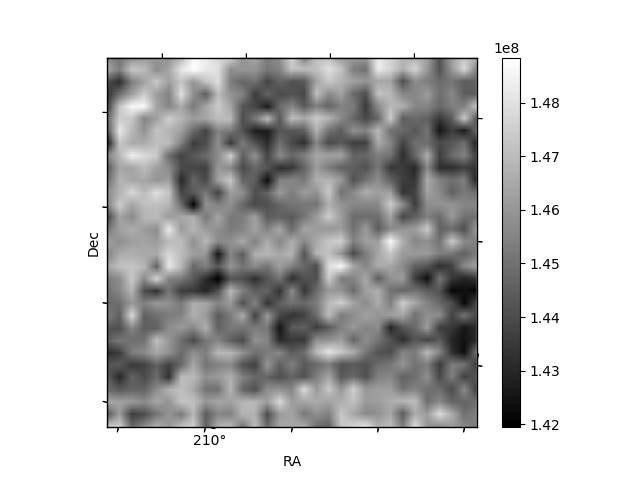
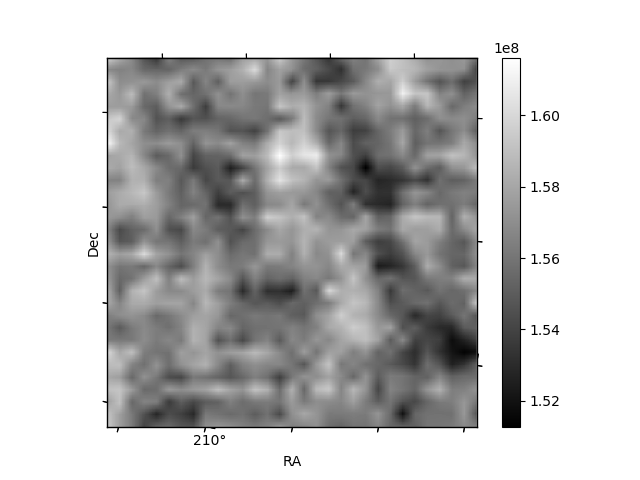
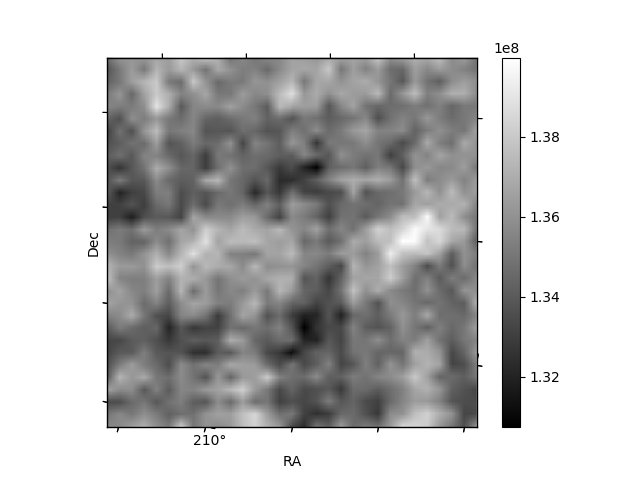
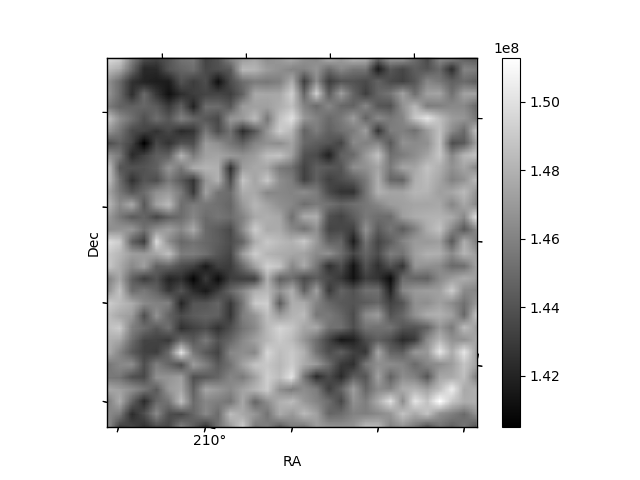
Histogram calculated using DETX and DETY for each event in the final _common_clean file
| Quadrant A | 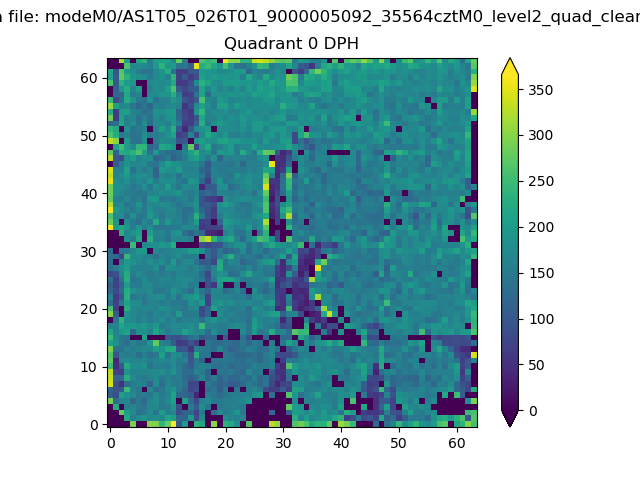 |
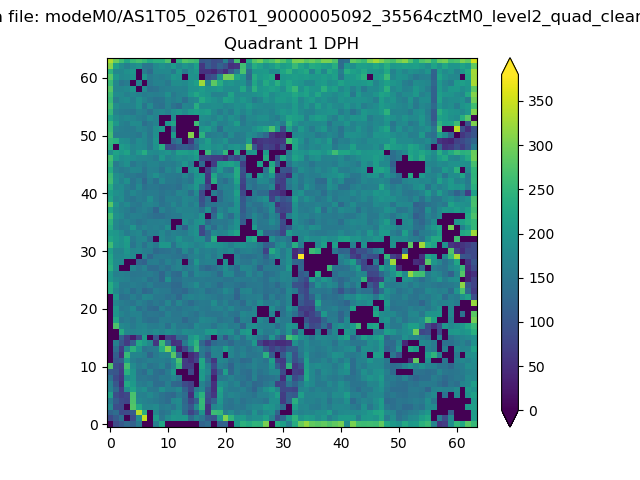 |
Quadrant B |
|---|---|---|---|
| Quadrant D | 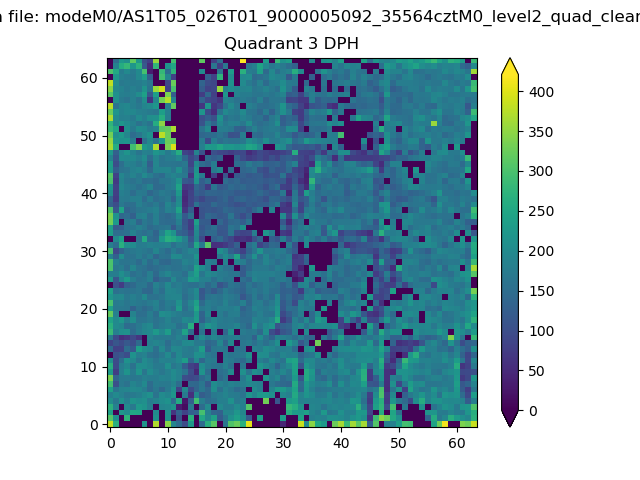 |
 |
Quadrant C |
| Plot type | Count rate plots | Images |
|---|---|---|
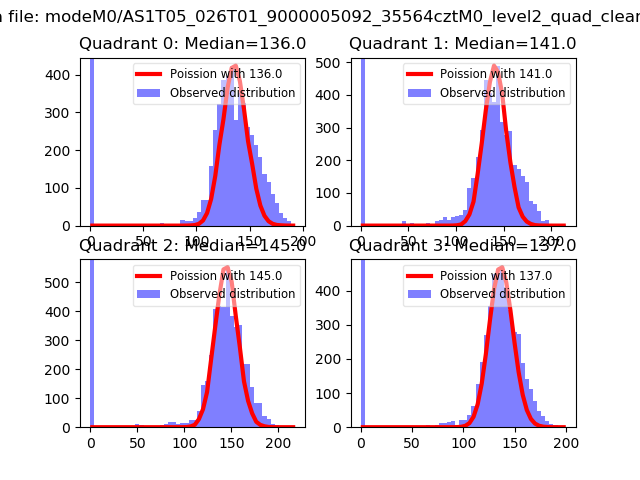
| Comparison with Poisson distribution Blue bars denote a histogram of data divided into 1 sec bins. Red curve is a Poisson curve with rate = median count rate of data. |
 |
 |
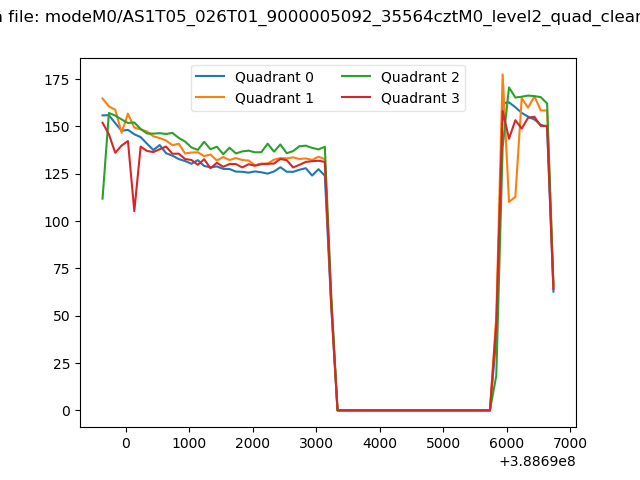
| Quadrant-wise count rates Data is divided into 100 sec bins |
 |
|
| Module-wise count rates for Quadrant A Data is divided into 100 sec bins |
 |
 |
| Module-wise count rates for Quadrant B Data is divided into 100 sec bins |
 |
 |
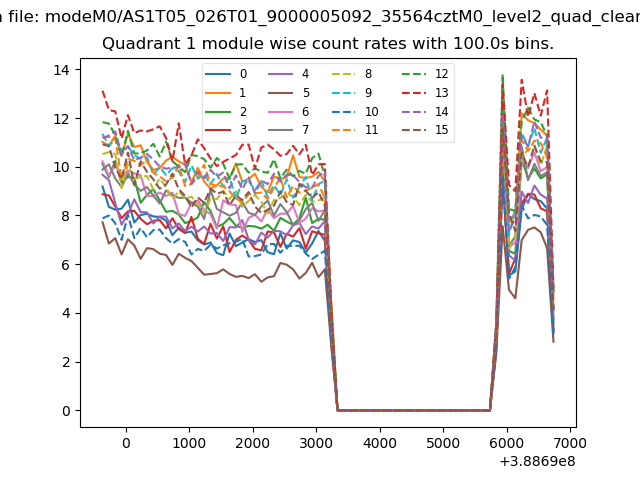
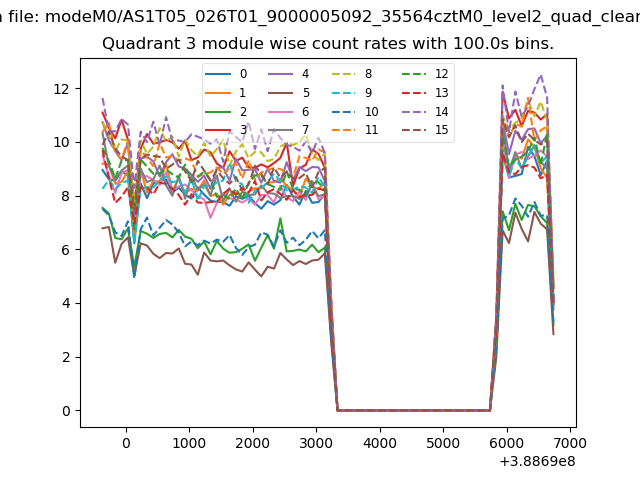
| Module-wise count rates for Quadrant C Data is divided into 100 sec bins |
 |
 |
| Module-wise count rates for Quadrant D Data is divided into 100 sec bins |
 |
 |
| Parameter | Plot |
|---|---|
| CZT HV Monitor | 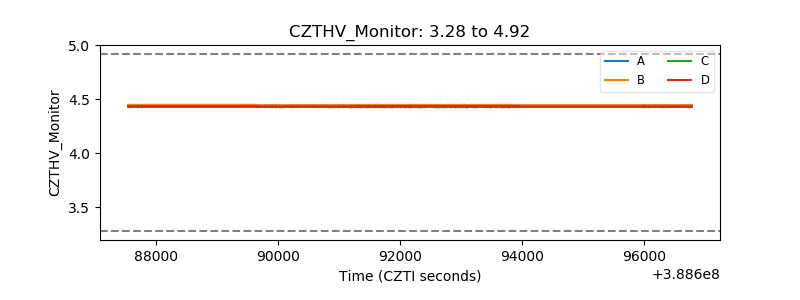 |
| D_VDD | 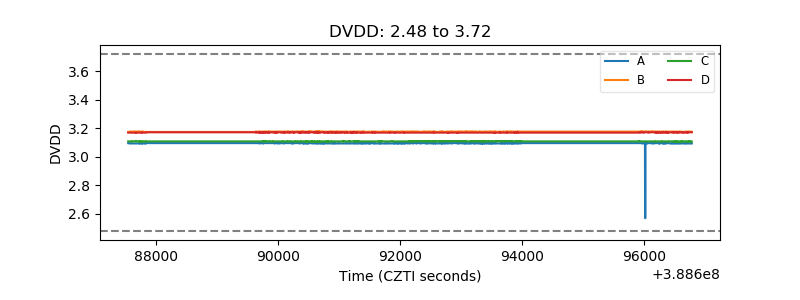 |
| Temperature 1 | 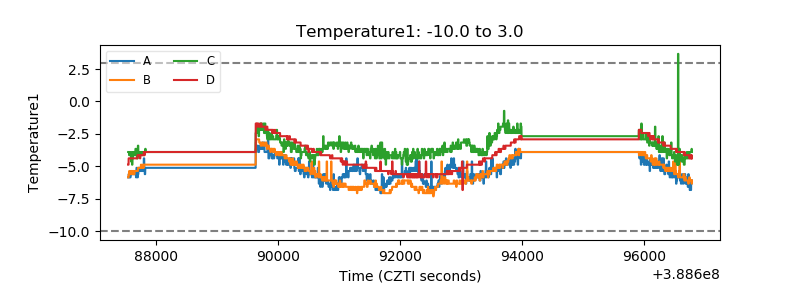 |
| Veto HV Monitor | 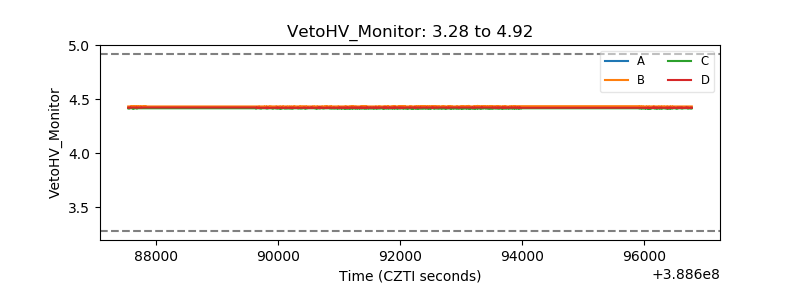 |
| Veto LLD | 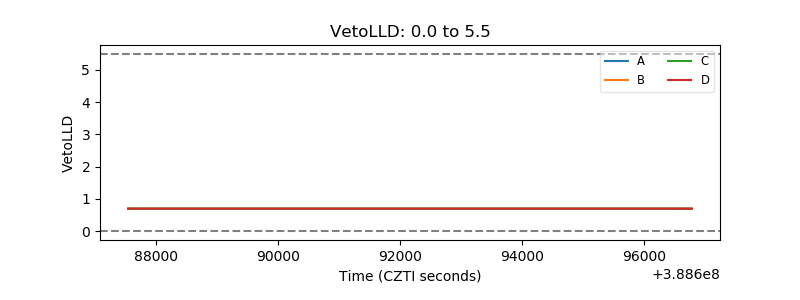 |
| Alpha Counter | 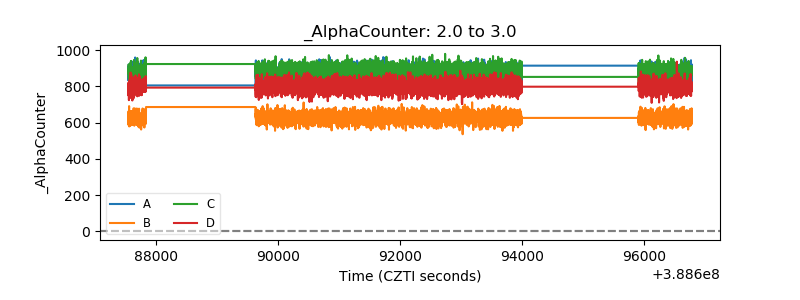 |
| _CPM_Rate | 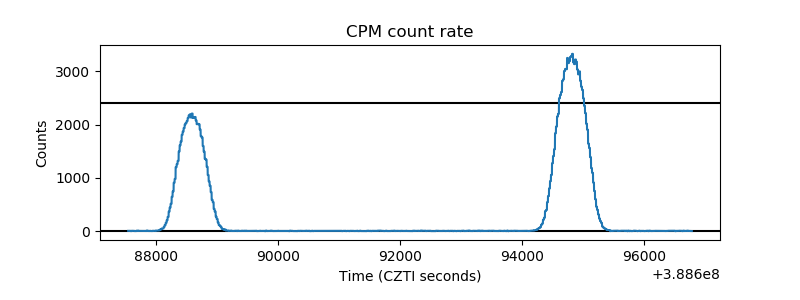 |
| CZT Counter | 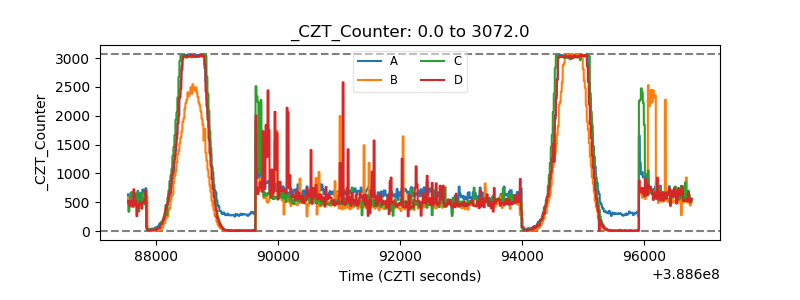 |
| +2.5 Volts monitor | 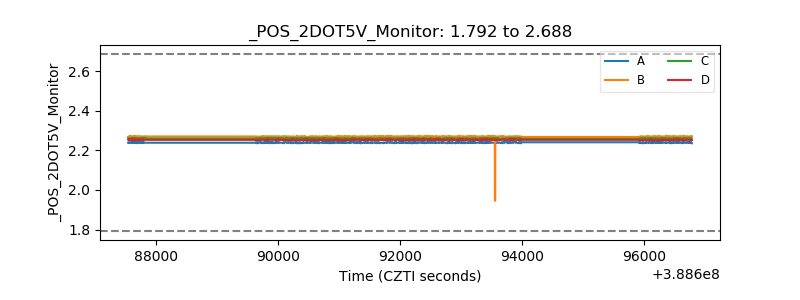 |
| +5 Volts monitor | 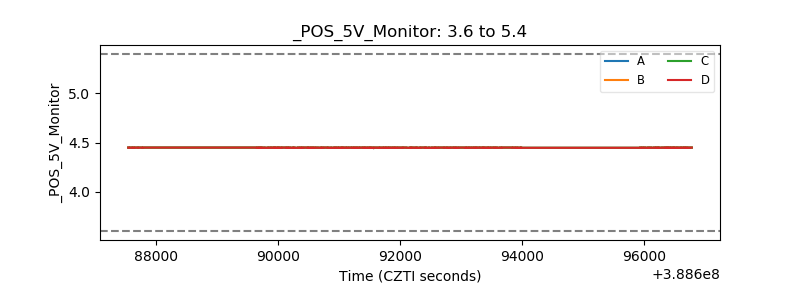 |
| _ROLL_ROT | 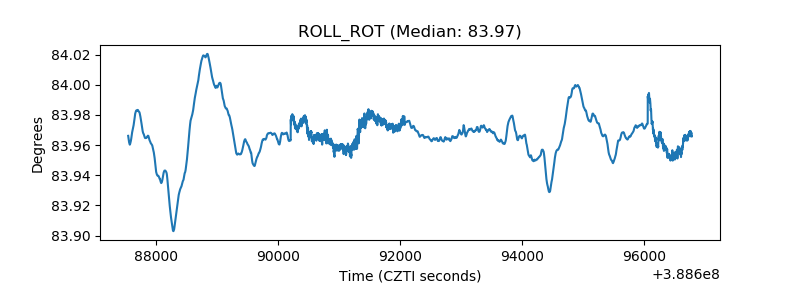 |
| _Roll_DEC | 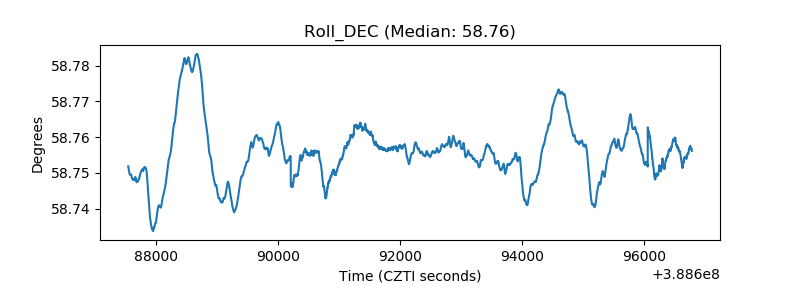 |
| _Roll_RA | 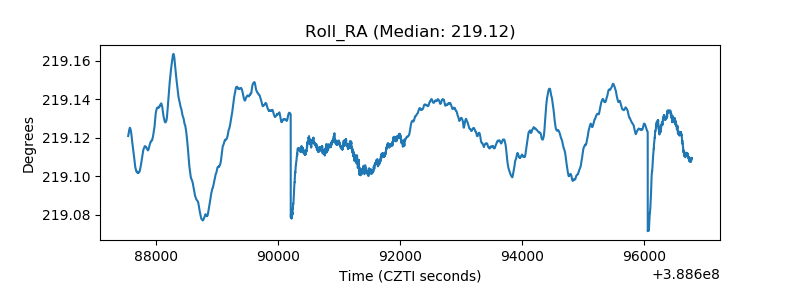 |
| Veto Counter | 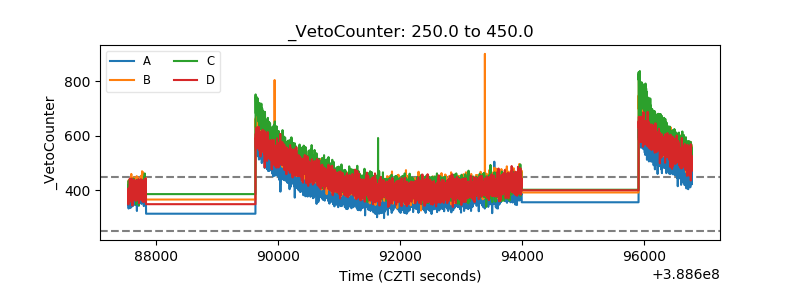 |