| Param | Original file | Final file |
|---|---|---|
| Filename | modeM0/AS1T05_026T01_9000005092_35563cztM0_level2.evt | modeM0/AS1T05_026T01_9000005092_35563cztM0_level2_quad_clean.evt |
| Size (bytes) | 431,519,040 | 96,816,960 |
| Size | 411.5 MB | 92.3 MB |
| Events in quadrant A | 3,388,903 | 638,000 |
| Events in quadrant B | 2,955,904 | 650,787 |
| Events in quadrant C | 2,981,189 | 652,838 |
| Events in quadrant D | 3,382,407 | 619,195 |
| Mode SS | |||
|---|---|---|---|
| Quadrant | BADHDUFLAG | Total packets | Discarded packets |
| A | 0 | 108 | 0 |
| B | 0 | 108 | 0 |
| C | 0 | 108 | 0 |
| D | 0 | 108 | 0 |
| Mode M9 | |||
|---|---|---|---|
| Quadrant | BADHDUFLAG | Total packets | Discarded packets |
| A | 0 | 18 | 0 |
| B | 0 | 18 | 0 |
| C | 0 | 18 | 0 |
| D | 0 | 19 | 0 |
| Mode M0 | |||
|---|---|---|---|
| Quadrant | BADHDUFLAG | Total packets | Discarded packets |
| A | 0 | 13932 | 3 |
| B | 0 | 12247 | 2 |
| C | 0 | 12066 | 2 |
| D | 0 | 13583 | 2 |
| Quadrant | Total seconds | Saturated seconds | Saturation percentage |
|---|---|---|---|
| A | 5305 | 16 | 0.301602% |
| B | 5305 | 126 | 2.375118% |
| C | 5305 | 126 | 2.375118% |
| D | 5305 | 125 | 2.356268% |
Noise dominated data is calculated using 1-second bins in cleaned event files. If a bin has >2000 counts, and if more than 50% of those come from <1% of pixels, then it is considered to be noise-dominated and hence unusable.
| Quadrant | # 1 sec bins | Bins with >0 counts | Bins with >2000 counts | High rate bins dominated by noise | Noise dominated (total time) | Noise dominated (detector-on time) | Marked lightcurve |
|---|---|---|---|---|---|---|---|
| A | 7097 | 5306 | 2 | 2 | 0.03% | 0.04% | 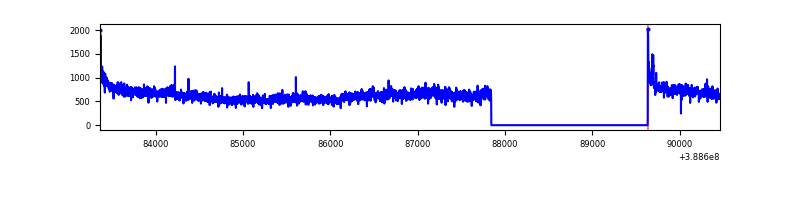 |
| B | 7097 | 5306 | 93 | 93 | 1.31% | 1.75% | 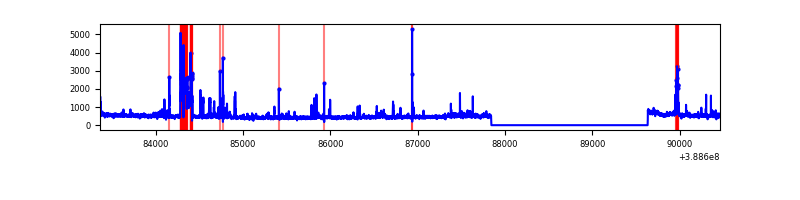 |
| C | 7097 | 5306 | 81 | 81 | 1.14% | 1.53% | 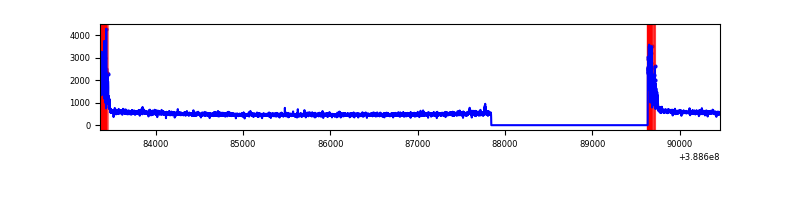 |
| D | 7097 | 5306 | 85 | 85 | 1.20% | 1.60% | 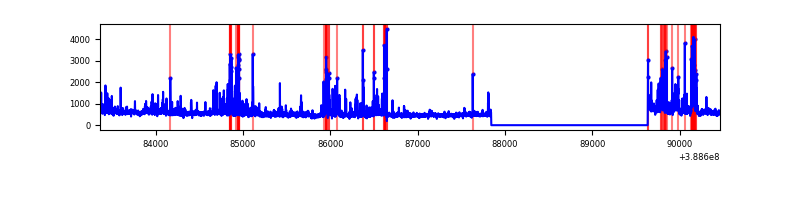 |
Top three noisy pixels from each quadrant. If the there are fewer than three noisy pixels in the level2.evt file, extra rows are filled as -1
| Pixel properties | Quadrant properties | ||||||
|---|---|---|---|---|---|---|---|
| Quadrant | DetID | PixID | Counts | Sigma | Mean | Median | Sigma |
| A | 15 | 169 | 830569 | 6649.47 | 617 | 604 | 124.8 |
| A | 10 | 83 | 140321 | 1119.38 | 617 | 604 | 124.8 |
| A | 13 | 6 | 18960 | 147.06 | 617 | 604 | 124.8 |
| B | 5 | 200 | 282128 | 2405.69 | 614 | 597 | 117.0 |
| B | 5 | 172 | 171177 | 1457.61 | 614 | 597 | 117.0 |
| B | 0 | 189 | 34499 | 289.69 | 614 | 597 | 117.0 |
| C | 0 | 10 | 334888 | 2361.06 | 612 | 617 | 141.6 |
| C | 15 | 214 | 238222 | 1678.28 | 612 | 617 | 141.6 |
| C | 14 | 67 | 18375 | 125.43 | 612 | 617 | 141.6 |
| D | 8 | 195 | 303123 | 2055.51 | 609 | 593 | 147.2 |
| D | 13 | 249 | 162010 | 1096.73 | 609 | 593 | 147.2 |
| D | 12 | 233 | 139347 | 942.75 | 609 | 593 | 147.2 |
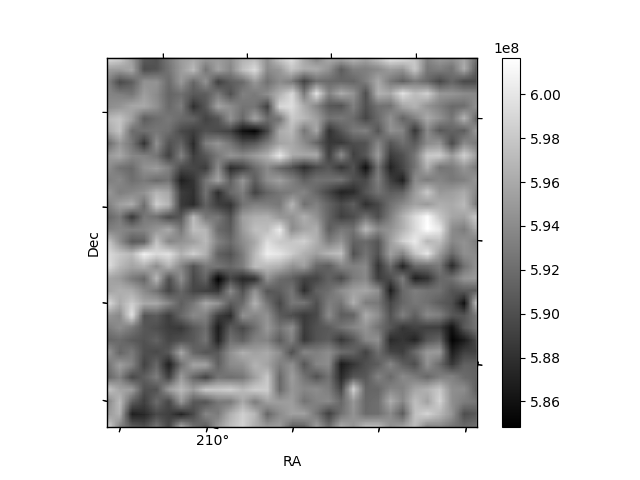
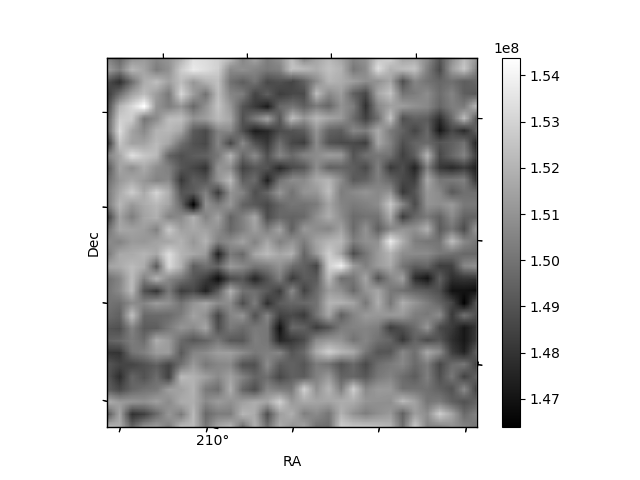
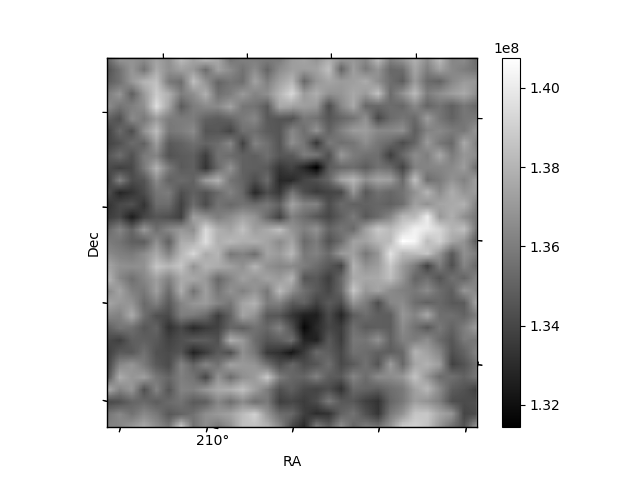
Histogram calculated using DETX and DETY for each event in the final _common_clean file
| Quadrant A | 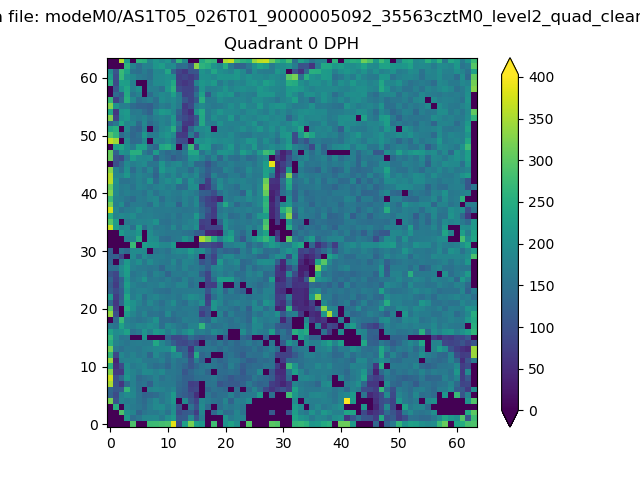 |
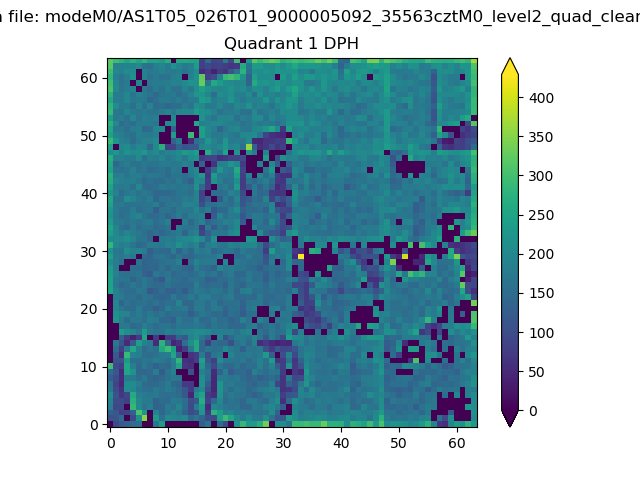 |
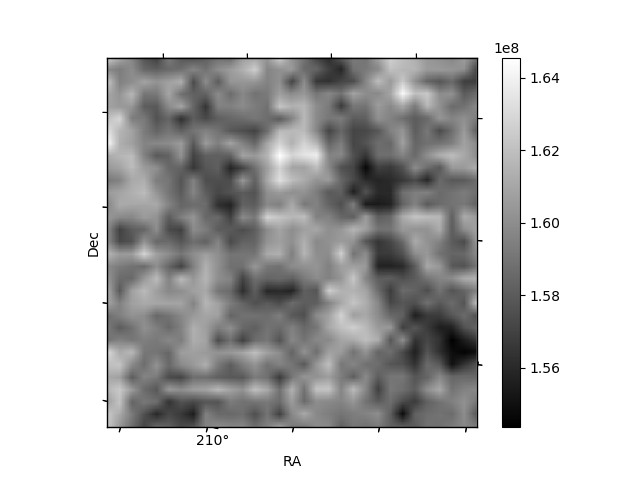
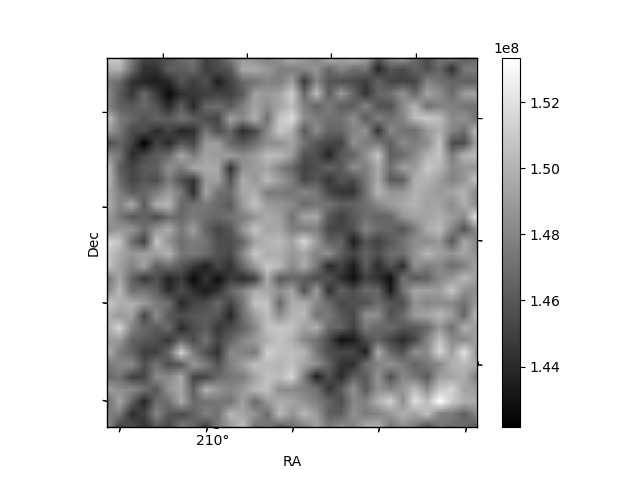
Quadrant B |
|---|---|---|---|
| Quadrant D | 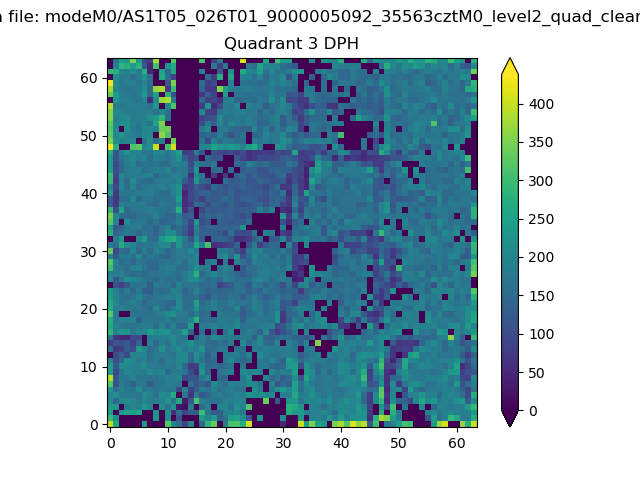 |
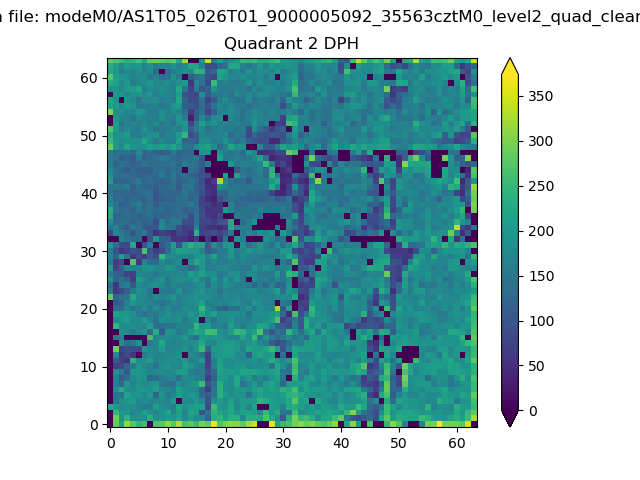 |
Quadrant C |
| Plot type | Count rate plots | Images |
|---|---|---|
| Comparison with Poisson distribution Blue bars denote a histogram of data divided into 1 sec bins. Red curve is a Poisson curve with rate = median count rate of data. |
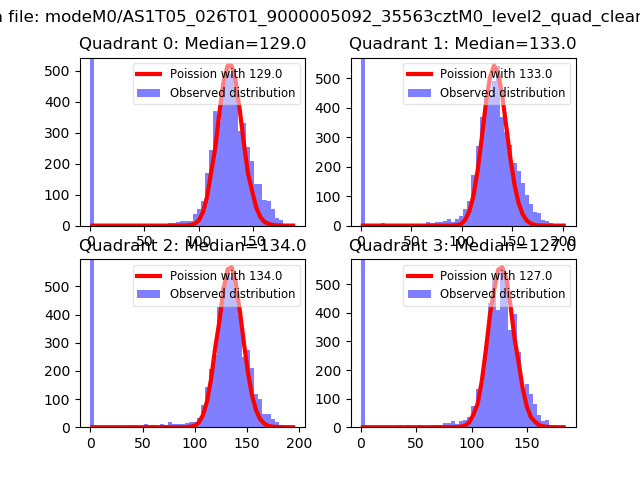 |
 |
| Quadrant-wise count rates Data is divided into 100 sec bins |
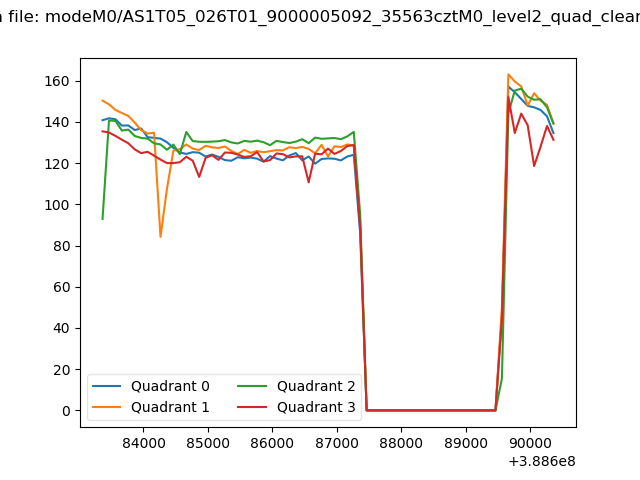 |
|
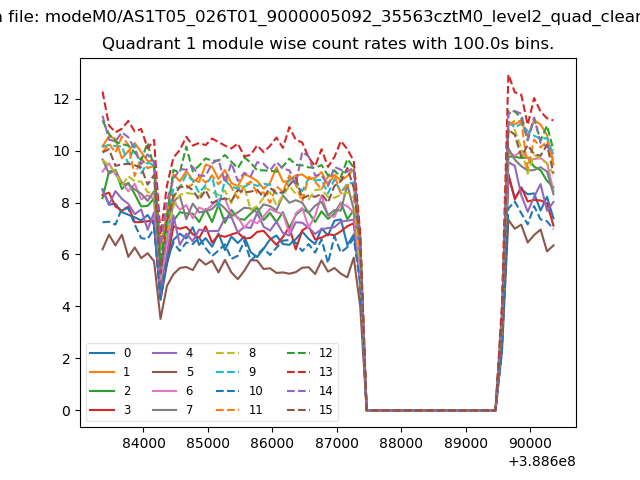
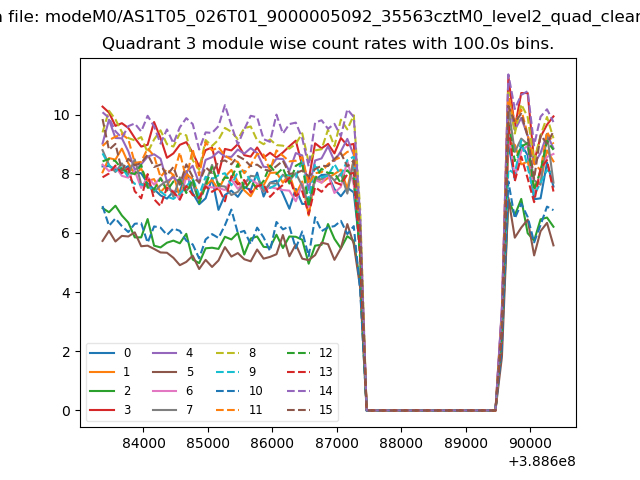
| Module-wise count rates for Quadrant A Data is divided into 100 sec bins |
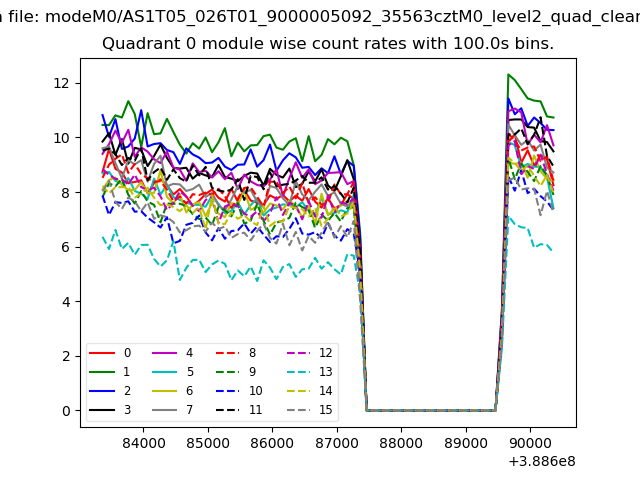 |
 |
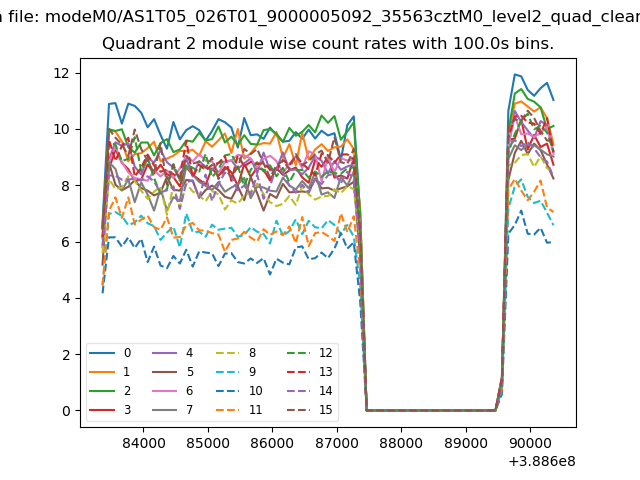
| Module-wise count rates for Quadrant B Data is divided into 100 sec bins |
 |
 |
| Module-wise count rates for Quadrant C Data is divided into 100 sec bins |
 |
 |
| Module-wise count rates for Quadrant D Data is divided into 100 sec bins |
 |
 |
| Parameter | Plot |
|---|---|
| CZT HV Monitor | 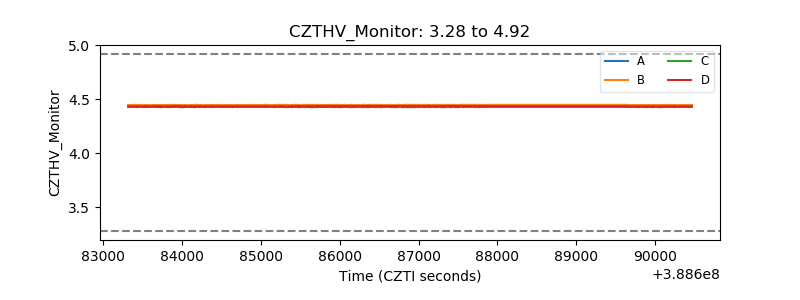 |
| D_VDD | 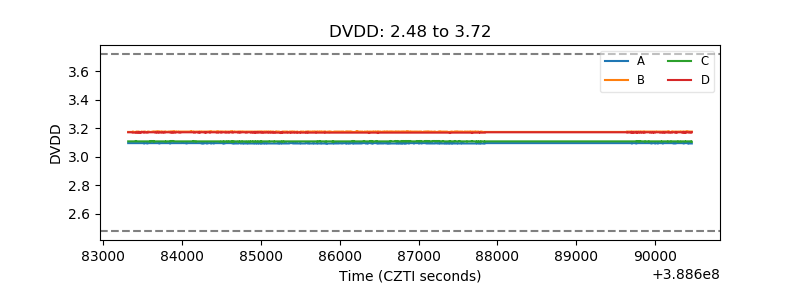 |
| Temperature 1 | 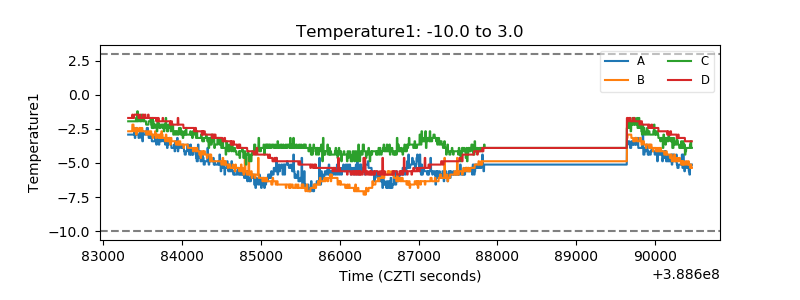 |
| Veto HV Monitor | 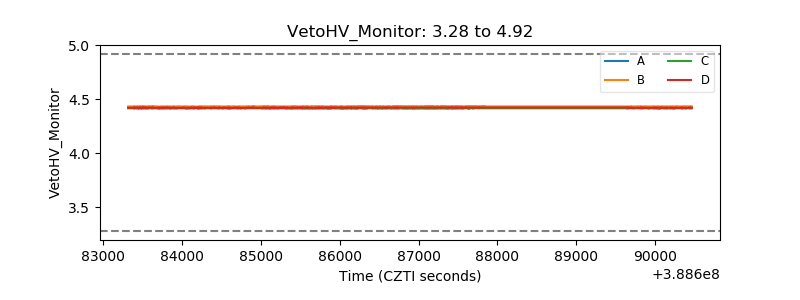 |
| Veto LLD | 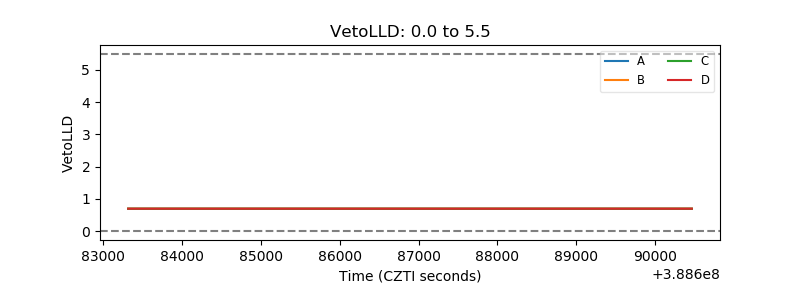 |
| Alpha Counter | 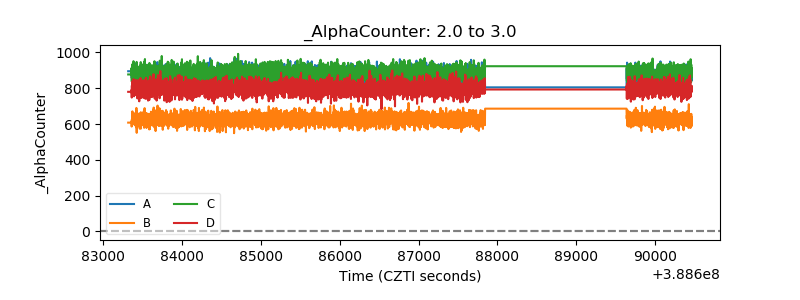 |
| _CPM_Rate | 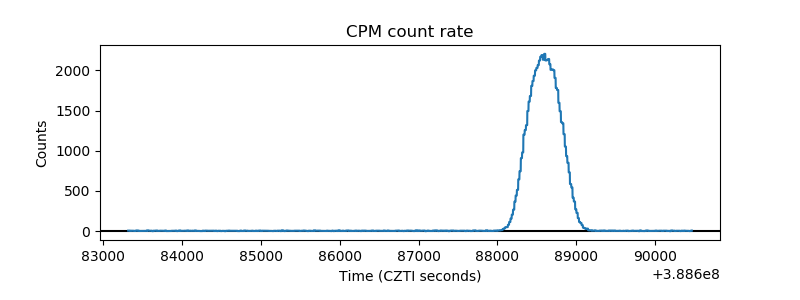 |
| CZT Counter | 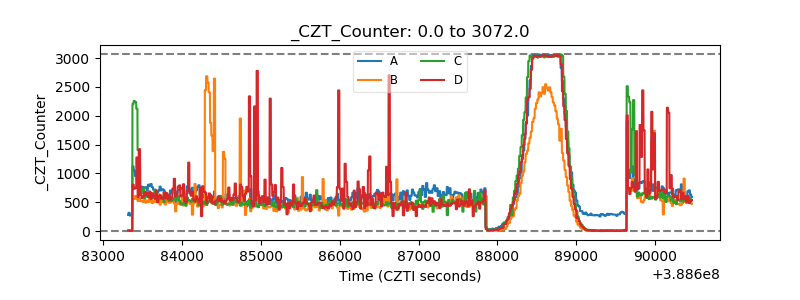 |
| +2.5 Volts monitor | 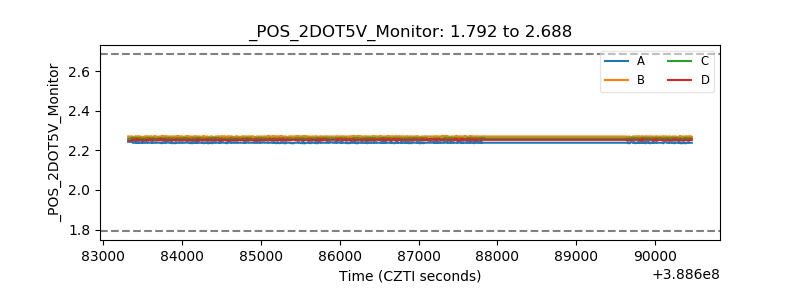 |
| +5 Volts monitor | 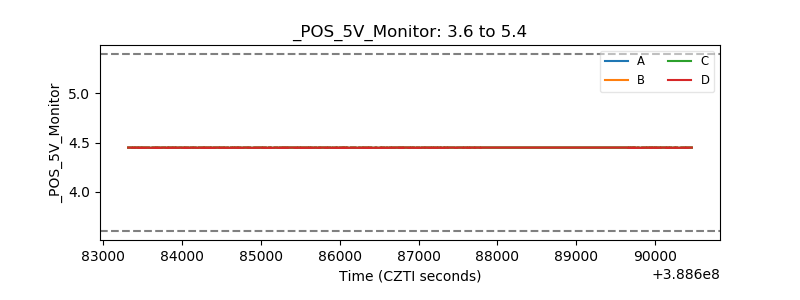 |
| _ROLL_ROT | 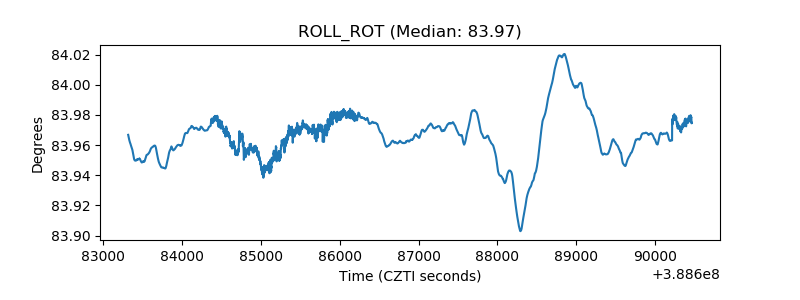 |
| _Roll_DEC | 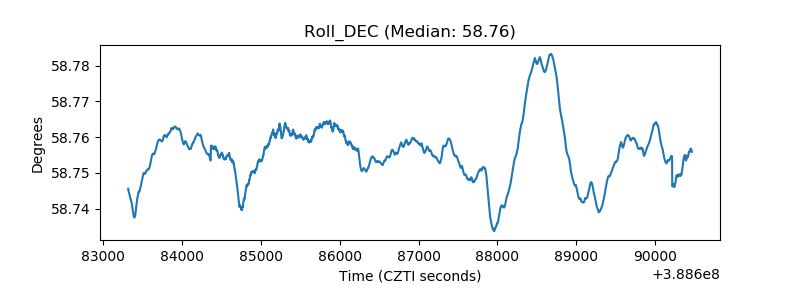 |
| _Roll_RA | 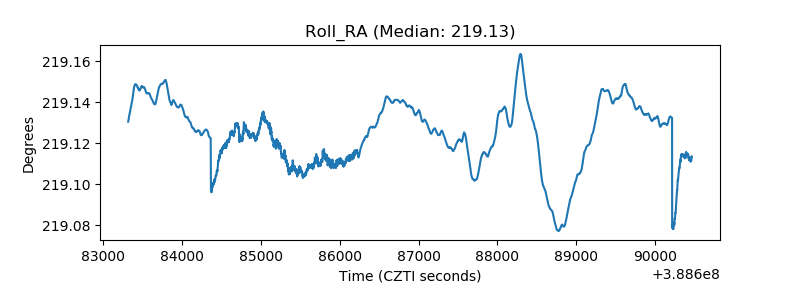 |
| Veto Counter | 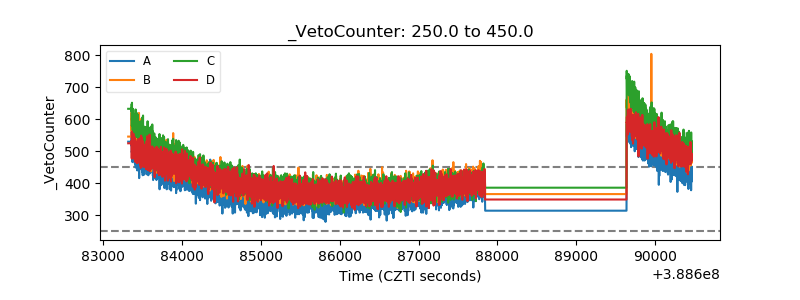 |