| Param | Original file | Final file |
|---|---|---|
| Filename | modeM0/AS1A11_093T01_9000005090_35550cztM0_level2.evt | modeM0/AS1A11_093T01_9000005090_35550cztM0_level2_quad_clean.evt |
| Size (bytes) | 745,545,600 | 81,354,240 |
| Size | 711.0 MB | 77.6 MB |
| Events in quadrant A | 12,752,620 | 44,476 |
| Events in quadrant B | 2,894,886 | 694,887 |
| Events in quadrant C | 3,025,130 | 708,282 |
| Events in quadrant D | 3,556,064 | 651,342 |
| Mode SS | |||
|---|---|---|---|
| Quadrant | BADHDUFLAG | Total packets | Discarded packets |
| A | 0 | 106 | 0 |
| B | 0 | 106 | 0 |
| C | 0 | 106 | 0 |
| D | 0 | 106 | 0 |
| Mode M0 | |||
|---|---|---|---|
| Quadrant | BADHDUFLAG | Total packets | Discarded packets |
| A | 0 | 41270 | 3 |
| B | 0 | 11898 | 2 |
| C | 0 | 12160 | 2 |
| D | 0 | 14111 | 2 |
| Mode M9 | |||
|---|---|---|---|
| Quadrant | BADHDUFLAG | Total packets | Discarded packets |
| A | 0 | 21 | 0 |
| B | 0 | 21 | 0 |
| C | 0 | 21 | 0 |
| D | 0 | 22 | 0 |
| Quadrant | Total seconds | Saturated seconds | Saturation percentage |
|---|---|---|---|
| A | 5170 | 5165 | 99.903288% |
| B | 5170 | 129 | 2.495164% |
| C | 5170 | 120 | 2.321083% |
| D | 5170 | 259 | 5.009671% |
Noise dominated data is calculated using 1-second bins in cleaned event files. If a bin has >2000 counts, and if more than 50% of those come from <1% of pixels, then it is considered to be noise-dominated and hence unusable.
| Quadrant | # 1 sec bins | Bins with >0 counts | Bins with >2000 counts | High rate bins dominated by noise | Noise dominated (total time) | Noise dominated (detector-on time) | Marked lightcurve |
|---|---|---|---|---|---|---|---|
| A | 7112 | 5169 | 4937 | 4937 | 69.42% | 95.51% | 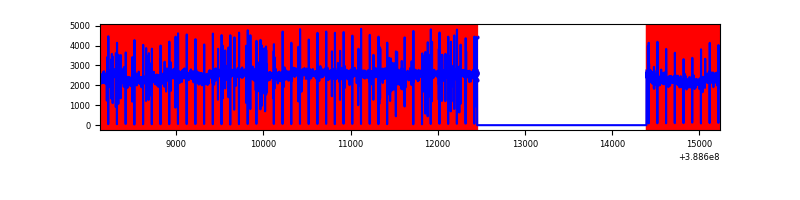 |
| B | 7113 | 5171 | 81 | 81 | 1.14% | 1.57% | 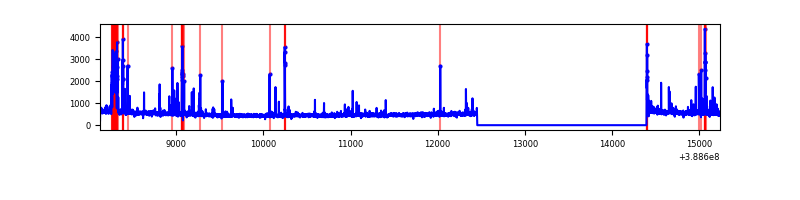 |
| C | 7113 | 5171 | 91 | 91 | 1.28% | 1.76% | 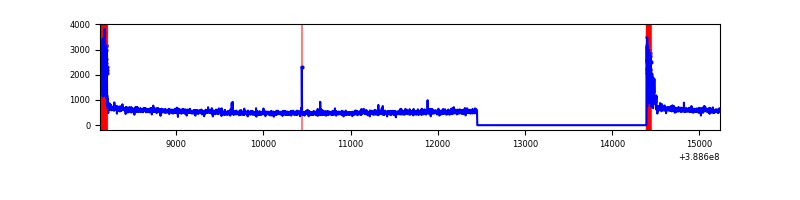 |
| D | 7113 | 5171 | 185 | 185 | 2.60% | 3.58% | 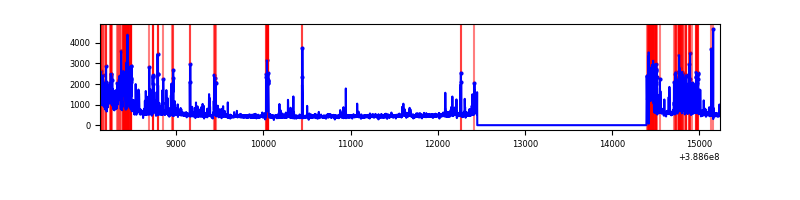 |
Top three noisy pixels from each quadrant. If the there are fewer than three noisy pixels in the level2.evt file, extra rows are filled as -1
| Pixel properties | Quadrant properties | ||||||
|---|---|---|---|---|---|---|---|
| Quadrant | DetID | PixID | Counts | Sigma | Mean | Median | Sigma |
| A | 15 | 169 | 12406948 | 711575.61 | 79 | 77 | 17.4 |
| A | 10 | 83 | 18011 | 1028.57 | 79 | 77 | 17.4 |
| A | 9 | 143 | 17140 | 978.62 | 79 | 77 | 17.4 |
| B | 5 | 172 | 369033 | 3137.55 | 629 | 612 | 117.4 |
| B | 4 | 81 | 23213 | 192.47 | 629 | 612 | 117.4 |
| B | 0 | 189 | 16898 | 138.69 | 629 | 612 | 117.4 |
| C | 0 | 10 | 298684 | 2047.07 | 633 | 638 | 145.6 |
| C | 15 | 214 | 231864 | 1588.13 | 633 | 638 | 145.6 |
| C | 14 | 67 | 18520 | 122.82 | 633 | 638 | 145.6 |
| D | 2 | 153 | 464289 | 3181.44 | 615 | 601 | 145.7 |
| D | 2 | 250 | 294914 | 2019.33 | 615 | 601 | 145.7 |
| D | 10 | 118 | 163283 | 1116.19 | 615 | 601 | 145.7 |
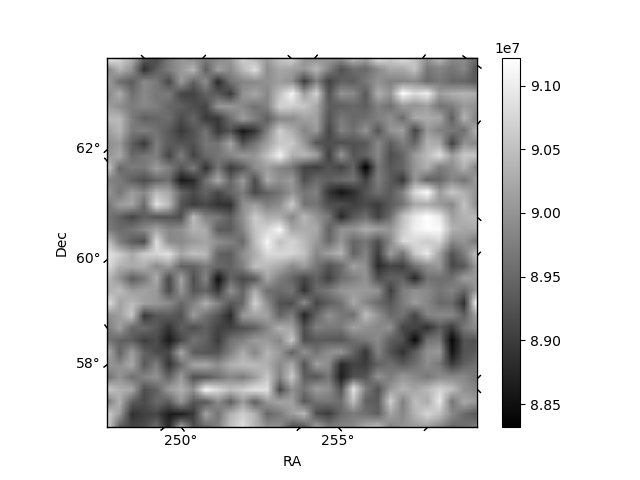
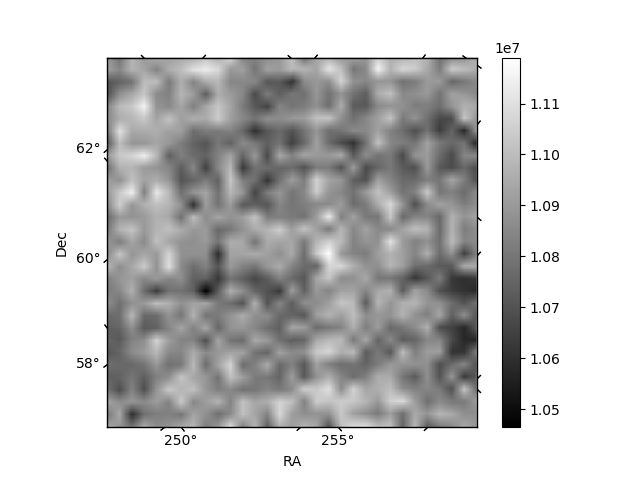
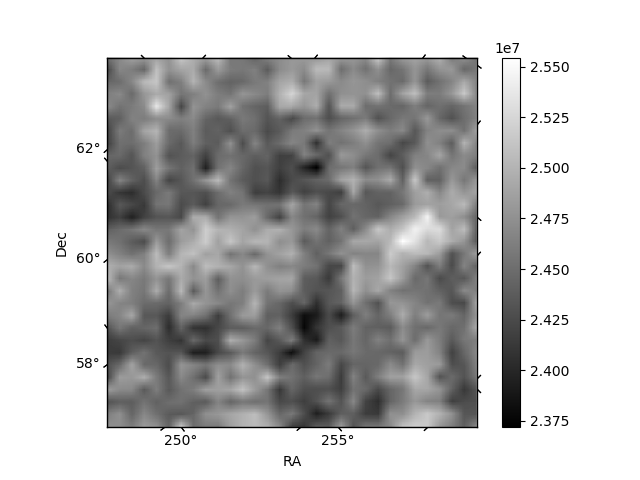
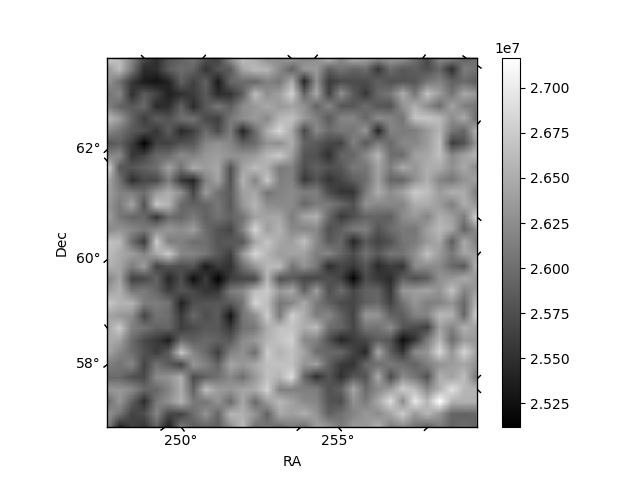
Histogram calculated using DETX and DETY for each event in the final _common_clean file
| Quadrant A | 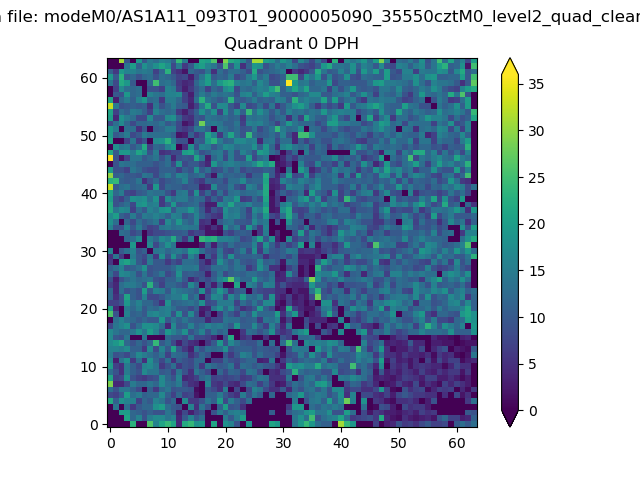 |
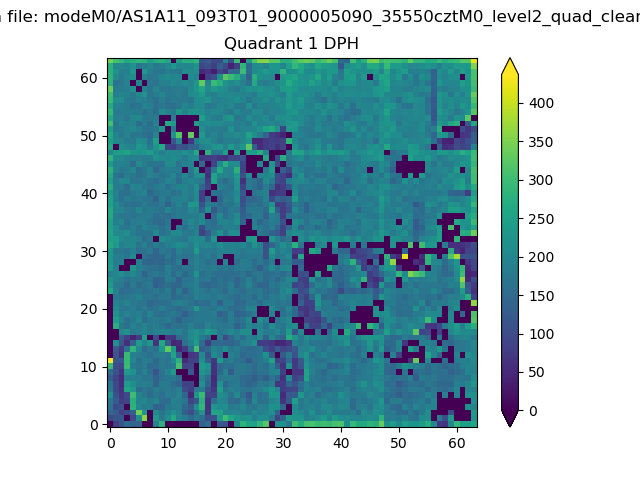 |
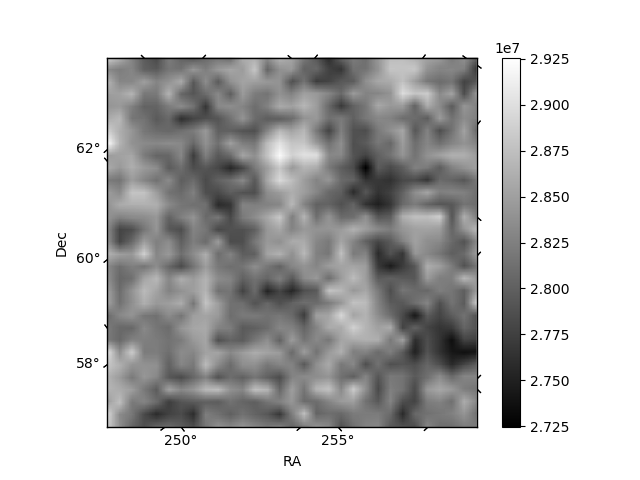
Quadrant B |
|---|---|---|---|
| Quadrant D | 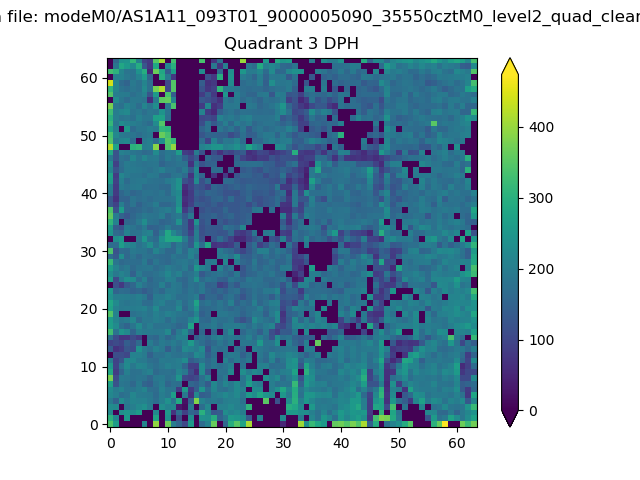 |
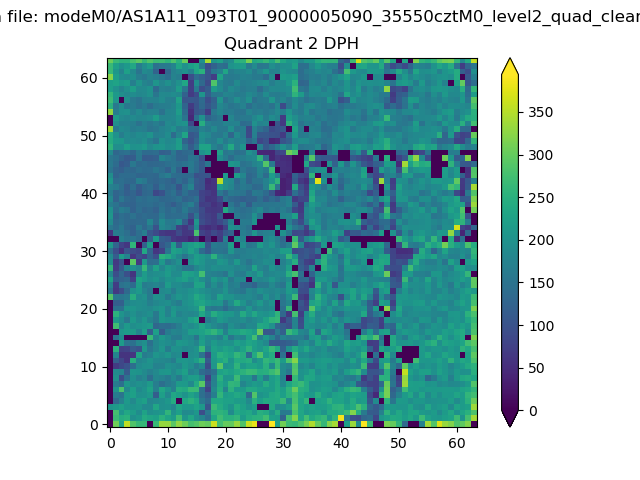 |
Quadrant C |
| Plot type | Count rate plots | Images |
|---|---|---|
| Comparison with Poisson distribution Blue bars denote a histogram of data divided into 1 sec bins. Red curve is a Poisson curve with rate = median count rate of data. |
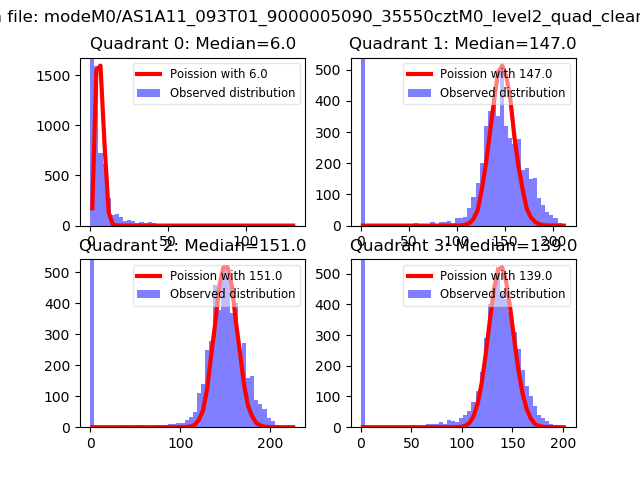 |
 |
| Quadrant-wise count rates Data is divided into 100 sec bins |
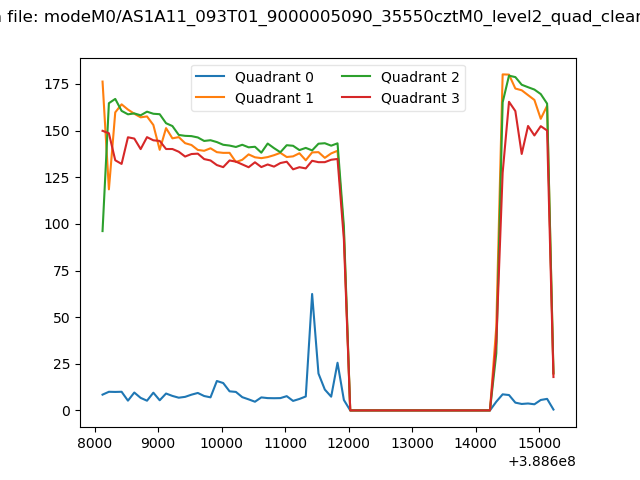 |
|
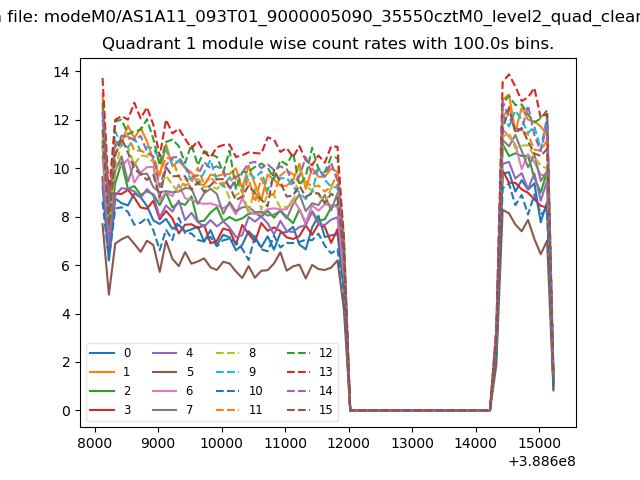
| Module-wise count rates for Quadrant A Data is divided into 100 sec bins |
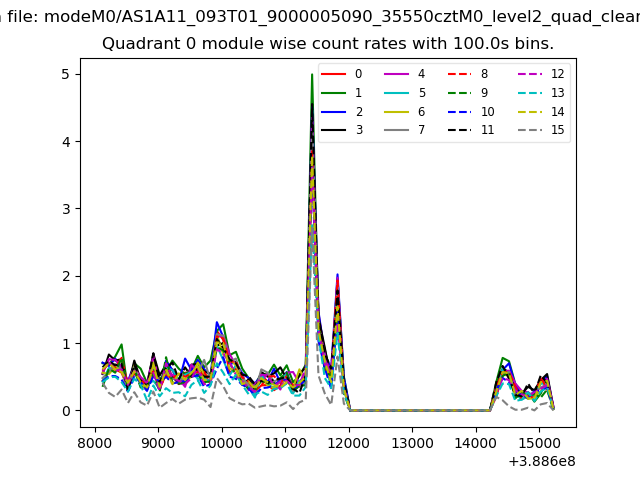 |
 |
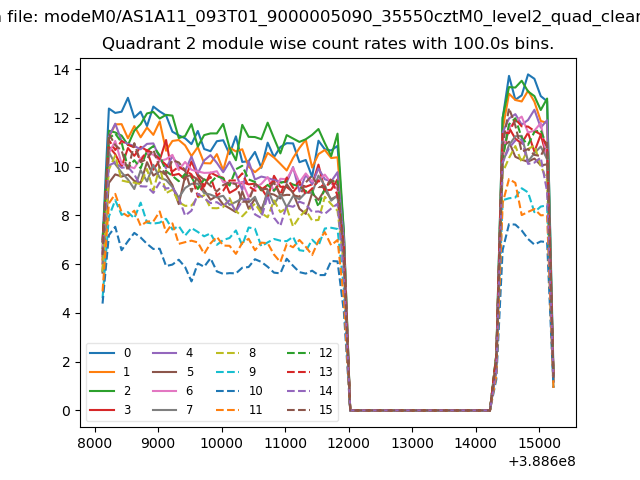
| Module-wise count rates for Quadrant B Data is divided into 100 sec bins |
 |
 |
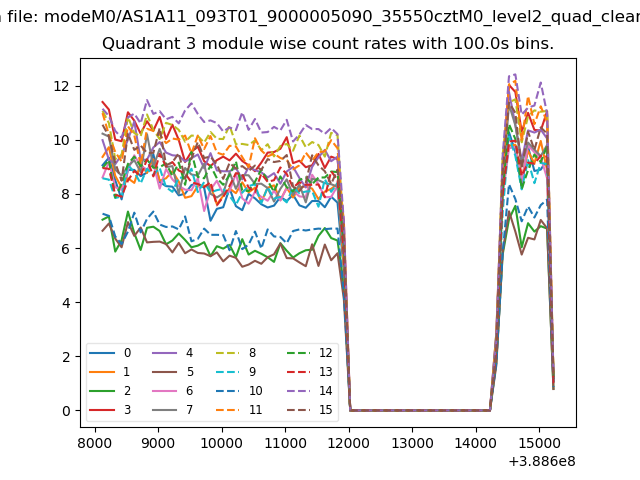
| Module-wise count rates for Quadrant C Data is divided into 100 sec bins |
 |
 |
| Module-wise count rates for Quadrant D Data is divided into 100 sec bins |
 |
 |
| Parameter | Plot |
|---|---|
| CZT HV Monitor | 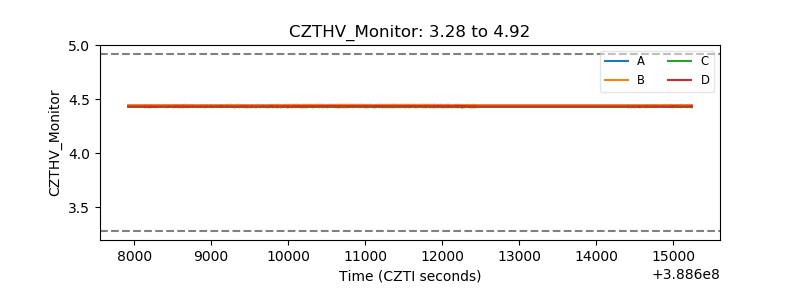 |
| D_VDD | 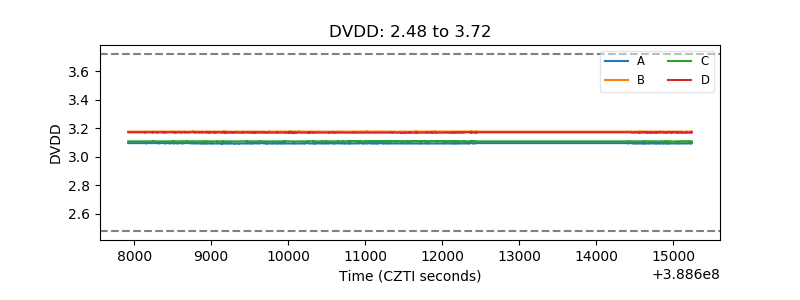 |
| Temperature 1 | 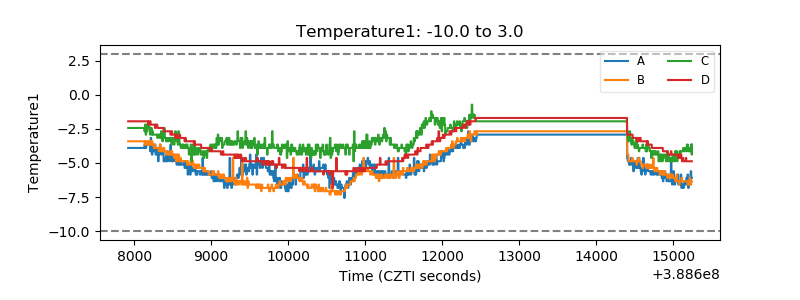 |
| Veto HV Monitor | 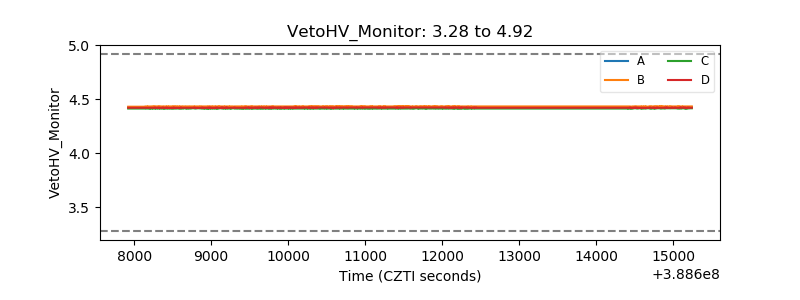 |
| Veto LLD | 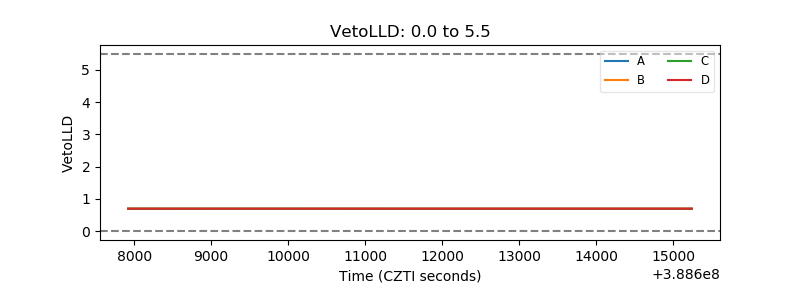 |
| Alpha Counter | 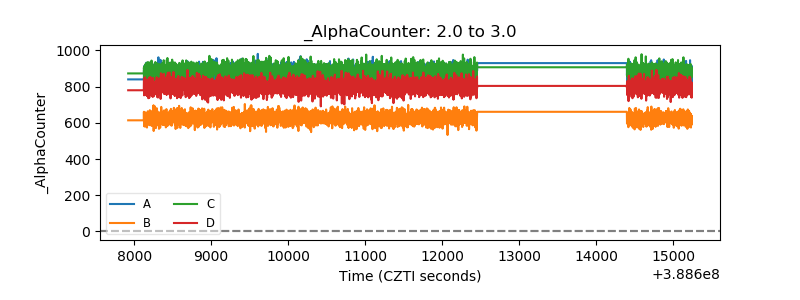 |
| _CPM_Rate | 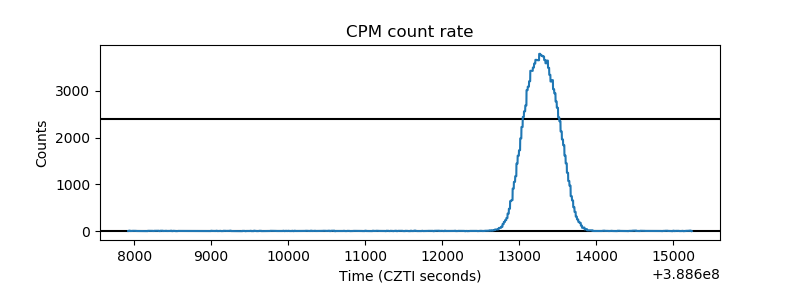 |
| CZT Counter | 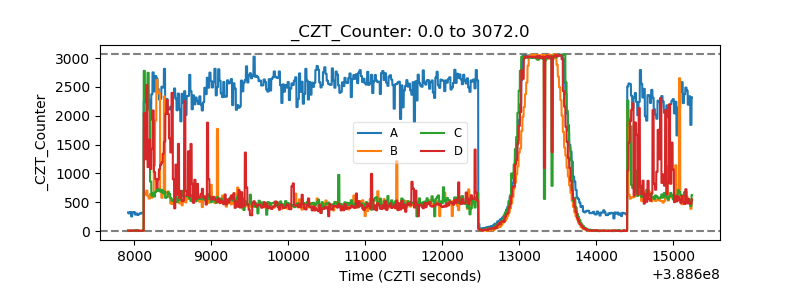 |
| +2.5 Volts monitor | 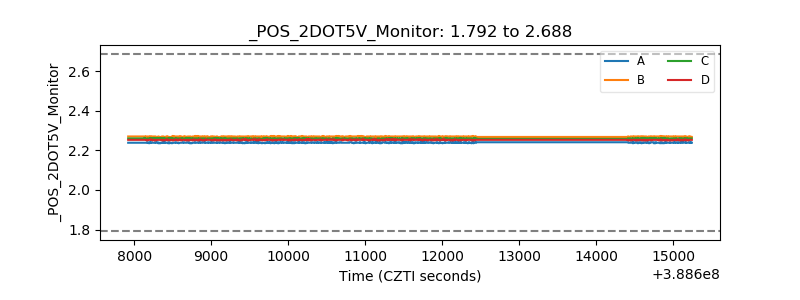 |
| +5 Volts monitor | 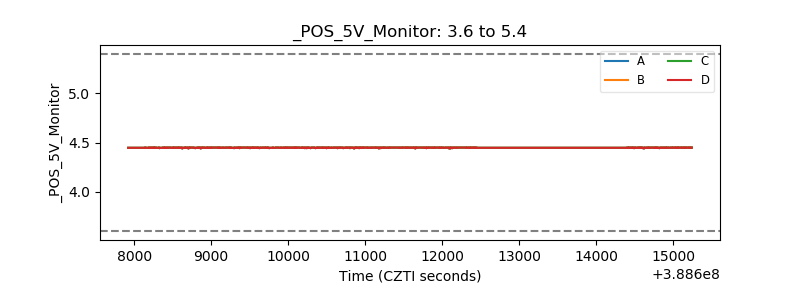 |
| _ROLL_ROT | 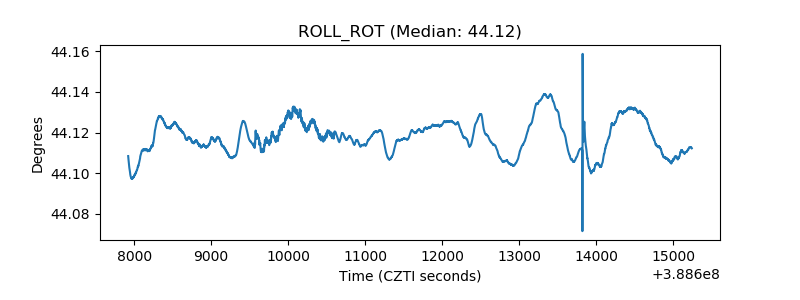 |
| _Roll_DEC | 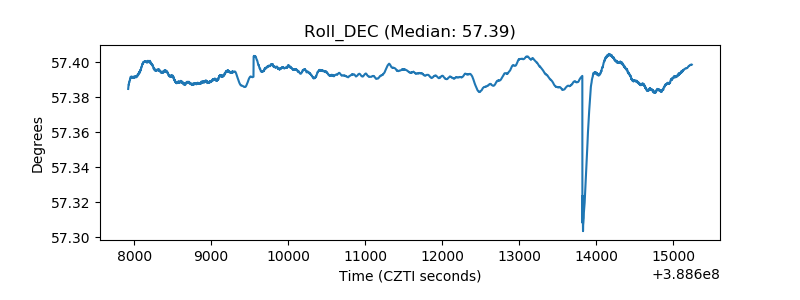 |
| _Roll_RA | 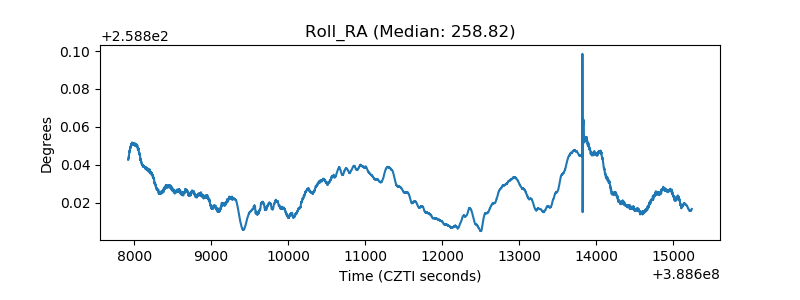 |
| Veto Counter | 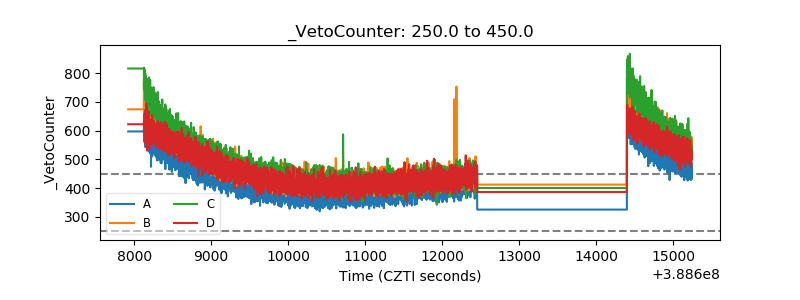 |