| Param | Original file | Final file |
|---|---|---|
| Filename | modeM0/AS1A11_046T08_9000005088_35546cztM0_level2.evt | modeM0/AS1A11_046T08_9000005088_35546cztM0_level2_quad_clean.evt |
| Size (bytes) | 1,378,117,440 | 224,035,200 |
| Size | 1.3 GB | 213.7 MB |
| Events in quadrant A | 11,461,550 | 1,371,443 |
| Events in quadrant B | 9,081,396 | 1,436,794 |
| Events in quadrant C | 8,927,692 | 1,458,742 |
| Events in quadrant D | 11,144,126 | 1,371,545 |
| Mode M0 | |||
|---|---|---|---|
| Quadrant | BADHDUFLAG | Total packets | Discarded packets |
| A | 0 | 45020 | 3 |
| B | 0 | 37812 | 3 |
| C | 0 | 36052 | 3 |
| D | 0 | 44017 | 3 |
| Mode SS | |||
|---|---|---|---|
| Quadrant | BADHDUFLAG | Total packets | Discarded packets |
| A | 0 | 336 | 0 |
| B | 0 | 336 | 0 |
| C | 0 | 336 | 0 |
| D | 0 | 336 | 0 |
| Mode M9 | |||
|---|---|---|---|
| Quadrant | BADHDUFLAG | Total packets | Discarded packets |
| A | 0 | 40 | 0 |
| B | 0 | 40 | 0 |
| C | 0 | 40 | 0 |
| D | 0 | 40 | 0 |
| Quadrant | Total seconds | Saturated seconds | Saturation percentage |
|---|---|---|---|
| A | 16630 | 930 | 5.592303% |
| B | 16630 | 282 | 1.695731% |
| C | 16630 | 86 | 0.517138% |
| D | 16630 | 577 | 3.469633% |
Noise dominated data is calculated using 1-second bins in cleaned event files. If a bin has >2000 counts, and if more than 50% of those come from <1% of pixels, then it is considered to be noise-dominated and hence unusable.
| Quadrant | # 1 sec bins | Bins with >0 counts | Bins with >2000 counts | High rate bins dominated by noise | Noise dominated (total time) | Noise dominated (detector-on time) | Marked lightcurve |
|---|---|---|---|---|---|---|---|
| A | 20632 | 16633 | 765 | 765 | 3.71% | 4.60% | 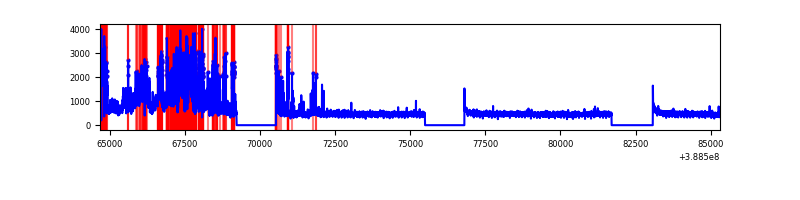 |
| B | 20632 | 16633 | 147 | 147 | 0.71% | 0.88% | 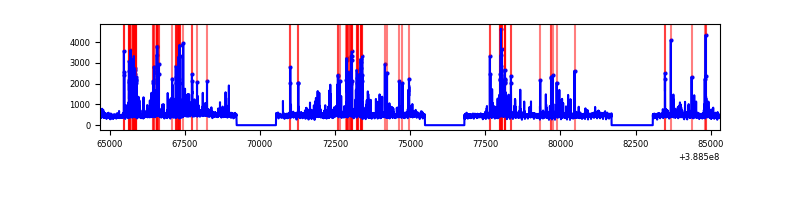 |
| C | 20632 | 16633 | 62 | 62 | 0.30% | 0.37% | 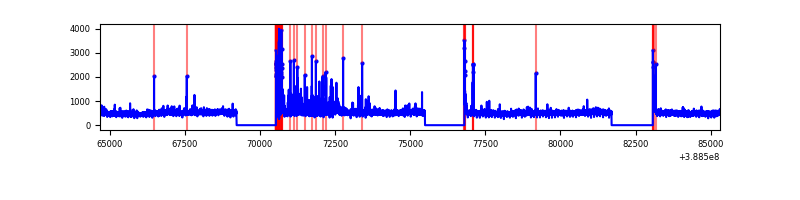 |
| D | 20632 | 16633 | 437 | 437 | 2.12% | 2.63% | 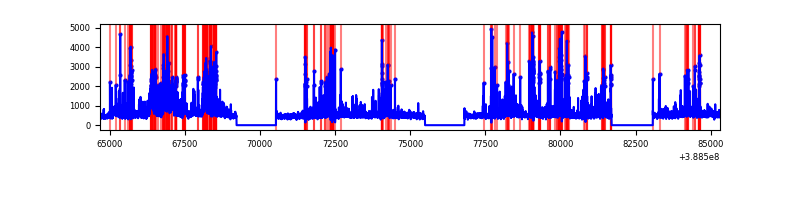 |
Top three noisy pixels from each quadrant. If the there are fewer than three noisy pixels in the level2.evt file, extra rows are filled as -1
| Pixel properties | Quadrant properties | ||||||
|---|---|---|---|---|---|---|---|
| Quadrant | DetID | PixID | Counts | Sigma | Mean | Median | Sigma |
| A | 15 | 169 | 3848632 | 10331.61 | 1852 | 1810 | 372.3 |
| A | 10 | 83 | 325204 | 868.56 | 1852 | 1810 | 372.3 |
| A | 9 | 143 | 83863 | 220.37 | 1852 | 1810 | 372.3 |
| B | 5 | 236 | 681210 | 1920.02 | 1871 | 1821 | 353.8 |
| B | 5 | 172 | 631674 | 1780.03 | 1871 | 1821 | 353.8 |
| B | 0 | 190 | 116171 | 323.16 | 1871 | 1821 | 353.8 |
| C | 15 | 214 | 736858 | 1732.16 | 1850 | 1867 | 424.3 |
| C | 0 | 10 | 595373 | 1398.72 | 1850 | 1867 | 424.3 |
| C | 14 | 128 | 194207 | 453.29 | 1850 | 1867 | 424.3 |
| D | 12 | 235 | 1249178 | 2798.4 | 1831 | 1776 | 445.8 |
| D | 8 | 195 | 732597 | 1639.51 | 1831 | 1776 | 445.8 |
| D | 10 | 118 | 565089 | 1263.73 | 1831 | 1776 | 445.8 |
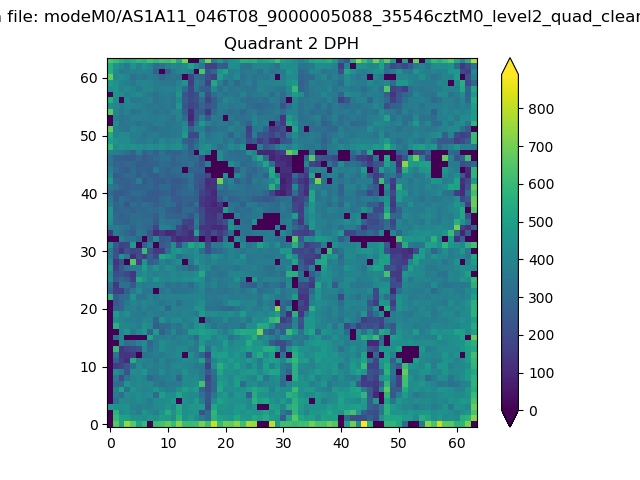
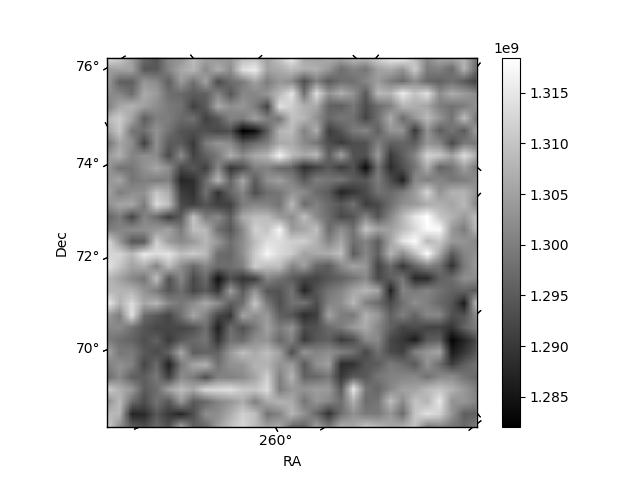
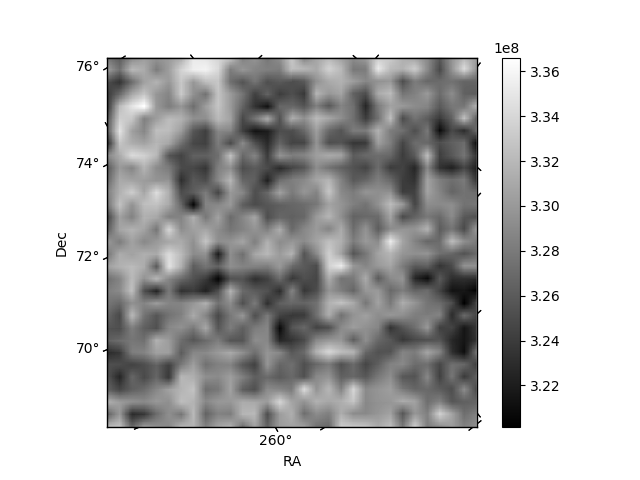
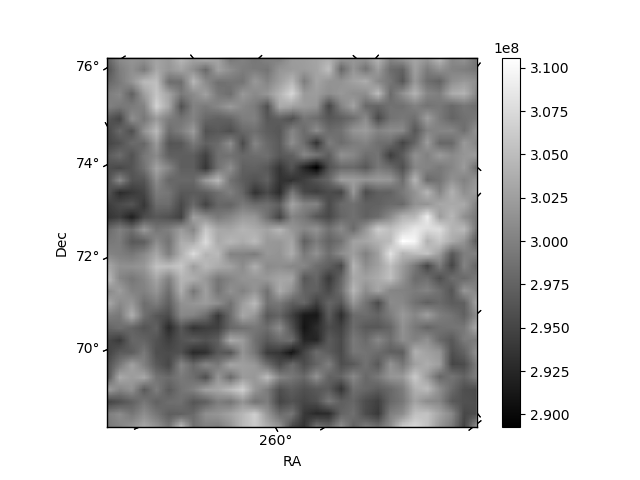
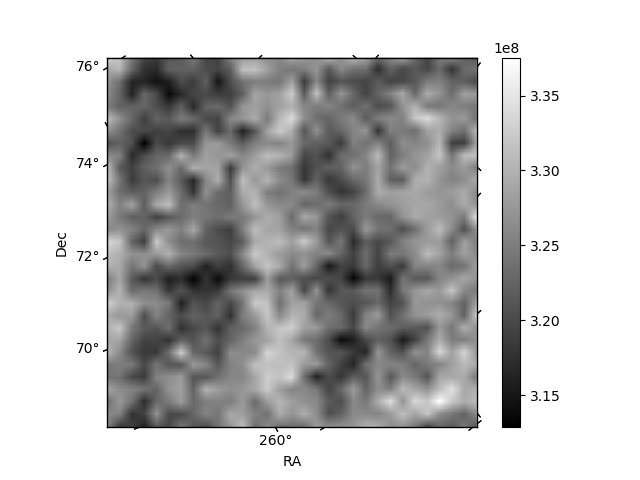
Histogram calculated using DETX and DETY for each event in the final _common_clean file
| Quadrant A | 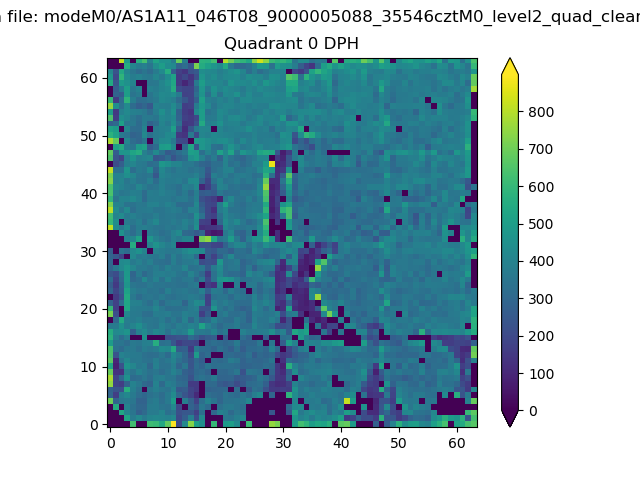 |
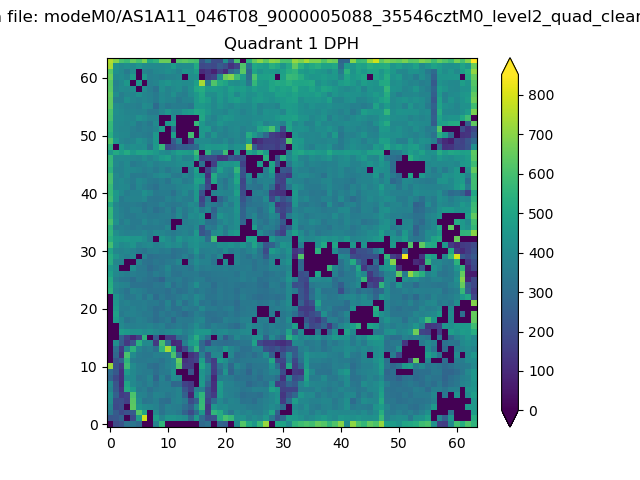 |
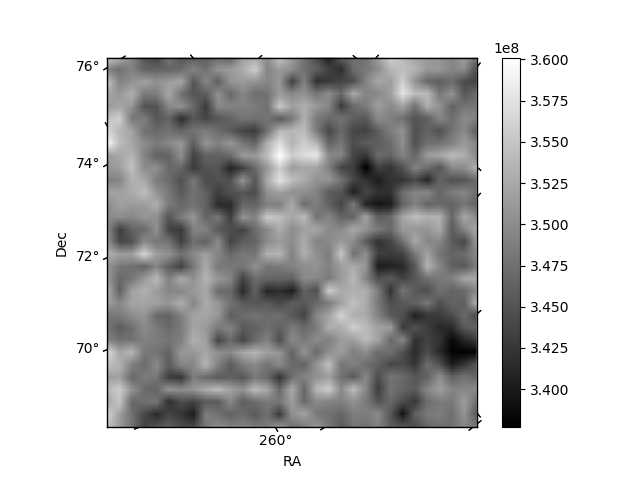
Quadrant B |
|---|---|---|---|
| Quadrant D | 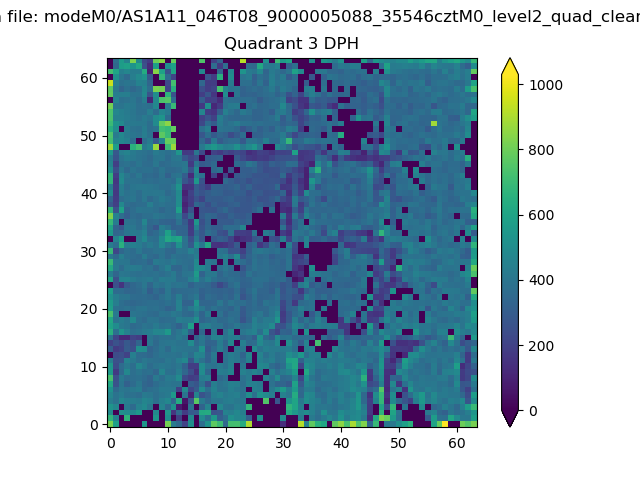 |
 |
Quadrant C |
| Plot type | Count rate plots | Images |
|---|---|---|
| Comparison with Poisson distribution Blue bars denote a histogram of data divided into 1 sec bins. Red curve is a Poisson curve with rate = median count rate of data. |
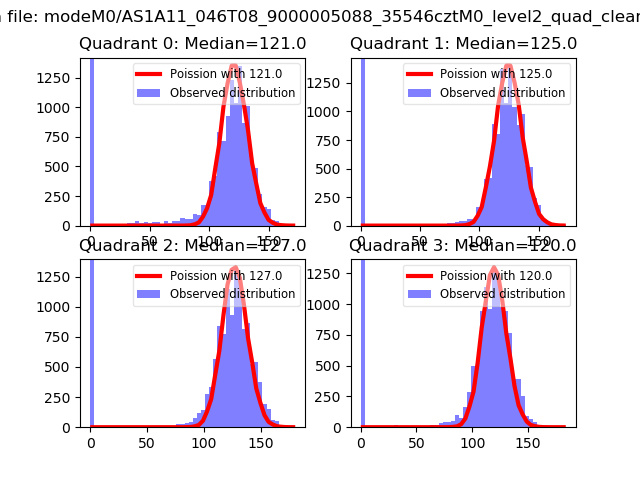 |
 |
| Quadrant-wise count rates Data is divided into 100 sec bins |
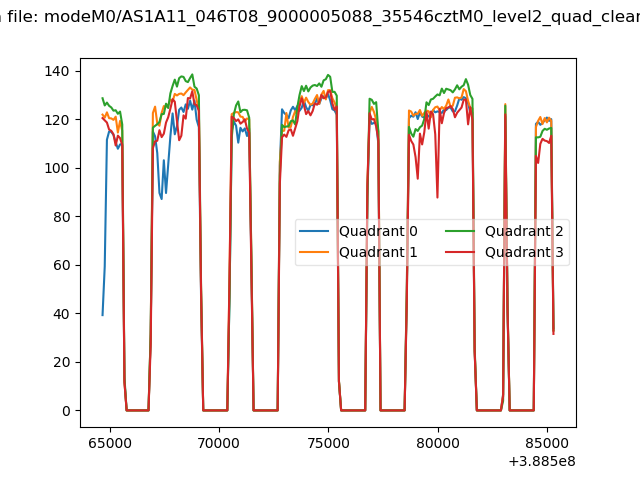 |
|
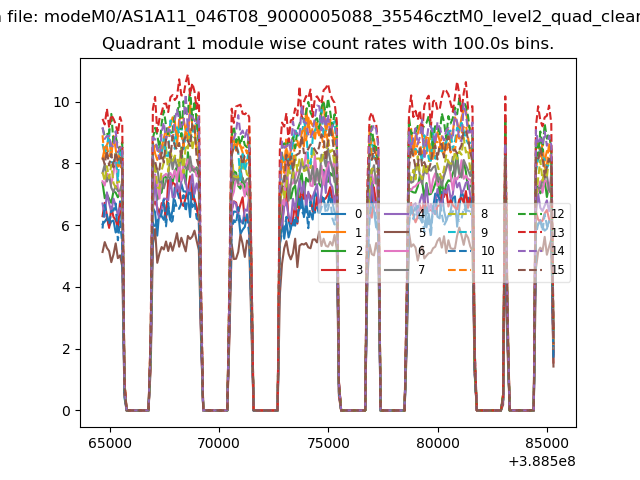
| Module-wise count rates for Quadrant A Data is divided into 100 sec bins |
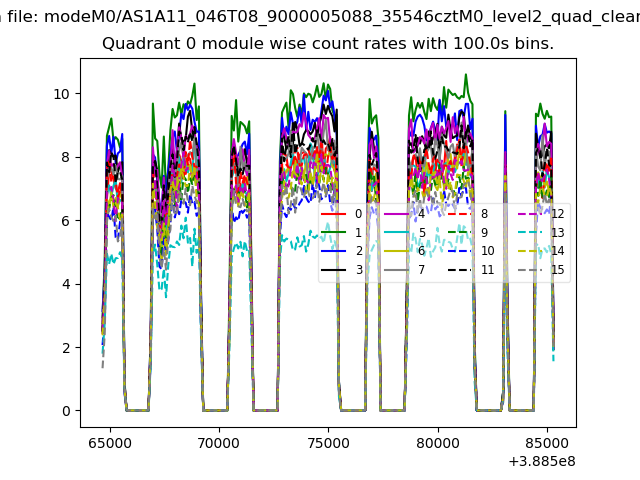 |
 |
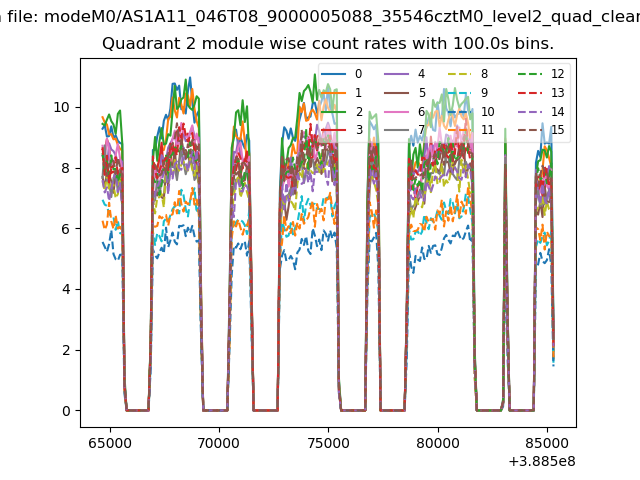
| Module-wise count rates for Quadrant B Data is divided into 100 sec bins |
 |
 |
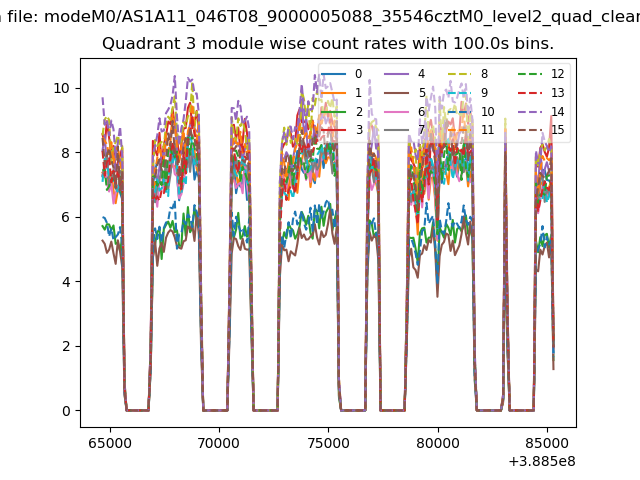
| Module-wise count rates for Quadrant C Data is divided into 100 sec bins |
 |
 |
| Module-wise count rates for Quadrant D Data is divided into 100 sec bins |
 |
 |
| Parameter | Plot |
|---|---|
| CZT HV Monitor | 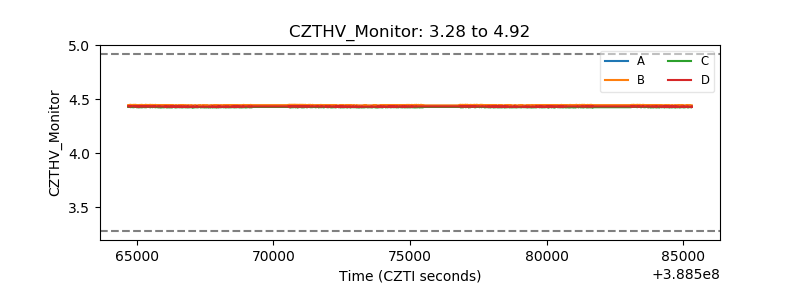 |
| D_VDD | 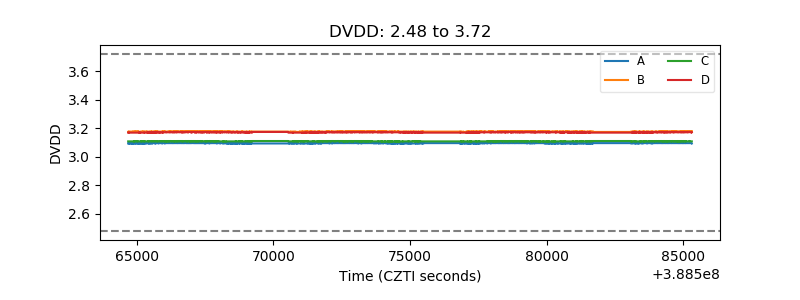 |
| Temperature 1 | 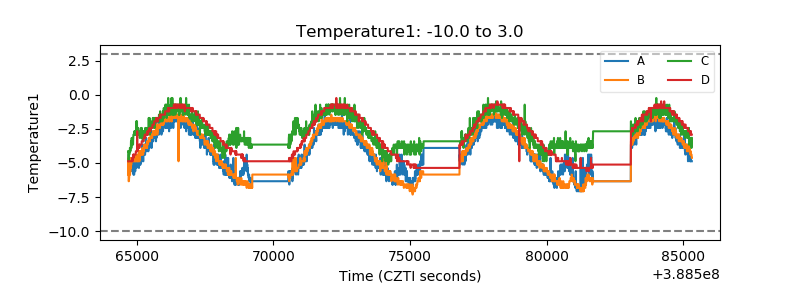 |
| Veto HV Monitor | 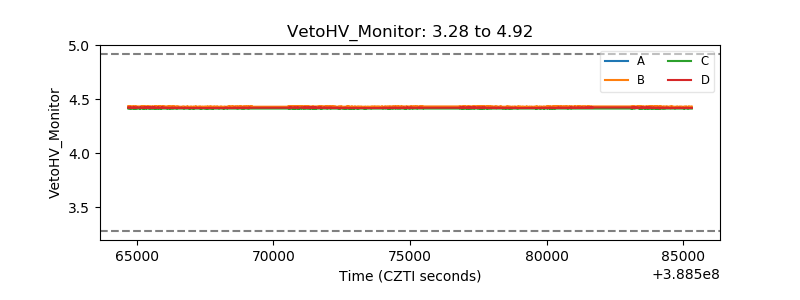 |
| Veto LLD | 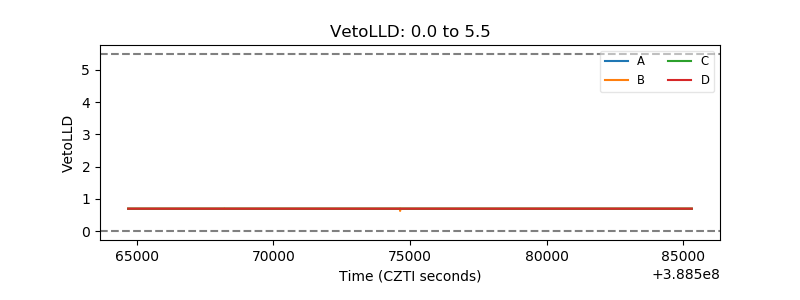 |
| Alpha Counter | 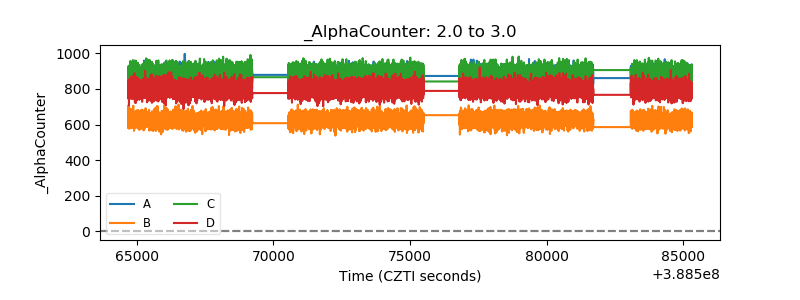 |
| _CPM_Rate | 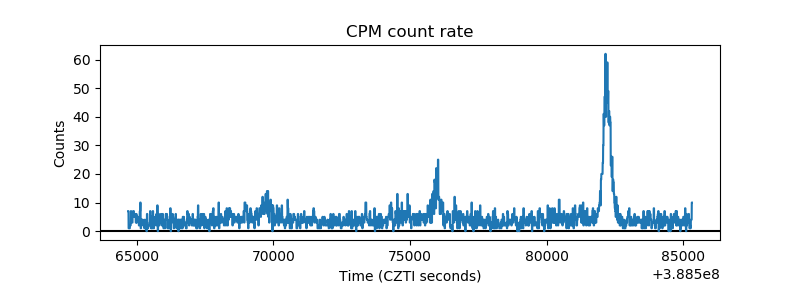 |
| CZT Counter | 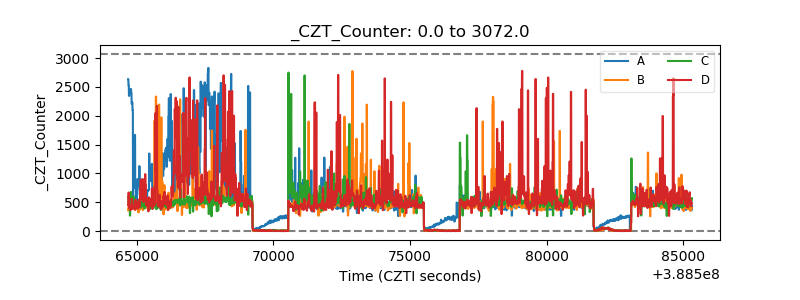 |
| +2.5 Volts monitor | 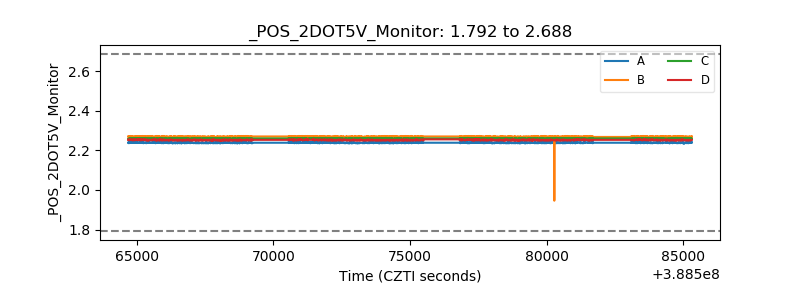 |
| +5 Volts monitor | 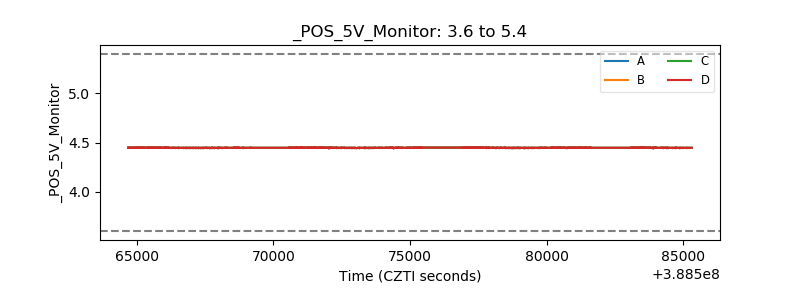 |
| _ROLL_ROT | 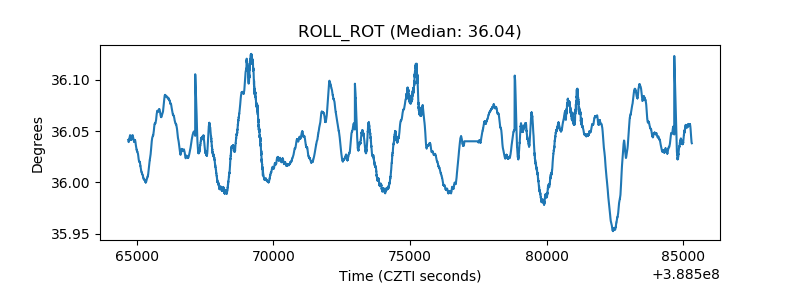 |
| _Roll_DEC | 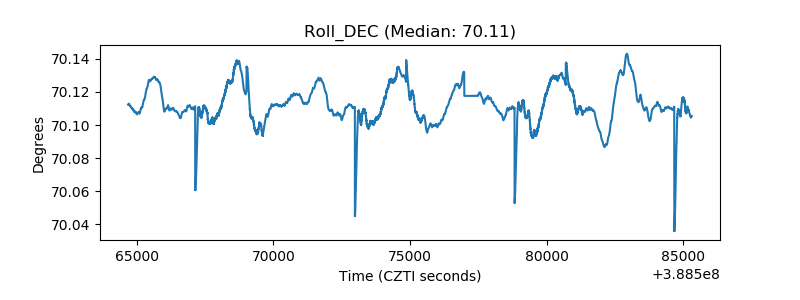 |
| _Roll_RA | 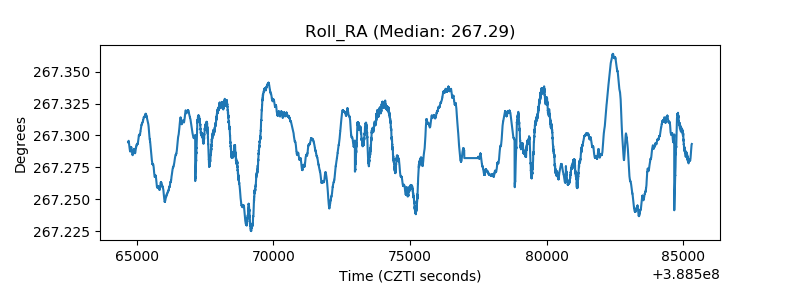 |
| Veto Counter | 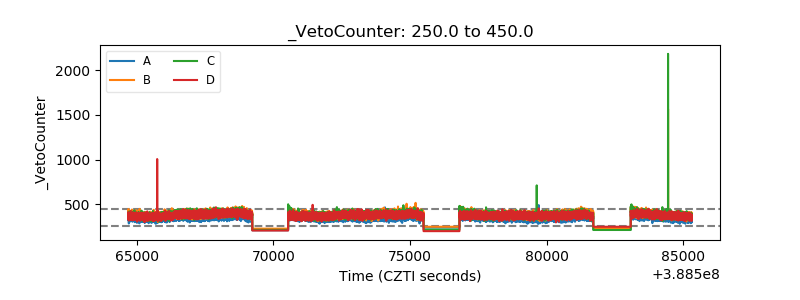 |