| Param | Original file | Final file |
|---|---|---|
| Filename | modeM0/AS1A11_046T08_9000005088_35538cztM0_level2.evt | modeM0/AS1A11_046T08_9000005088_35538cztM0_level2_quad_clean.evt |
| Size (bytes) | 306,434,880 | 49,046,400 |
| Size | 292.2 MB | 46.8 MB |
| Events in quadrant A | 1,588,439 | 308,540 |
| Events in quadrant B | 1,843,542 | 321,222 |
| Events in quadrant C | 1,973,770 | 319,506 |
| Events in quadrant D | 3,648,958 | 301,011 |
| Mode M0 | |||
|---|---|---|---|
| Quadrant | BADHDUFLAG | Total packets | Discarded packets |
| A | 0 | 6783 | 2 |
| B | 0 | 7659 | 1 |
| C | 0 | 7762 | 1 |
| D | 0 | 13038 | 1 |
| Mode SS | |||
|---|---|---|---|
| Quadrant | BADHDUFLAG | Total packets | Discarded packets |
| A | 0 | 68 | 0 |
| B | 0 | 68 | 0 |
| C | 0 | 68 | 0 |
| D | 0 | 68 | 0 |
| Mode M9 | |||
|---|---|---|---|
| Quadrant | BADHDUFLAG | Total packets | Discarded packets |
| A | 0 | 22 | 0 |
| B | 0 | 22 | 0 |
| C | 0 | 22 | 0 |
| D | 0 | 22 | 0 |
| Quadrant | Total seconds | Saturated seconds | Saturation percentage |
|---|---|---|---|
| A | 3304 | 4 | 0.121065% |
| B | 3304 | 86 | 2.602906% |
| C | 3304 | 95 | 2.875303% |
| D | 3304 | 799 | 24.182809% |
Noise dominated data is calculated using 1-second bins in cleaned event files. If a bin has >2000 counts, and if more than 50% of those come from <1% of pixels, then it is considered to be noise-dominated and hence unusable.
| Quadrant | # 1 sec bins | Bins with >0 counts | Bins with >2000 counts | High rate bins dominated by noise | Noise dominated (total time) | Noise dominated (detector-on time) | Marked lightcurve |
|---|---|---|---|---|---|---|---|
| A | 5457 | 3305 | 0 | 0 | 0.00% | 0.00% | 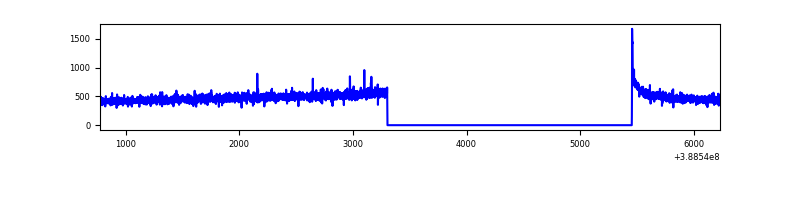 |
| B | 5457 | 3305 | 47 | 47 | 0.86% | 1.42% | 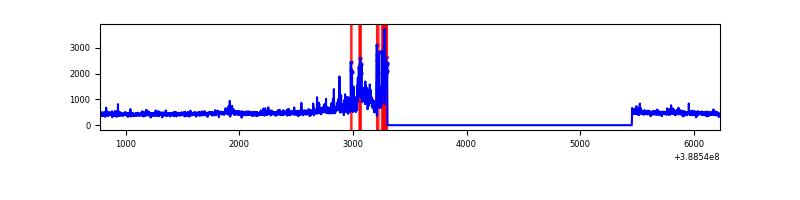 |
| C | 5457 | 3305 | 79 | 79 | 1.45% | 2.39% | 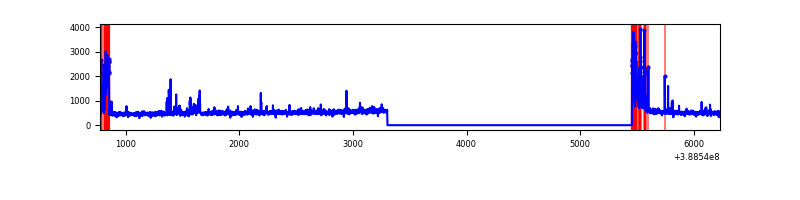 |
| D | 5457 | 3305 | 694 | 694 | 12.72% | 21.00% | 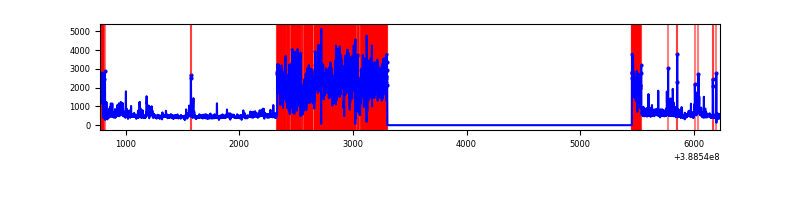 |
Top three noisy pixels from each quadrant. If the there are fewer than three noisy pixels in the level2.evt file, extra rows are filled as -1
| Pixel properties | Quadrant properties | ||||||
|---|---|---|---|---|---|---|---|
| Quadrant | DetID | PixID | Counts | Sigma | Mean | Median | Sigma |
| A | 10 | 83 | 75518 | 958.1 | 386 | 379 | 78.4 |
| A | 8 | 6 | 13816 | 171.34 | 386 | 379 | 78.4 |
| A | 13 | 254 | 4802 | 56.4 | 386 | 379 | 78.4 |
| B | 5 | 172 | 153669 | 2113.37 | 380 | 372 | 72.5 |
| B | 5 | 255 | 124263 | 1707.98 | 380 | 372 | 72.5 |
| B | 0 | 219 | 21516 | 291.49 | 380 | 372 | 72.5 |
| C | 0 | 10 | 184852 | 2165.02 | 371 | 375 | 85.2 |
| C | 0 | 207 | 152473 | 1785.02 | 371 | 375 | 85.2 |
| C | 15 | 214 | 145320 | 1701.07 | 371 | 375 | 85.2 |
| D | 12 | 235 | 2123498 | 26858.2 | 324 | 315 | 79.1 |
| D | 2 | 250 | 63567 | 800.14 | 324 | 315 | 79.1 |
| D | 8 | 195 | 59456 | 748.13 | 324 | 315 | 79.1 |
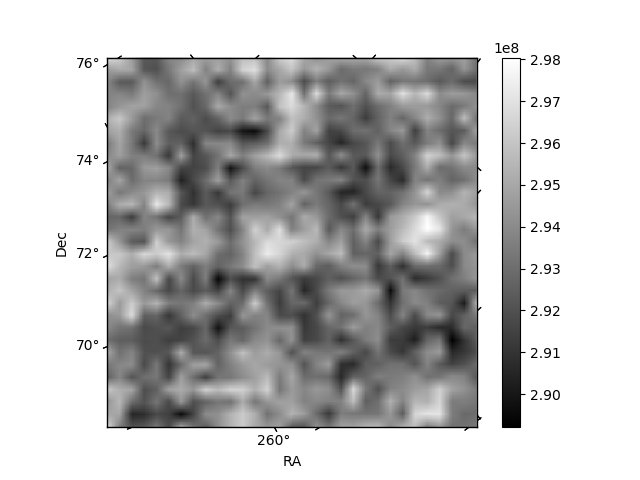
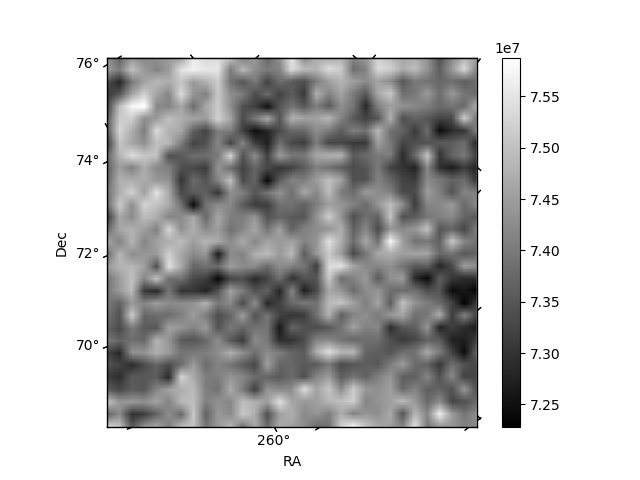
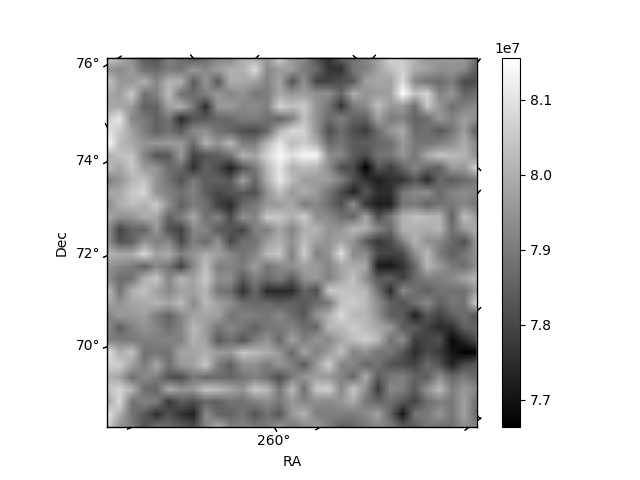
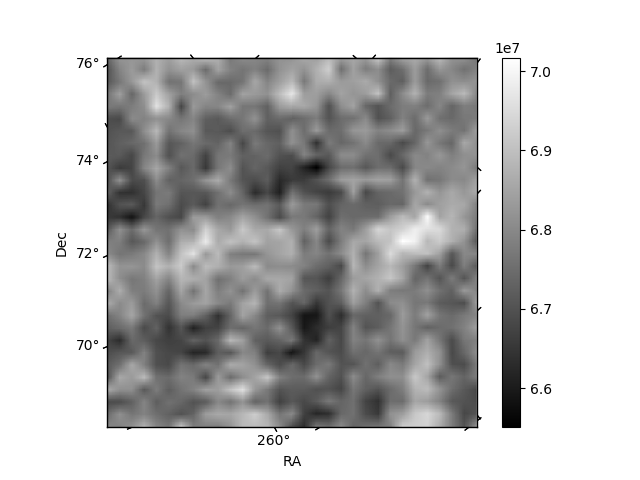
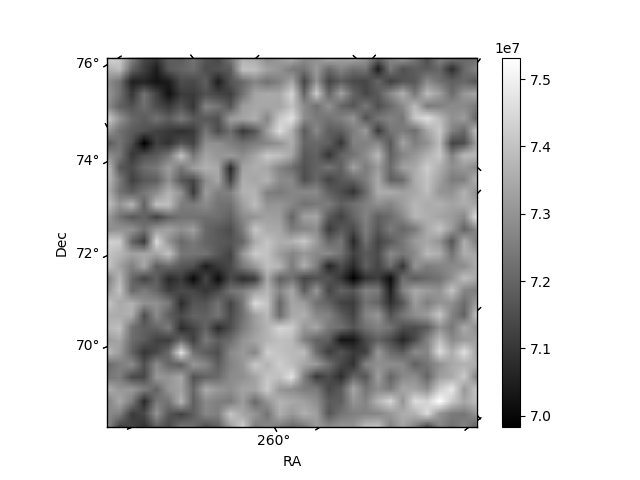
Histogram calculated using DETX and DETY for each event in the final _common_clean file
| Quadrant A | 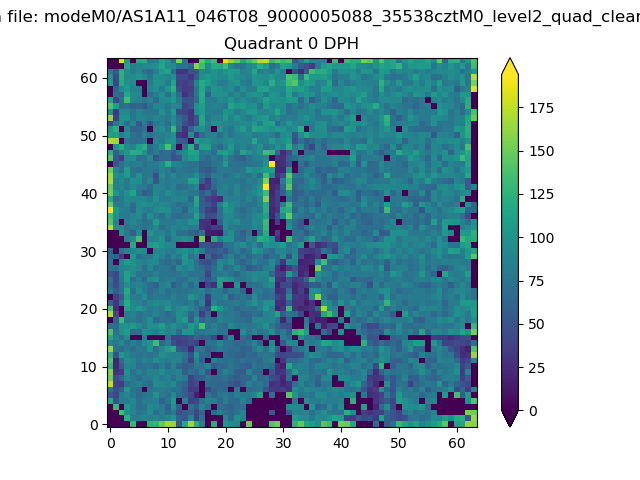 |
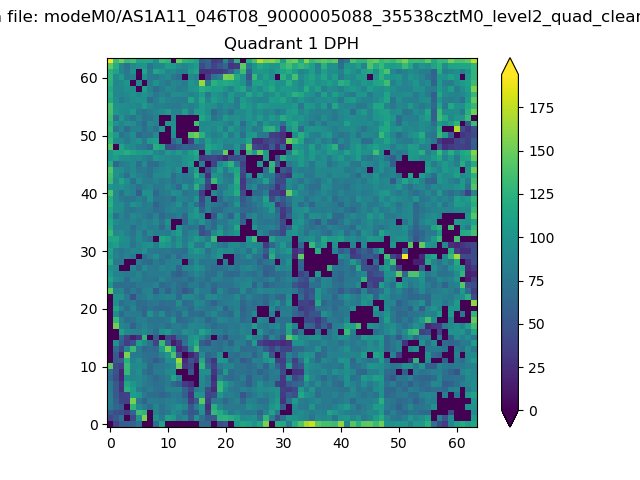 |
Quadrant B |
|---|---|---|---|
| Quadrant D | 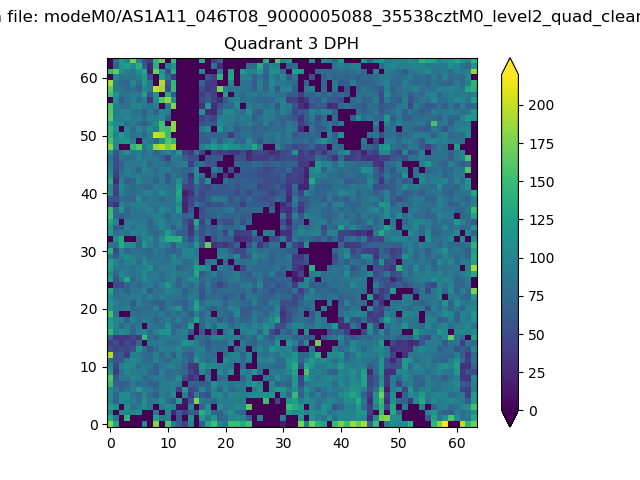 |
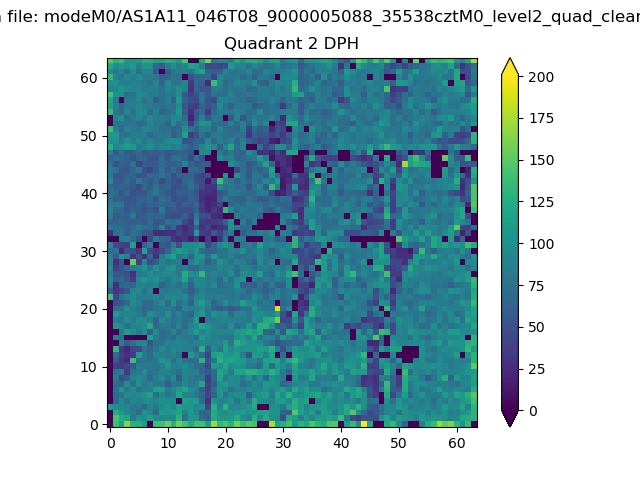 |
Quadrant C |
| Plot type | Count rate plots | Images |
|---|---|---|
| Comparison with Poisson distribution Blue bars denote a histogram of data divided into 1 sec bins. Red curve is a Poisson curve with rate = median count rate of data. |
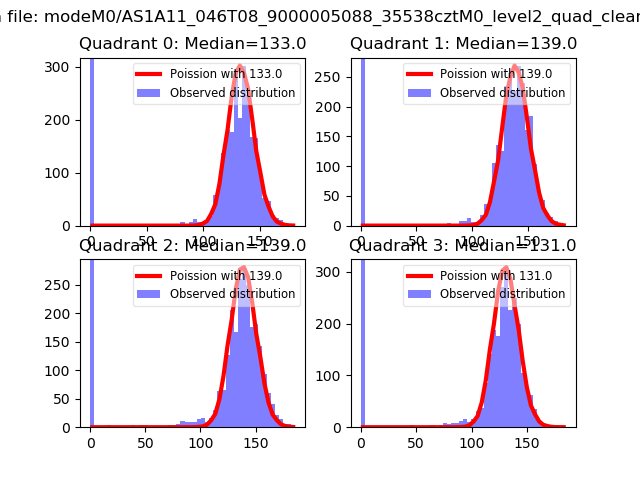 |
 |
| Quadrant-wise count rates Data is divided into 100 sec bins |
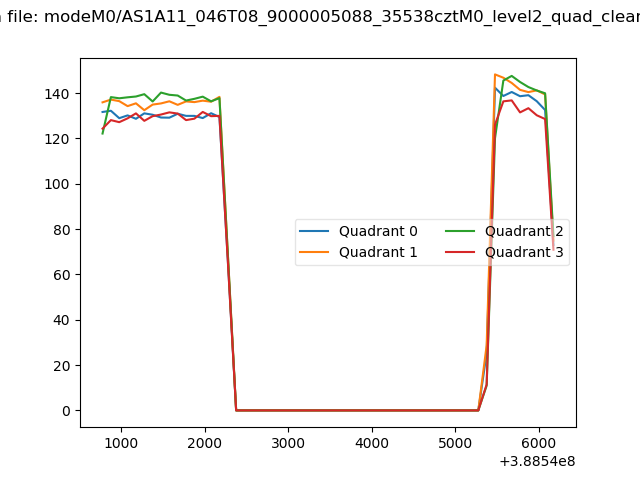 |
|
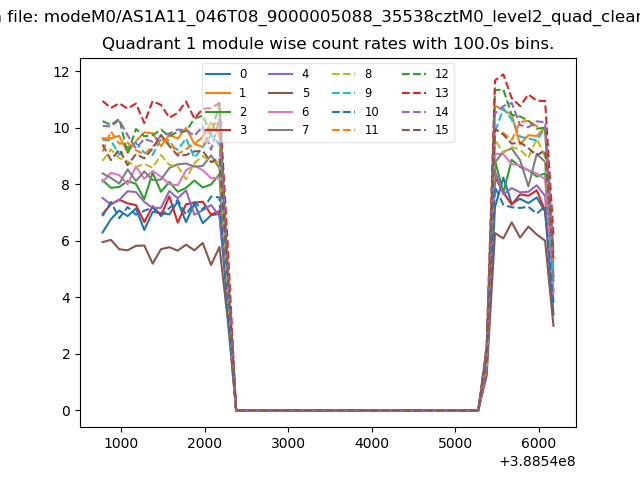
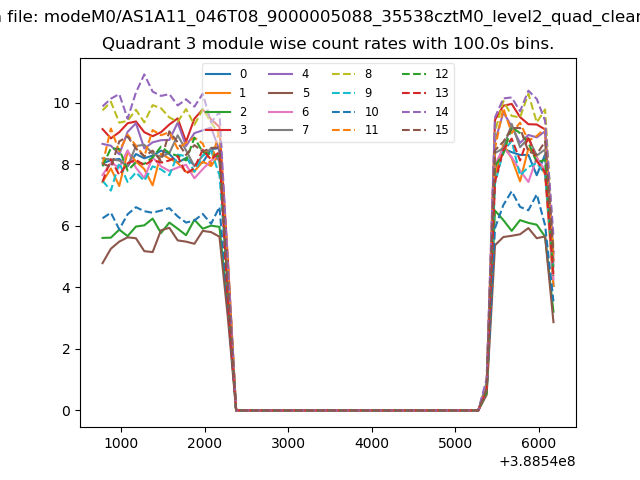
| Module-wise count rates for Quadrant A Data is divided into 100 sec bins |
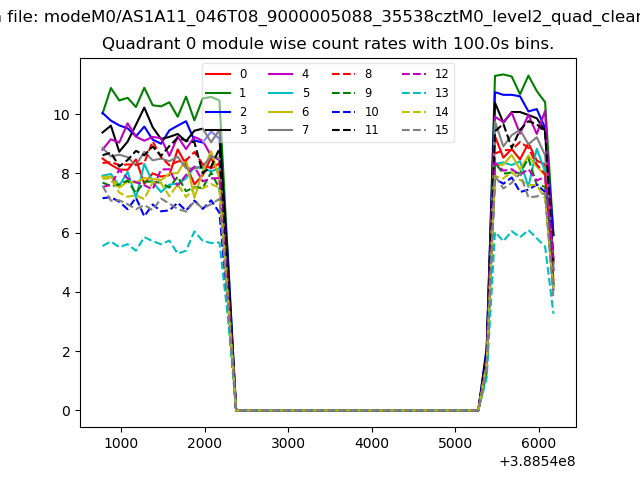 |
 |
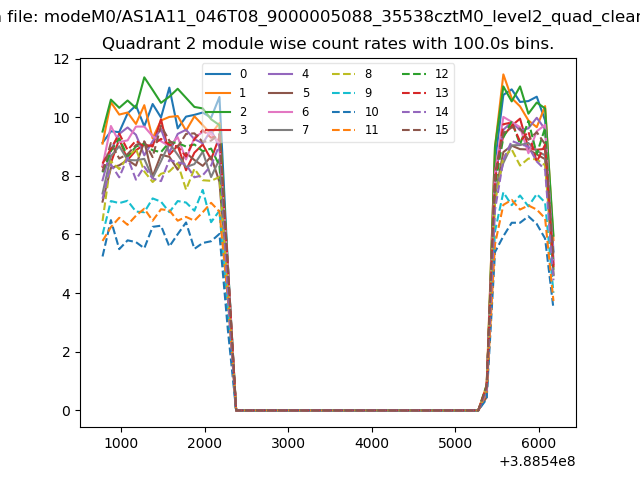
| Module-wise count rates for Quadrant B Data is divided into 100 sec bins |
 |
 |
| Module-wise count rates for Quadrant C Data is divided into 100 sec bins |
 |
 |
| Module-wise count rates for Quadrant D Data is divided into 100 sec bins |
 |
 |
| Parameter | Plot |
|---|---|
| CZT HV Monitor | 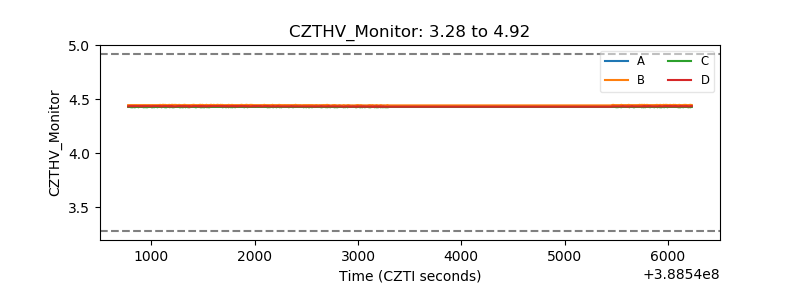 |
| D_VDD | 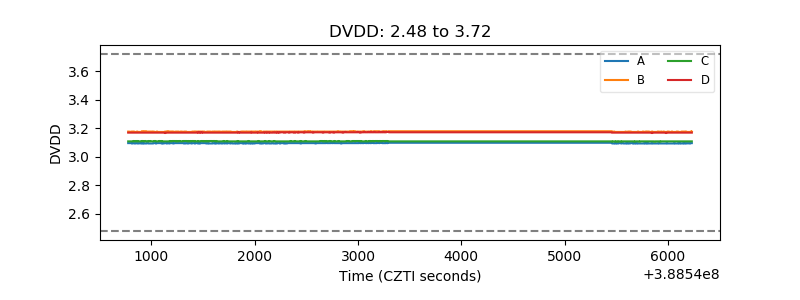 |
| Temperature 1 | 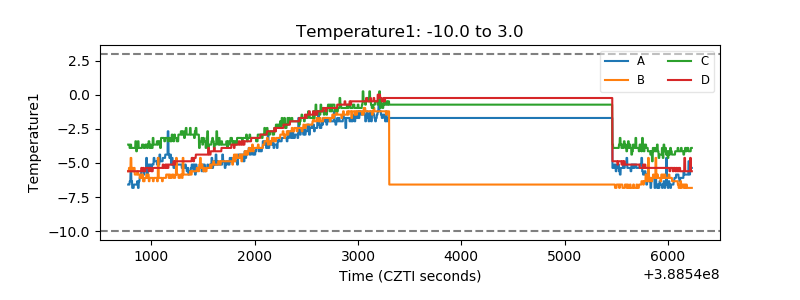 |
| Veto HV Monitor | 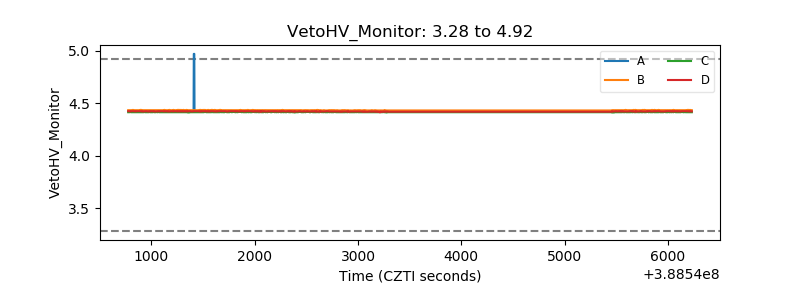 |
| Veto LLD | 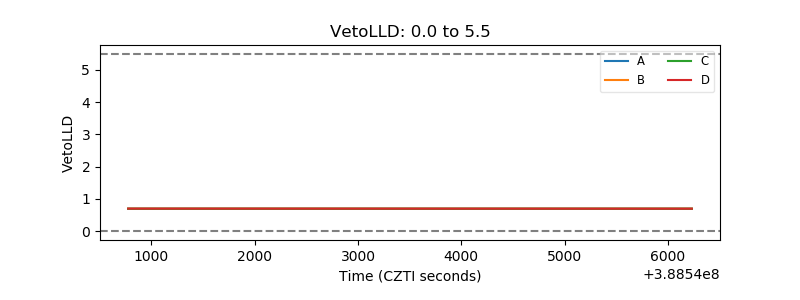 |
| Alpha Counter | 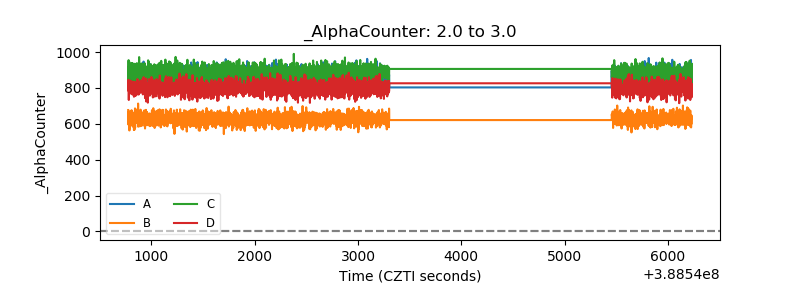 |
| _CPM_Rate | 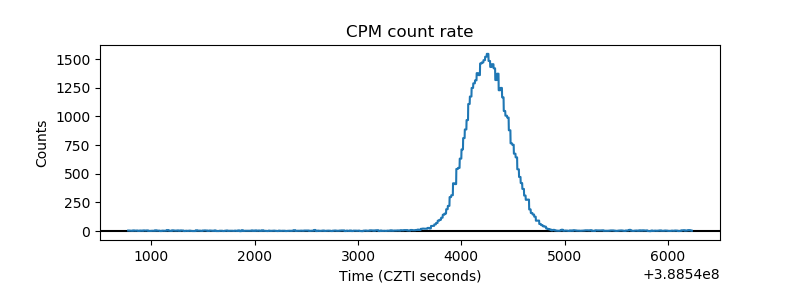 |
| CZT Counter | 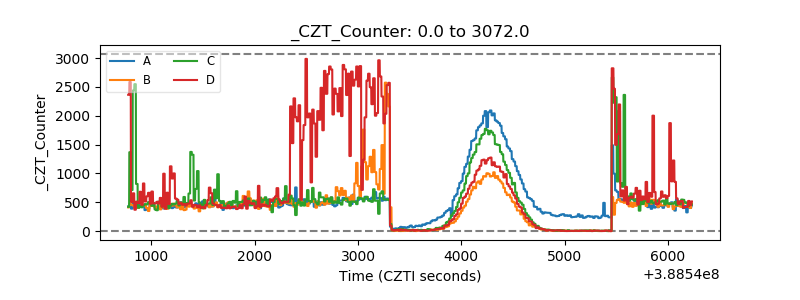 |
| +2.5 Volts monitor | 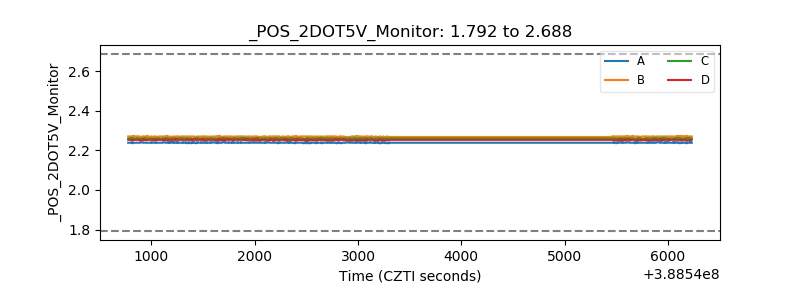 |
| +5 Volts monitor |  |
| _ROLL_ROT | 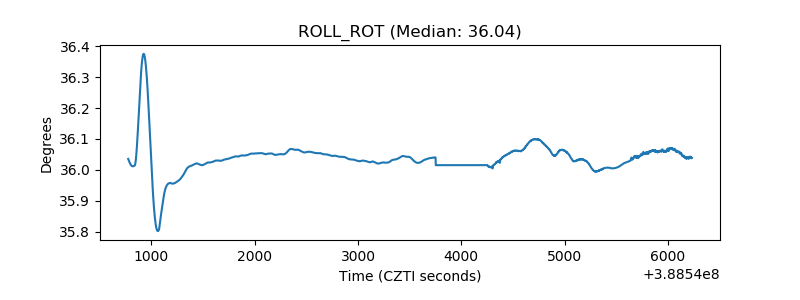 |
| _Roll_DEC | 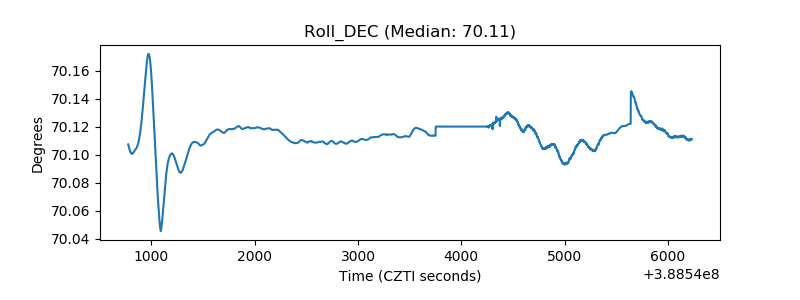 |
| _Roll_RA | 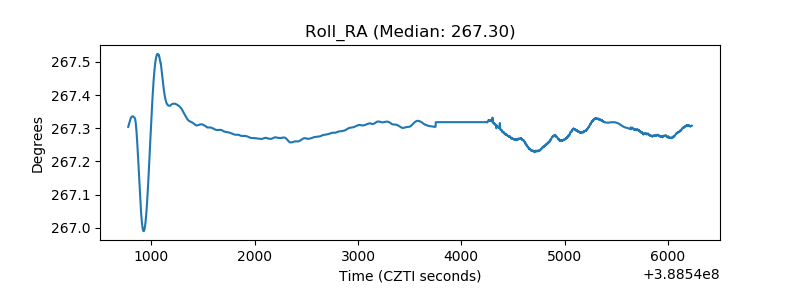 |
| Veto Counter | 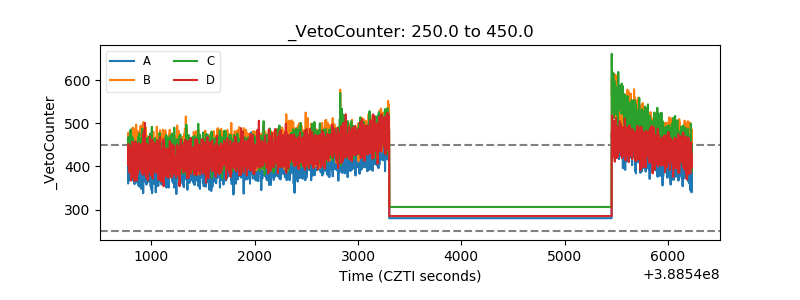 |