| Param | Original file | Final file |
|---|---|---|
| Filename | modeM0/AS1A11_097T09_9000005086_35526cztM0_level2.evt | modeM0/AS1A11_097T09_9000005086_35526cztM0_level2_quad_clean.evt |
| Size (bytes) | 406,290,240 | 51,744,960 |
| Size | 387.5 MB | 49.3 MB |
| Events in quadrant A | 2,755,535 | 307,454 |
| Events in quadrant B | 2,701,536 | 312,108 |
| Events in quadrant C | 3,077,090 | 299,764 |
| Events in quadrant D | 3,407,568 | 273,490 |
| Mode SS | |||
|---|---|---|---|
| Quadrant | BADHDUFLAG | Total packets | Discarded packets |
| A | 0 | 110 | 0 |
| B | 0 | 110 | 0 |
| C | 0 | 110 | 0 |
| D | 0 | 110 | 0 |
| Mode M0 | |||
|---|---|---|---|
| Quadrant | BADHDUFLAG | Total packets | Discarded packets |
| A | 0 | 11524 | 3 |
| B | 0 | 11444 | 2 |
| C | 0 | 12266 | 2 |
| D | 0 | 13789 | 2 |
| Mode M9 | |||
|---|---|---|---|
| Quadrant | BADHDUFLAG | Total packets | Discarded packets |
| A | 0 | 26 | 0 |
| B | 0 | 26 | 0 |
| C | 0 | 26 | 0 |
| D | 0 | 27 | 0 |
| Quadrant | Total seconds | Saturated seconds | Saturation percentage |
|---|---|---|---|
| A | 5329 | 7 | 0.131357% |
| B | 5329 | 39 | 0.731845% |
| C | 5329 | 122 | 2.289360% |
| D | 5329 | 295 | 5.535748% |
Noise dominated data is calculated using 1-second bins in cleaned event files. If a bin has >2000 counts, and if more than 50% of those come from <1% of pixels, then it is considered to be noise-dominated and hence unusable.
| Quadrant | # 1 sec bins | Bins with >0 counts | Bins with >2000 counts | High rate bins dominated by noise | Noise dominated (total time) | Noise dominated (detector-on time) | Marked lightcurve |
|---|---|---|---|---|---|---|---|
| A | 6973 | 5330 | 0 | 0 | 0.00% | 0.00% | 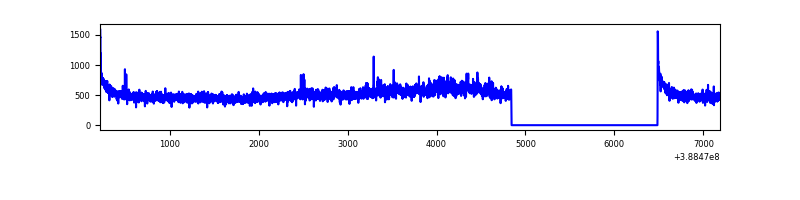 |
| B | 6973 | 5330 | 17 | 17 | 0.24% | 0.32% | 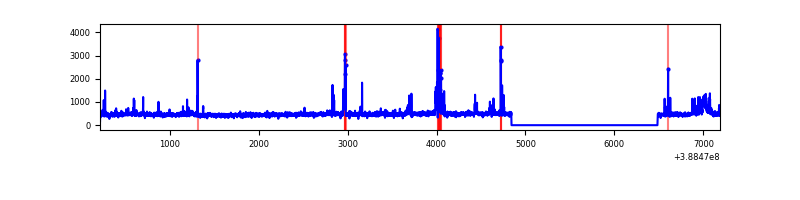 |
| C | 6973 | 5330 | 95 | 95 | 1.36% | 1.78% | 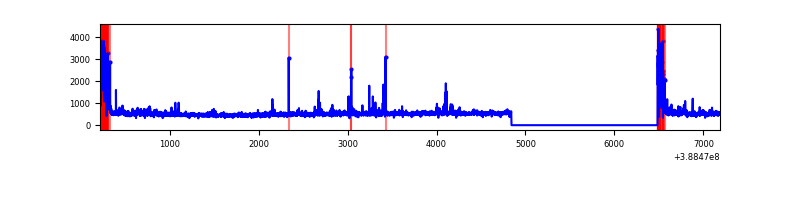 |
| D | 6973 | 5330 | 222 | 222 | 3.18% | 4.17% | 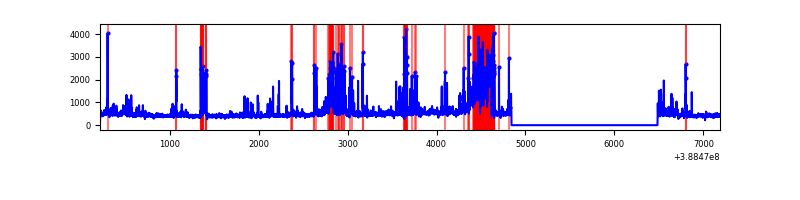 |
Top three noisy pixels from each quadrant. If the there are fewer than three noisy pixels in the level2.evt file, extra rows are filled as -1
| Pixel properties | Quadrant properties | ||||||
|---|---|---|---|---|---|---|---|
| Quadrant | DetID | PixID | Counts | Sigma | Mean | Median | Sigma |
| A | 15 | 169 | 200653 | 1611.0 | 619 | 608 | 124.2 |
| A | 10 | 83 | 134322 | 1076.82 | 619 | 608 | 124.2 |
| A | 8 | 6 | 17176 | 133.42 | 619 | 608 | 124.2 |
| B | 5 | 172 | 147861 | 1230.5 | 614 | 598 | 119.7 |
| B | 5 | 236 | 94744 | 786.67 | 614 | 598 | 119.7 |
| B | 5 | 255 | 24463 | 199.41 | 614 | 598 | 119.7 |
| C | 0 | 10 | 341676 | 2442.16 | 596 | 600 | 139.7 |
| C | 15 | 214 | 220693 | 1575.9 | 596 | 600 | 139.7 |
| C | 0 | 207 | 75324 | 535.04 | 596 | 600 | 139.7 |
| D | 10 | 199 | 562640 | 3888.77 | 586 | 568 | 144.5 |
| D | 2 | 250 | 354694 | 2450.07 | 586 | 568 | 144.5 |
| D | 8 | 195 | 86512 | 594.62 | 586 | 568 | 144.5 |
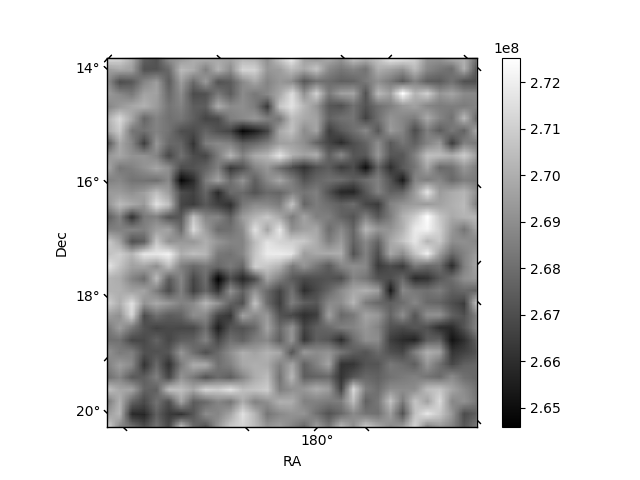
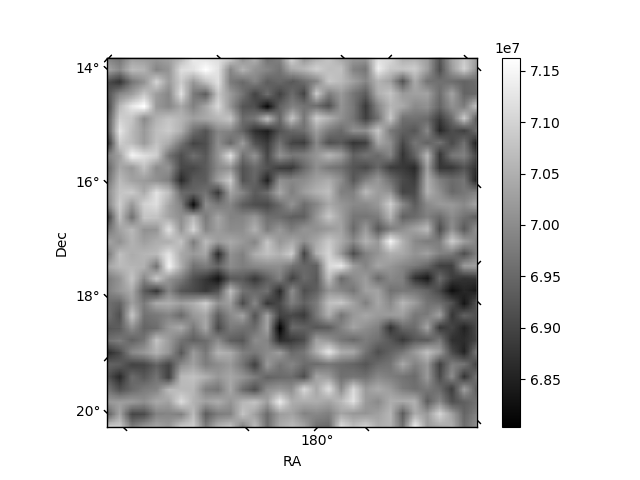
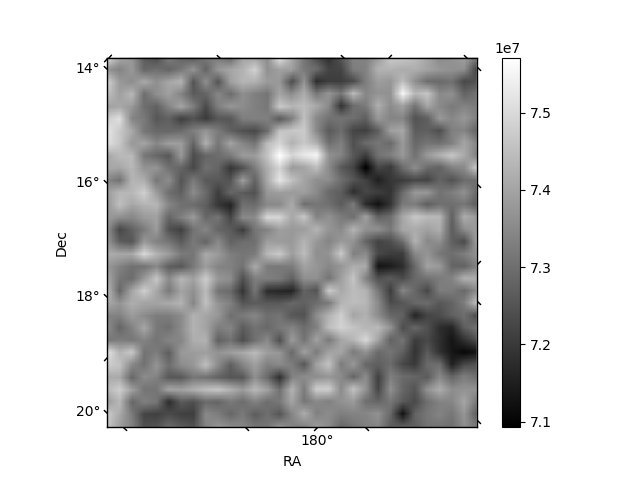
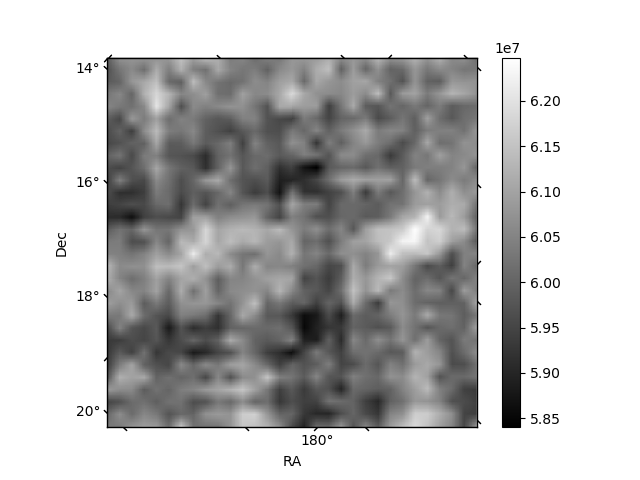
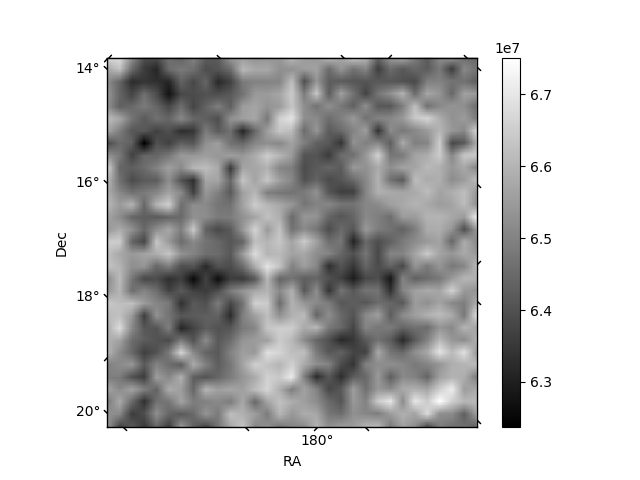
Histogram calculated using DETX and DETY for each event in the final _common_clean file
| Quadrant A | 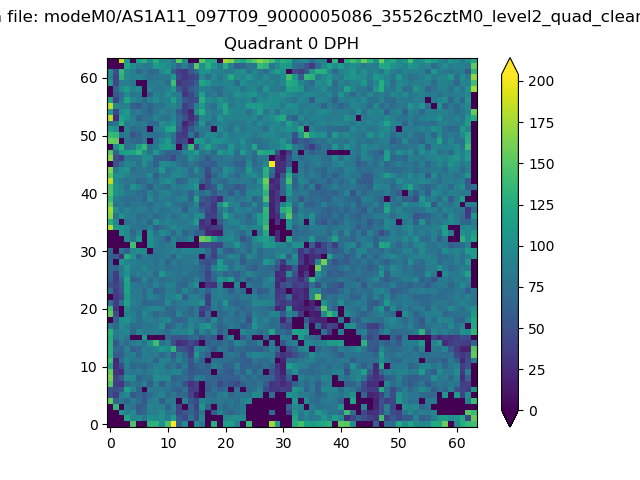 |
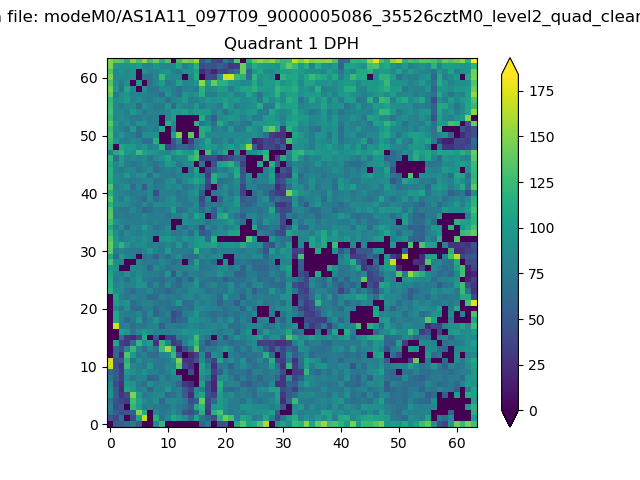 |
Quadrant B |
|---|---|---|---|
| Quadrant D | 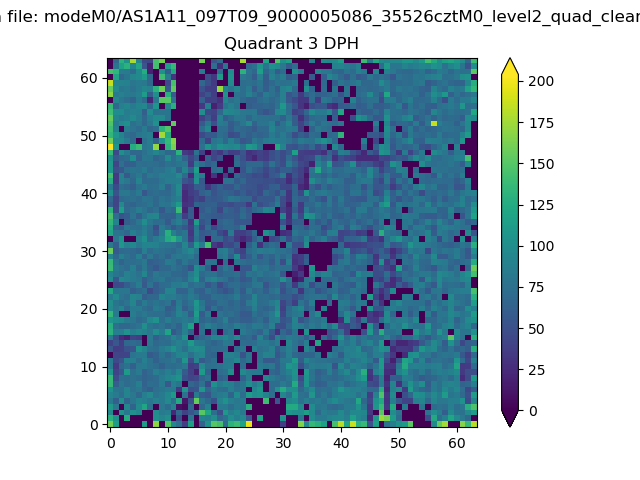 |
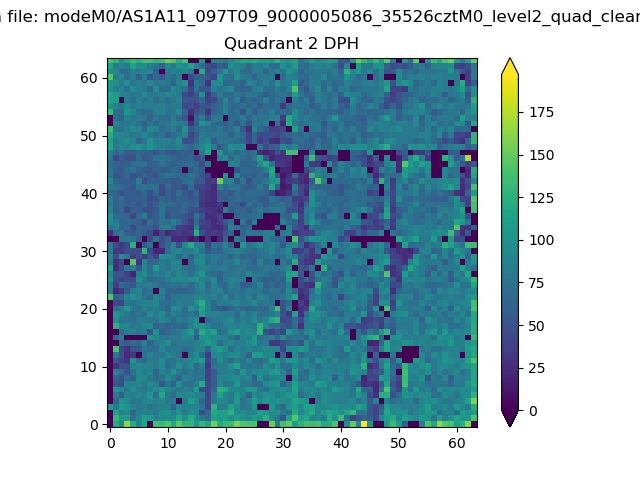 |
Quadrant C |
| Plot type | Count rate plots | Images |
|---|---|---|
| Comparison with Poisson distribution Blue bars denote a histogram of data divided into 1 sec bins. Red curve is a Poisson curve with rate = median count rate of data. |
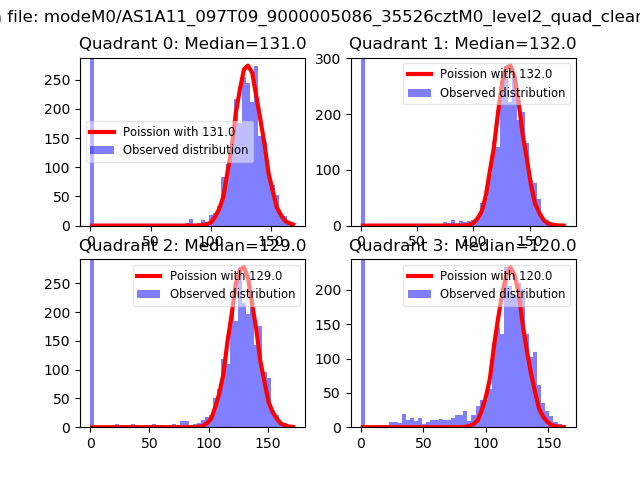 |
 |
| Quadrant-wise count rates Data is divided into 100 sec bins |
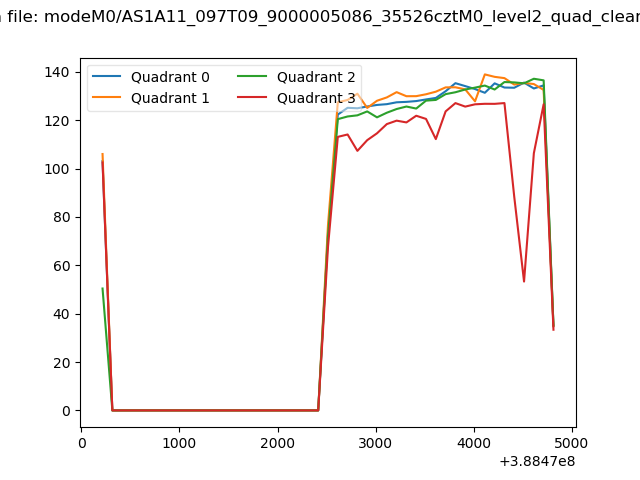 |
|
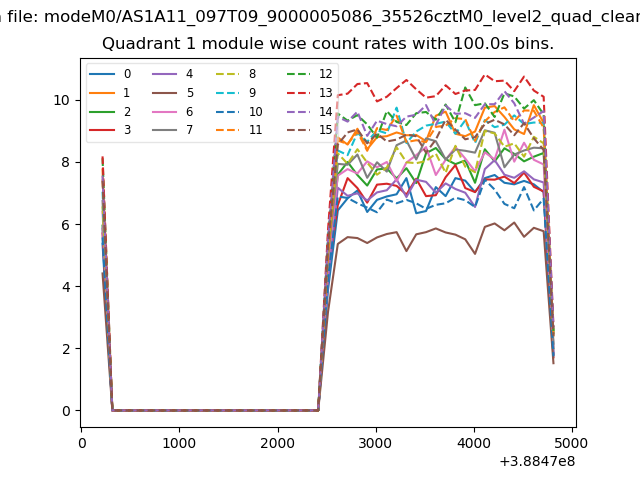
| Module-wise count rates for Quadrant A Data is divided into 100 sec bins |
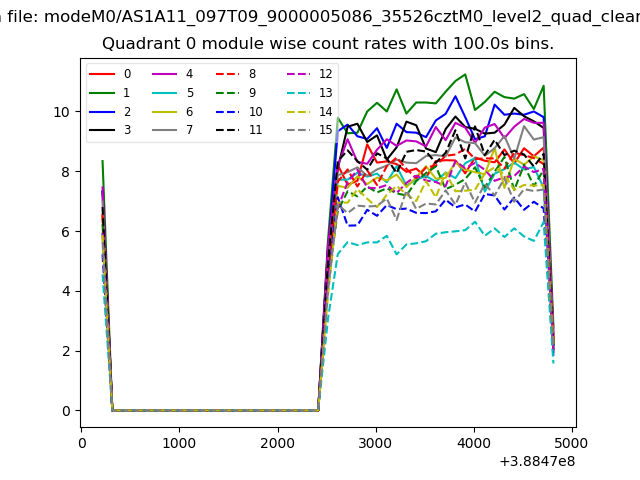 |
 |
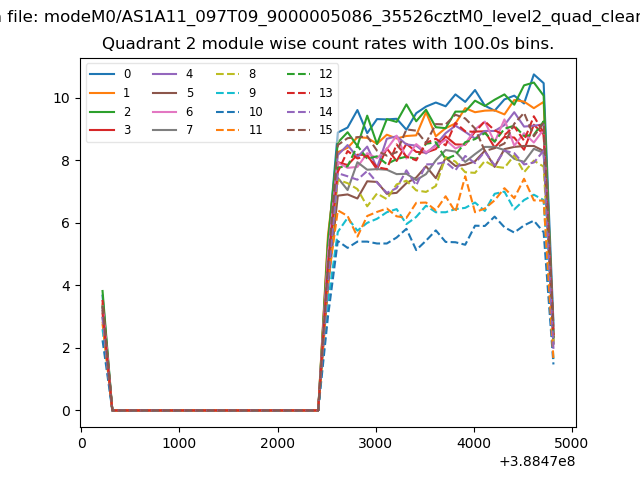
| Module-wise count rates for Quadrant B Data is divided into 100 sec bins |
 |
 |
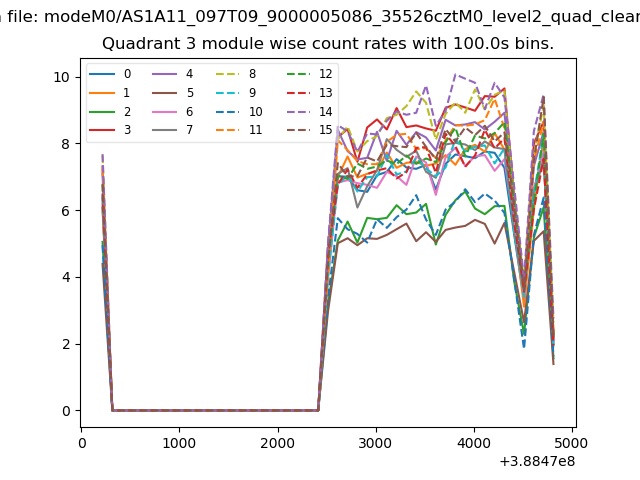
| Module-wise count rates for Quadrant C Data is divided into 100 sec bins |
 |
 |
| Module-wise count rates for Quadrant D Data is divided into 100 sec bins |
 |
 |
| Parameter | Plot |
|---|---|
| CZT HV Monitor | 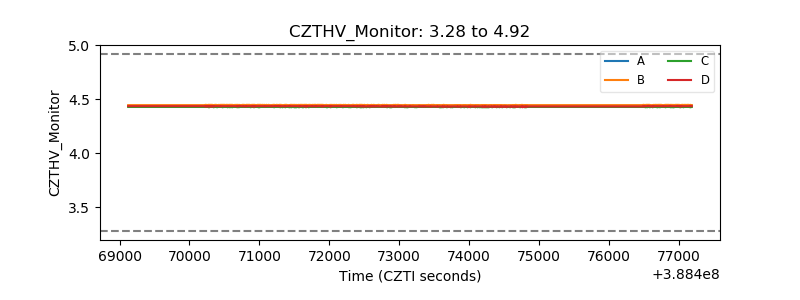 |
| D_VDD | 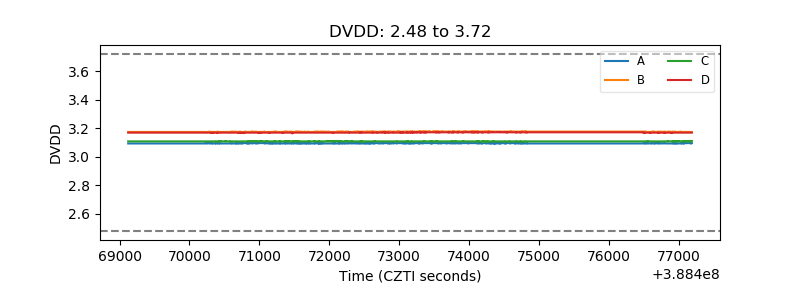 |
| Temperature 1 | 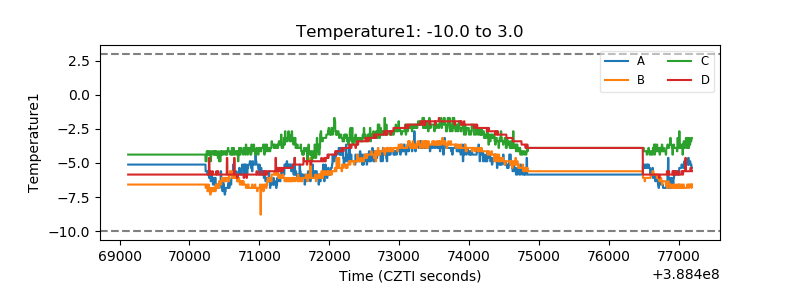 |
| Veto HV Monitor | 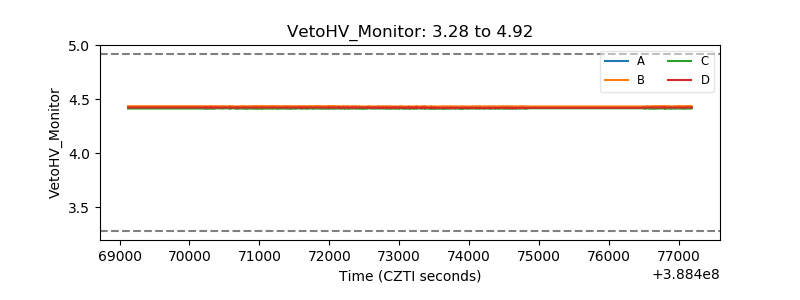 |
| Veto LLD | 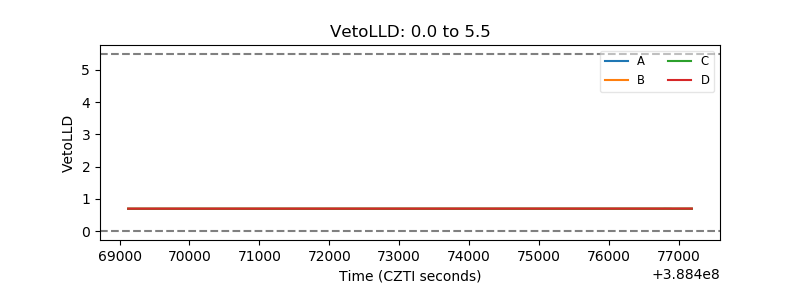 |
| Alpha Counter | 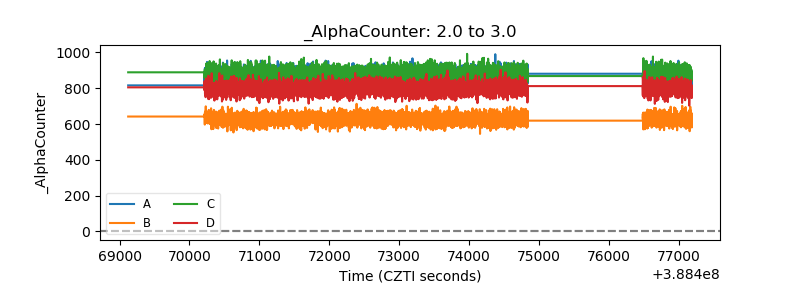 |
| _CPM_Rate | 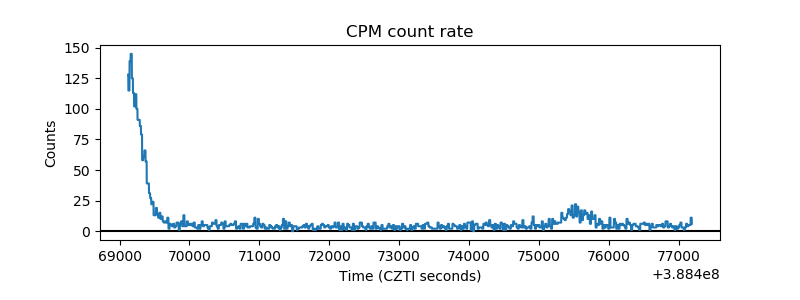 |
| CZT Counter | 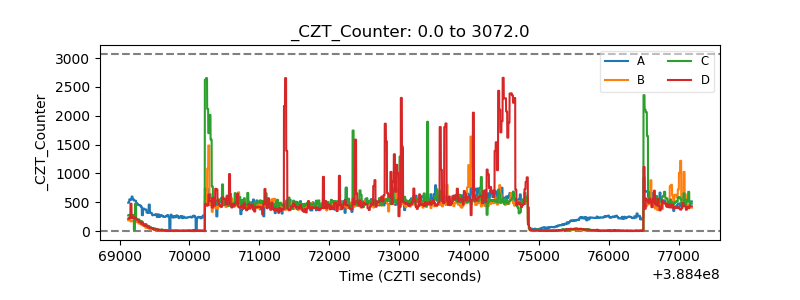 |
| +2.5 Volts monitor | 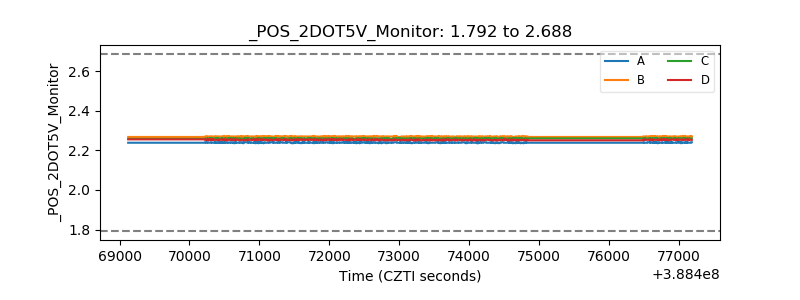 |
| +5 Volts monitor | 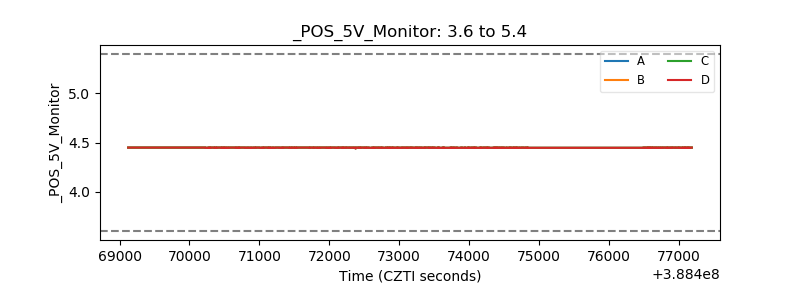 |
| _ROLL_ROT | 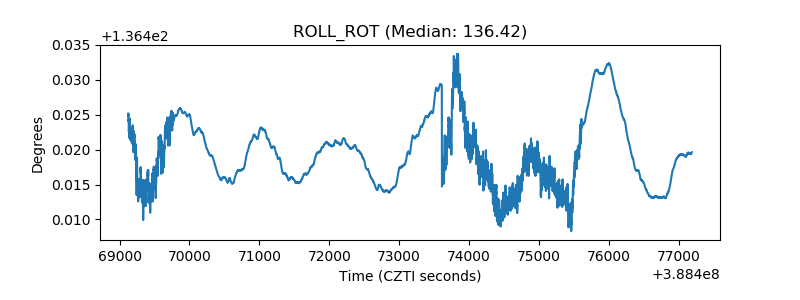 |
| _Roll_DEC | 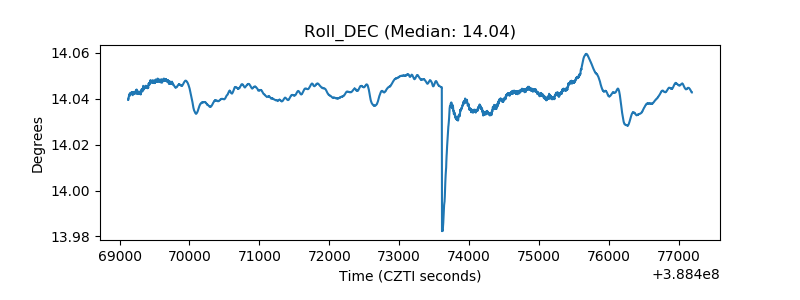 |
| _Roll_RA | 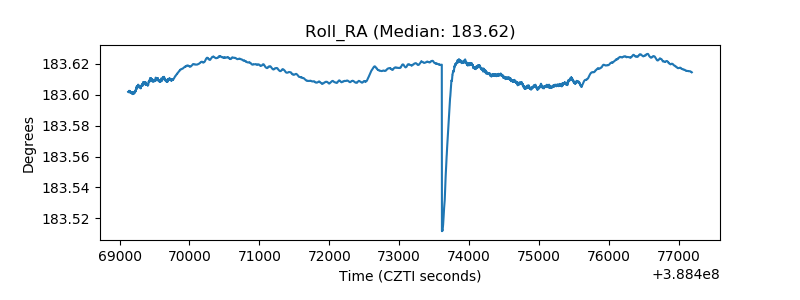 |
| Veto Counter | 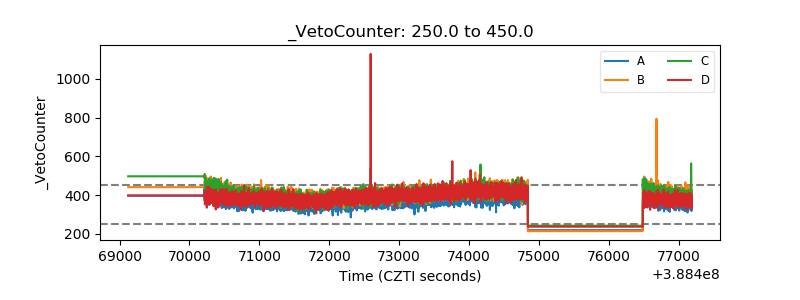 |