| Param | Original file | Final file |
|---|---|---|
| Filename | modeM0/AS1A11_097T09_9000005086_35522cztM0_level2.evt | modeM0/AS1A11_097T09_9000005086_35522cztM0_level2_quad_clean.evt |
| Size (bytes) | 392,158,080 | 62,389,440 |
| Size | 374.0 MB | 59.5 MB |
| Events in quadrant A | 2,562,422 | 393,055 |
| Events in quadrant B | 2,620,286 | 405,394 |
| Events in quadrant C | 3,876,741 | 375,559 |
| Events in quadrant D | 2,486,164 | 373,322 |
| Mode SS | |||
|---|---|---|---|
| Quadrant | BADHDUFLAG | Total packets | Discarded packets |
| A | 0 | 98 | 0 |
| B | 0 | 98 | 0 |
| C | 0 | 98 | 0 |
| D | 0 | 98 | 0 |
| Mode M0 | |||
|---|---|---|---|
| Quadrant | BADHDUFLAG | Total packets | Discarded packets |
| A | 0 | 10512 | 3 |
| B | 0 | 10665 | 2 |
| C | 0 | 14782 | 2 |
| D | 0 | 10517 | 2 |
| Mode M9 | |||
|---|---|---|---|
| Quadrant | BADHDUFLAG | Total packets | Discarded packets |
| A | 0 | 33 | 0 |
| B | 0 | 33 | 0 |
| C | 0 | 33 | 0 |
| D | 0 | 34 | 0 |
| Quadrant | Total seconds | Saturated seconds | Saturation percentage |
|---|---|---|---|
| A | 4872 | 15 | 0.307882% |
| B | 4872 | 22 | 0.451560% |
| C | 4872 | 172 | 3.530378% |
| D | 4872 | 23 | 0.472085% |
Noise dominated data is calculated using 1-second bins in cleaned event files. If a bin has >2000 counts, and if more than 50% of those come from <1% of pixels, then it is considered to be noise-dominated and hence unusable.
| Quadrant | # 1 sec bins | Bins with >0 counts | Bins with >2000 counts | High rate bins dominated by noise | Noise dominated (total time) | Noise dominated (detector-on time) | Marked lightcurve |
|---|---|---|---|---|---|---|---|
| A | 6965 | 4873 | 9 | 9 | 0.13% | 0.18% | 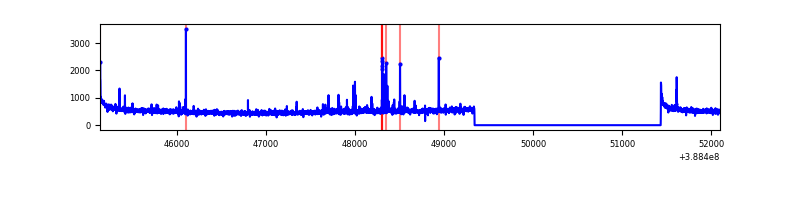 |
| B | 6965 | 4873 | 11 | 11 | 0.16% | 0.23% | 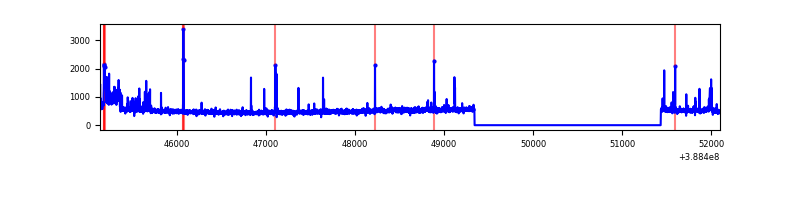 |
| C | 6965 | 4873 | 172 | 172 | 2.47% | 3.53% | 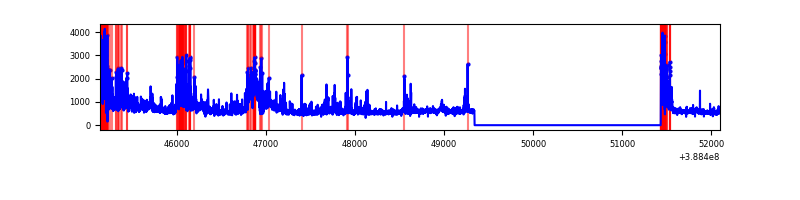 |
| D | 6965 | 4873 | 12 | 12 | 0.17% | 0.25% | 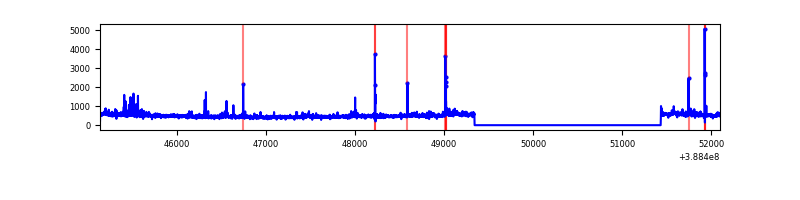 |
Top three noisy pixels from each quadrant. If the there are fewer than three noisy pixels in the level2.evt file, extra rows are filled as -1
| Pixel properties | Quadrant properties | ||||||
|---|---|---|---|---|---|---|---|
| Quadrant | DetID | PixID | Counts | Sigma | Mean | Median | Sigma |
| A | 10 | 83 | 127279 | 1049.1 | 602 | 593 | 120.8 |
| A | 9 | 143 | 59706 | 489.52 | 602 | 593 | 120.8 |
| A | 15 | 169 | 25711 | 208.0 | 602 | 593 | 120.8 |
| B | 5 | 200 | 159937 | 1395.36 | 605 | 591 | 114.2 |
| B | 5 | 172 | 33996 | 292.52 | 605 | 591 | 114.2 |
| B | 5 | 236 | 19655 | 166.94 | 605 | 591 | 114.2 |
| C | 0 | 239 | 738522 | 5565.27 | 578 | 583 | 132.6 |
| C | 0 | 10 | 523476 | 3943.47 | 578 | 583 | 132.6 |
| C | 15 | 214 | 202909 | 1525.87 | 578 | 583 | 132.6 |
| D | 8 | 195 | 105665 | 750.89 | 578 | 563 | 140.0 |
| D | 13 | 249 | 77599 | 550.38 | 578 | 563 | 140.0 |
| D | 2 | 250 | 24611 | 171.81 | 578 | 563 | 140.0 |
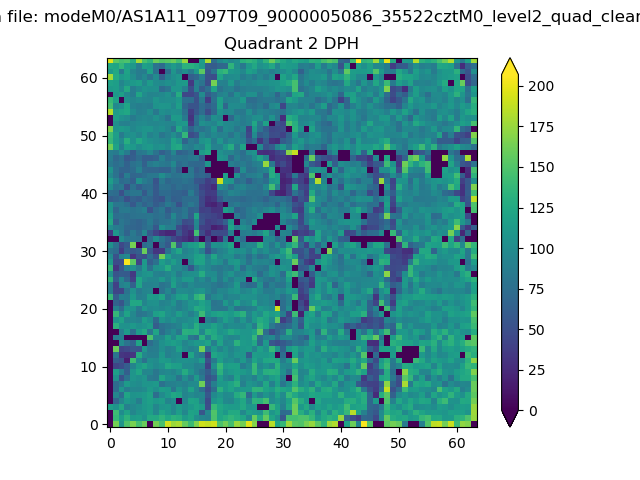
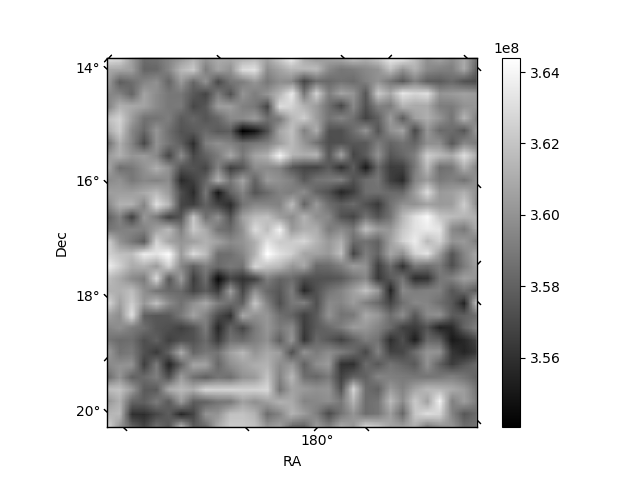
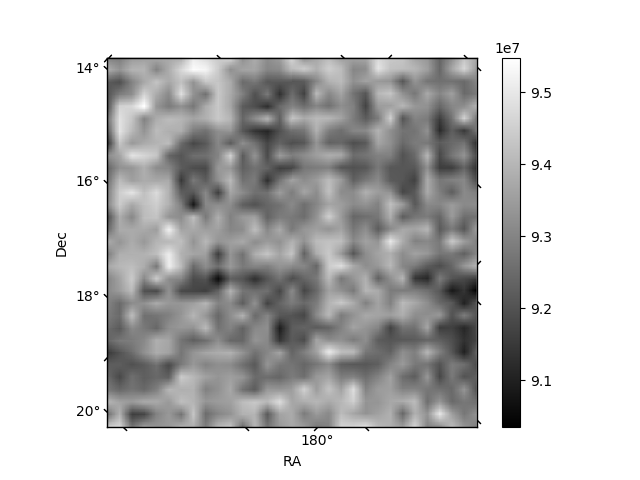
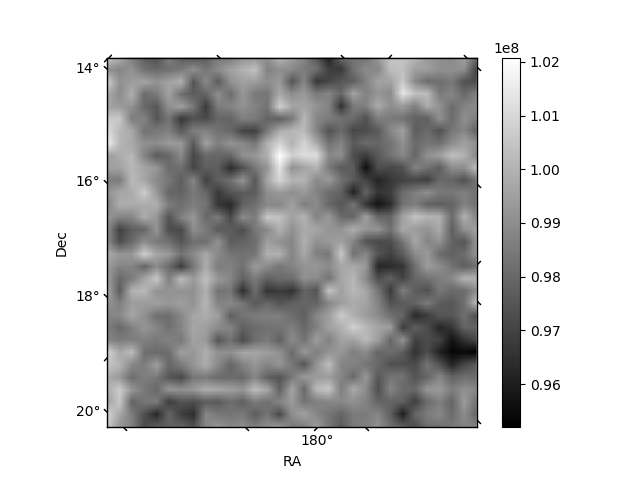
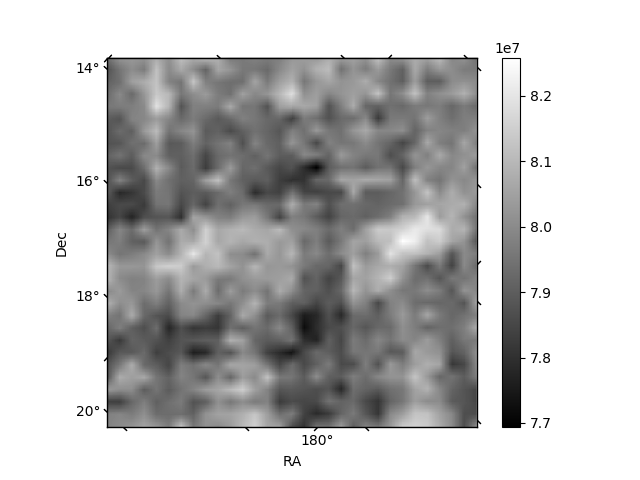
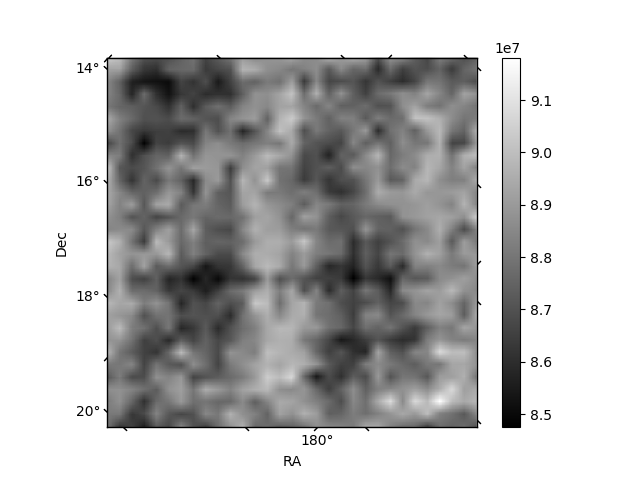
Histogram calculated using DETX and DETY for each event in the final _common_clean file
| Quadrant A | 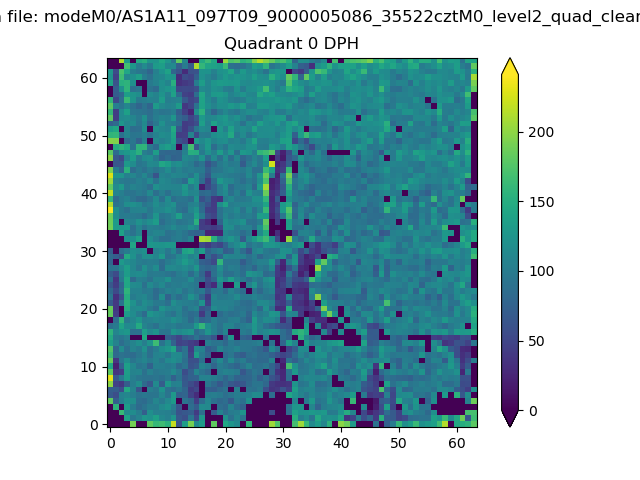 |
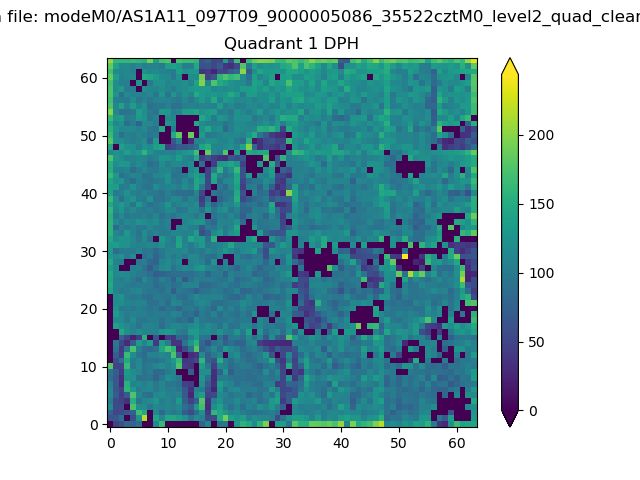 |
Quadrant B |
|---|---|---|---|
| Quadrant D | 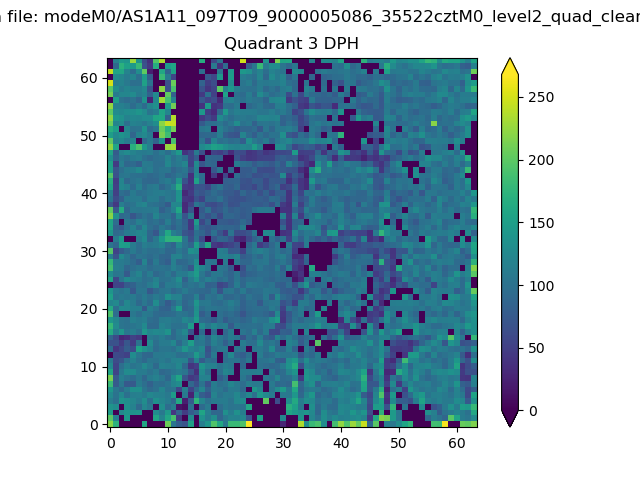 |
 |
Quadrant C |
| Plot type | Count rate plots | Images |
|---|---|---|
| Comparison with Poisson distribution Blue bars denote a histogram of data divided into 1 sec bins. Red curve is a Poisson curve with rate = median count rate of data. |
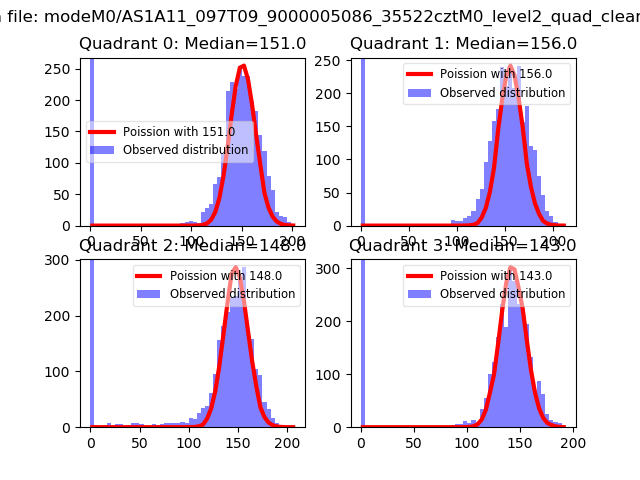 |
 |
| Quadrant-wise count rates Data is divided into 100 sec bins |
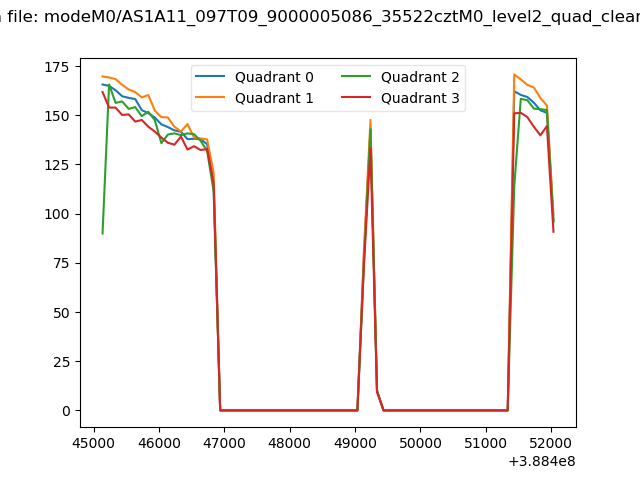 |
|
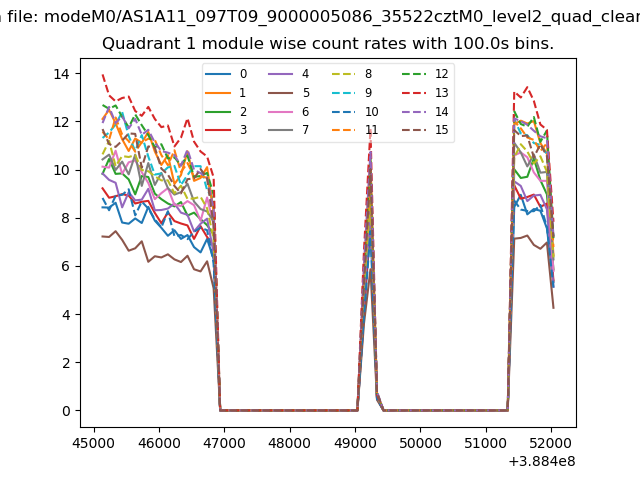
| Module-wise count rates for Quadrant A Data is divided into 100 sec bins |
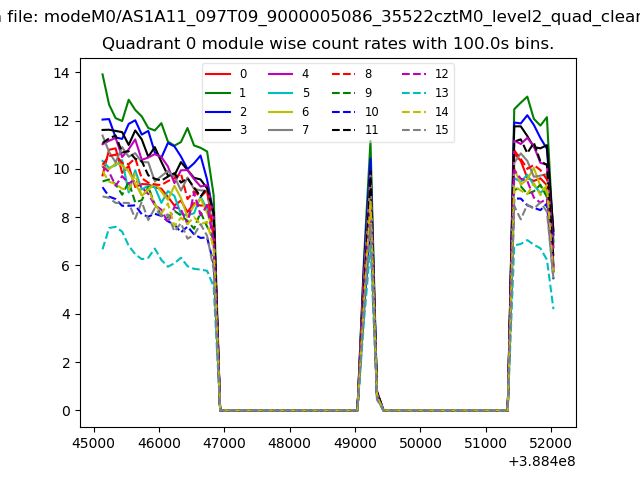 |
 |
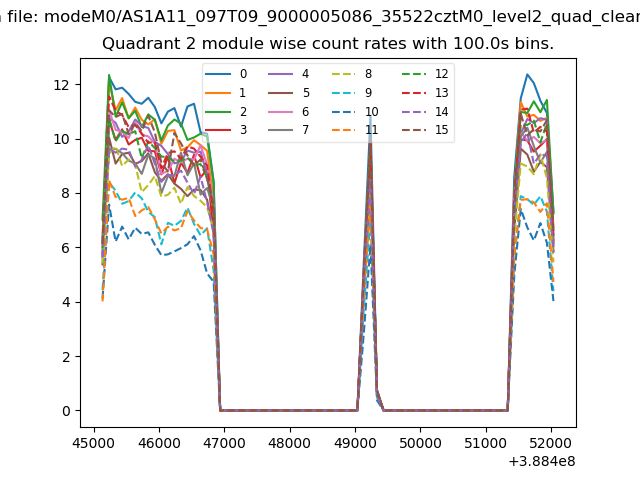
| Module-wise count rates for Quadrant B Data is divided into 100 sec bins |
 |
 |
| Module-wise count rates for Quadrant C Data is divided into 100 sec bins |
 |
 |
| Module-wise count rates for Quadrant D Data is divided into 100 sec bins |
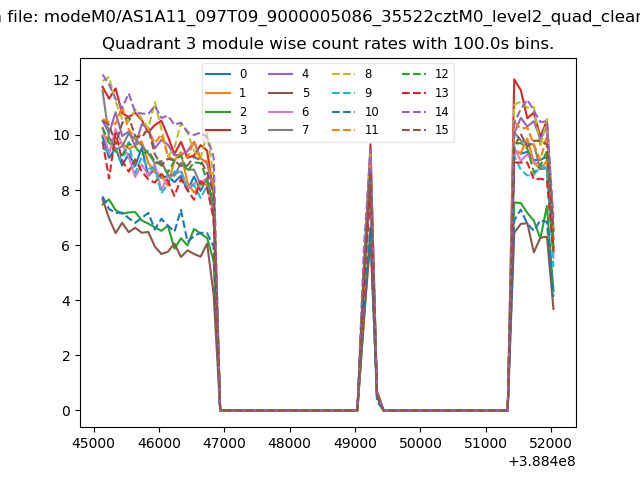 |
 |
| Parameter | Plot |
|---|---|
| CZT HV Monitor | 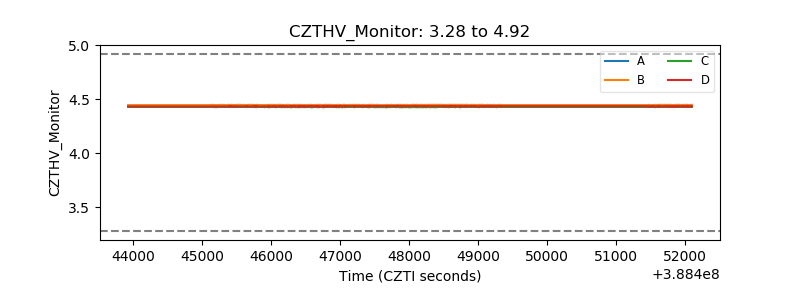 |
| D_VDD | 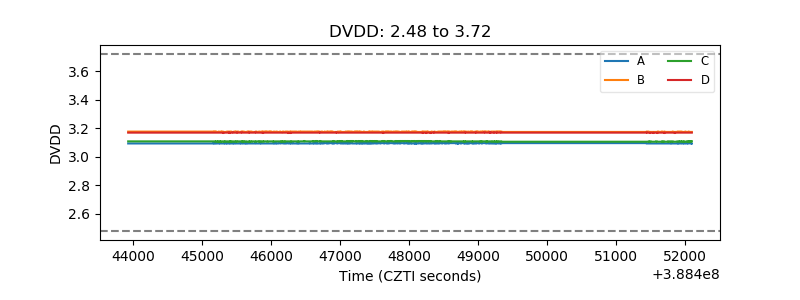 |
| Temperature 1 | 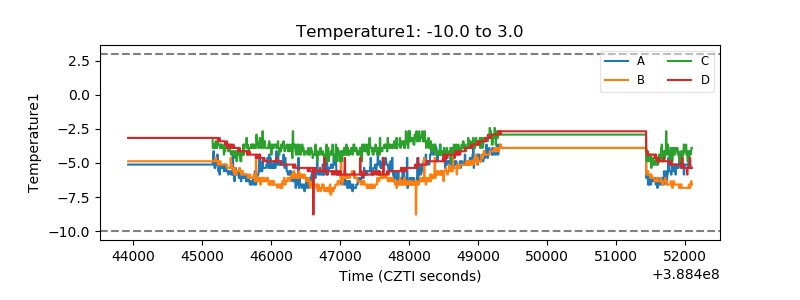 |
| Veto HV Monitor | 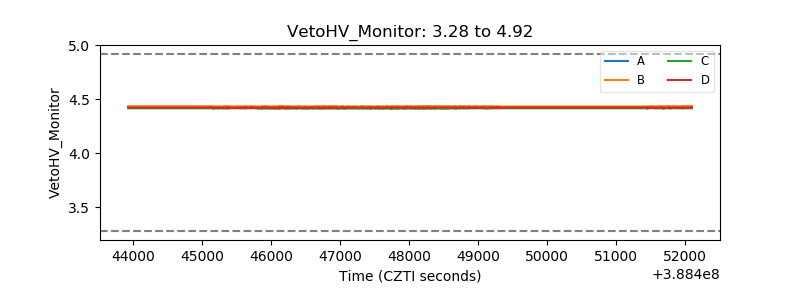 |
| Veto LLD | 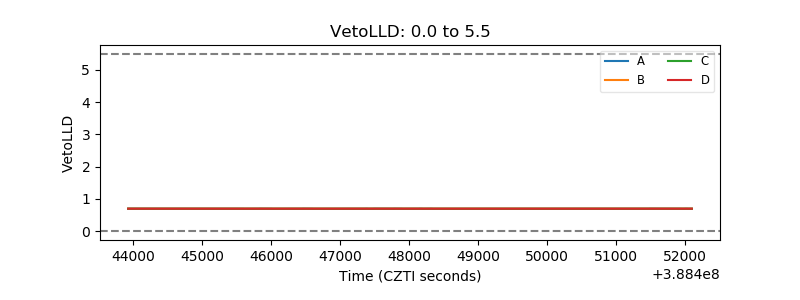 |
| Alpha Counter | 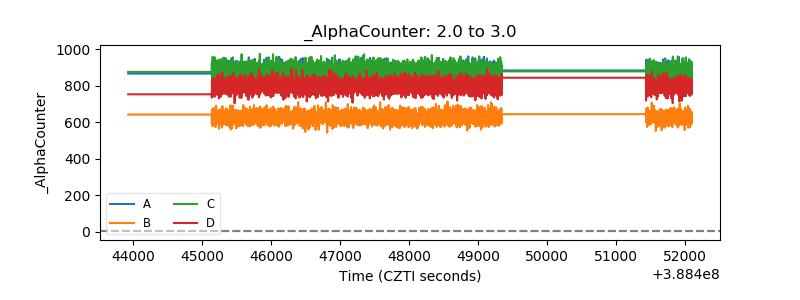 |
| _CPM_Rate | 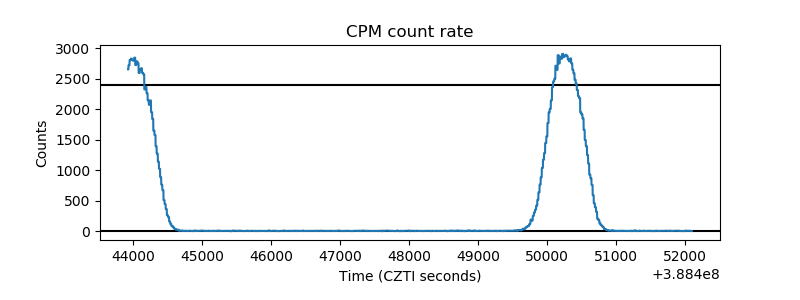 |
| CZT Counter | 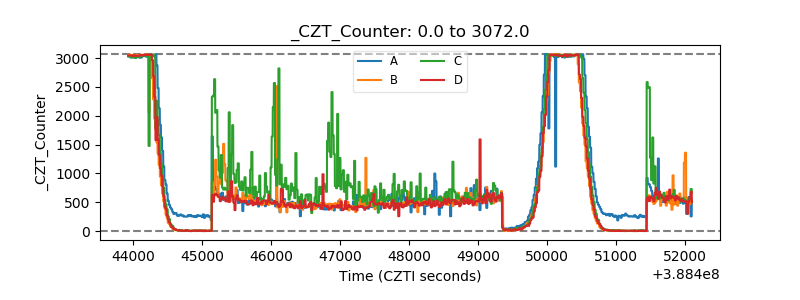 |
| +2.5 Volts monitor | 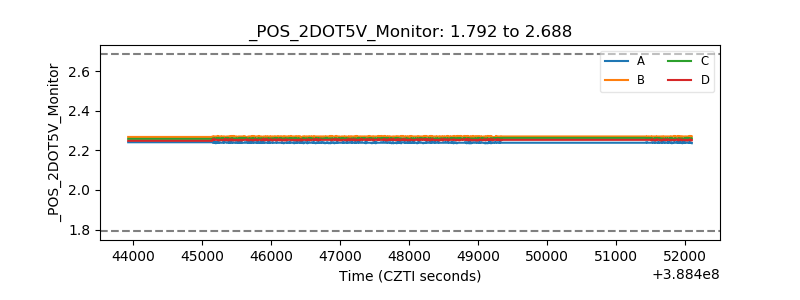 |
| +5 Volts monitor | 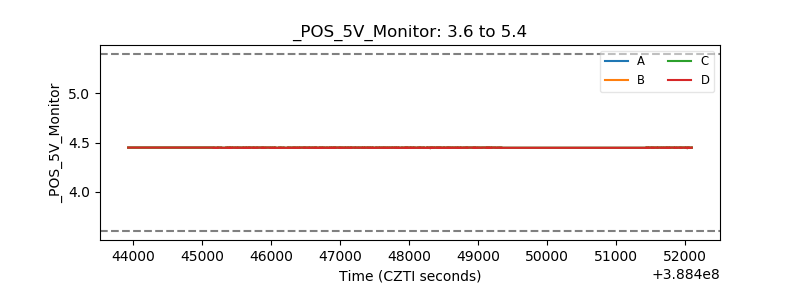 |
| _ROLL_ROT | 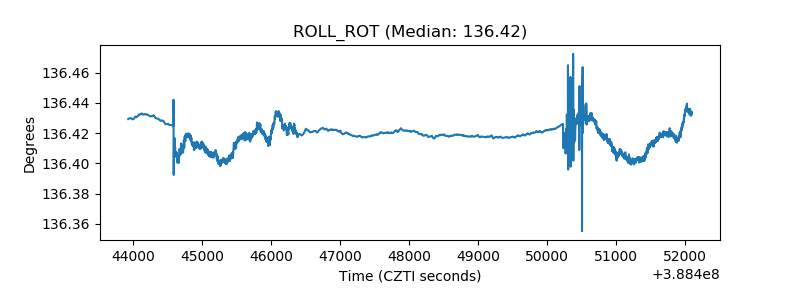 |
| _Roll_DEC | 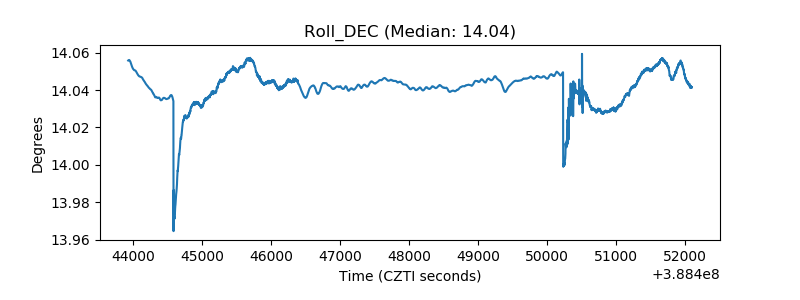 |
| _Roll_RA | 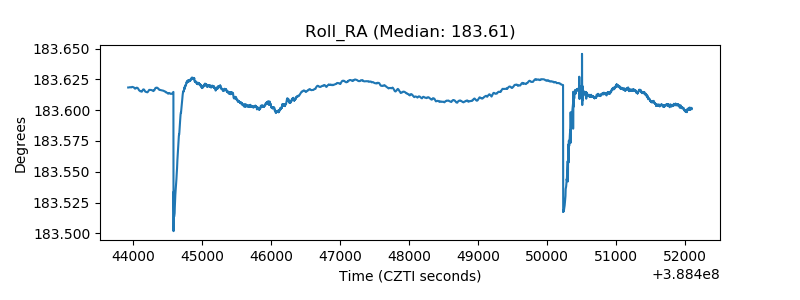 |
| Veto Counter | 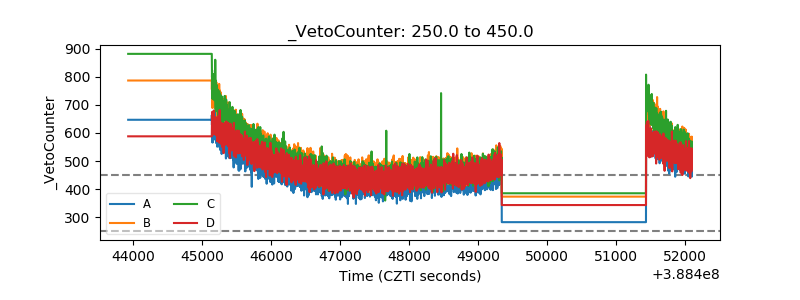 |