| Param | Original file | Final file |
|---|---|---|
| Filename | modeM0/AS1A11_097T07_9000005084_35516cztM0_level2.evt | modeM0/AS1A11_097T07_9000005084_35516cztM0_level2_quad_clean.evt |
| Size (bytes) | 794,352,960 | 155,462,400 |
| Size | 757.6 MB | 148.3 MB |
| Events in quadrant A | 5,110,732 | 1,009,542 |
| Events in quadrant B | 5,931,375 | 1,011,715 |
| Events in quadrant C | 5,819,215 | 998,080 |
| Events in quadrant D | 6,463,597 | 940,293 |
| Mode SS | |||
|---|---|---|---|
| Quadrant | BADHDUFLAG | Total packets | Discarded packets |
| A | 0 | 222 | 0 |
| B | 0 | 222 | 0 |
| C | 0 | 222 | 0 |
| D | 0 | 222 | 0 |
| Mode M0 | |||
|---|---|---|---|
| Quadrant | BADHDUFLAG | Total packets | Discarded packets |
| A | 0 | 22225 | 4 |
| B | 0 | 24626 | 3 |
| C | 0 | 23676 | 3 |
| D | 0 | 26060 | 3 |
| Mode M9 | |||
|---|---|---|---|
| Quadrant | BADHDUFLAG | Total packets | Discarded packets |
| A | 0 | 40 | 0 |
| B | 0 | 40 | 0 |
| C | 0 | 40 | 0 |
| D | 0 | 40 | 0 |
| Quadrant | Total seconds | Saturated seconds | Saturation percentage |
|---|---|---|---|
| A | 10809 | 15 | 0.138773% |
| B | 10809 | 205 | 1.896568% |
| C | 10809 | 105 | 0.971413% |
| D | 10809 | 315 | 2.914238% |
Noise dominated data is calculated using 1-second bins in cleaned event files. If a bin has >2000 counts, and if more than 50% of those come from <1% of pixels, then it is considered to be noise-dominated and hence unusable.
| Quadrant | # 1 sec bins | Bins with >0 counts | Bins with >2000 counts | High rate bins dominated by noise | Noise dominated (total time) | Noise dominated (detector-on time) | Marked lightcurve |
|---|---|---|---|---|---|---|---|
| A | 14956 | 10812 | 2 | 2 | 0.01% | 0.02% |  |
| B | 14956 | 10812 | 130 | 130 | 0.87% | 1.20% |  |
| C | 14956 | 10812 | 56 | 56 | 0.37% | 0.52% |  |
| D | 14956 | 10812 | 247 | 247 | 1.65% | 2.28% |  |
Top three noisy pixels from each quadrant. If the there are fewer than three noisy pixels in the level2.evt file, extra rows are filled as -1
| Pixel properties | Quadrant properties | ||||||
|---|---|---|---|---|---|---|---|
| Quadrant | DetID | PixID | Counts | Sigma | Mean | Median | Sigma |
| A | 10 | 83 | 234390 | 927.02 | 1246 | 1221 | 251.5 |
| A | 9 | 143 | 43879 | 169.6 | 1246 | 1221 | 251.5 |
| A | 13 | 254 | 16973 | 62.63 | 1246 | 1221 | 251.5 |
| B | 5 | 172 | 501260 | 2099.17 | 1225 | 1192 | 238.2 |
| B | 5 | 236 | 373857 | 1564.36 | 1225 | 1192 | 238.2 |
| B | 5 | 200 | 205291 | 856.76 | 1225 | 1192 | 238.2 |
| C | 15 | 214 | 449328 | 1590.73 | 1211 | 1219 | 281.7 |
| C | 0 | 10 | 413599 | 1463.9 | 1211 | 1219 | 281.7 |
| C | 14 | 67 | 126939 | 446.29 | 1211 | 1219 | 281.7 |
| D | 10 | 118 | 479205 | 1638.85 | 1202 | 1172 | 291.7 |
| D | 13 | 249 | 382084 | 1305.89 | 1202 | 1172 | 291.7 |
| D | 8 | 195 | 371319 | 1268.98 | 1202 | 1172 | 291.7 |
Histogram calculated using DETX and DETY for each event in the final _common_clean file
| Quadrant A | 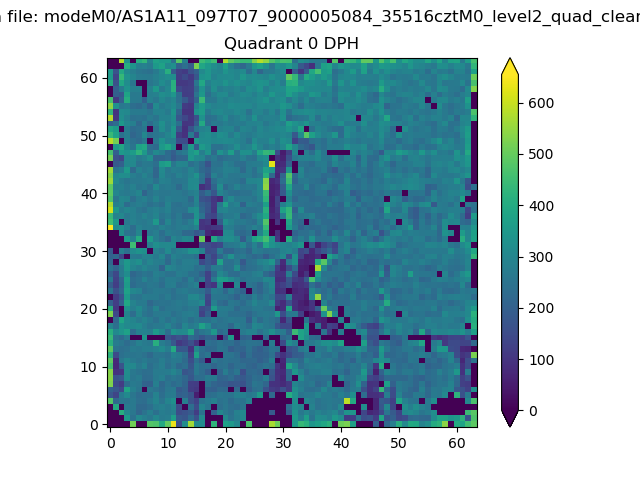 |
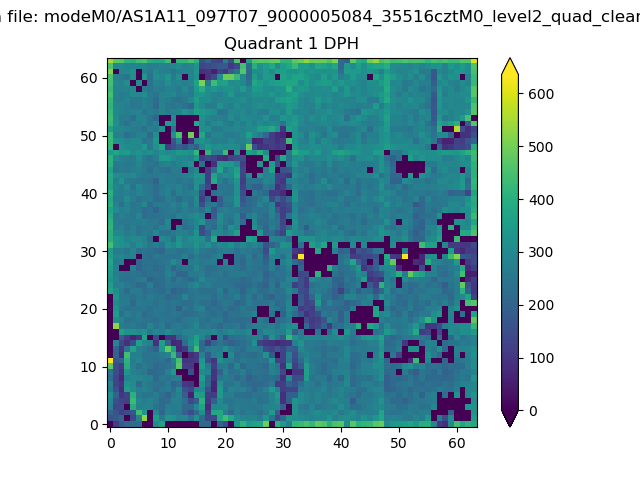 |
Quadrant B |
|---|---|---|---|
| Quadrant D | 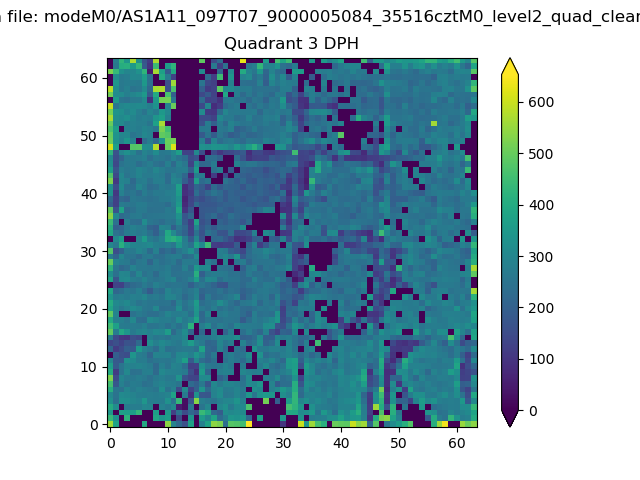 |
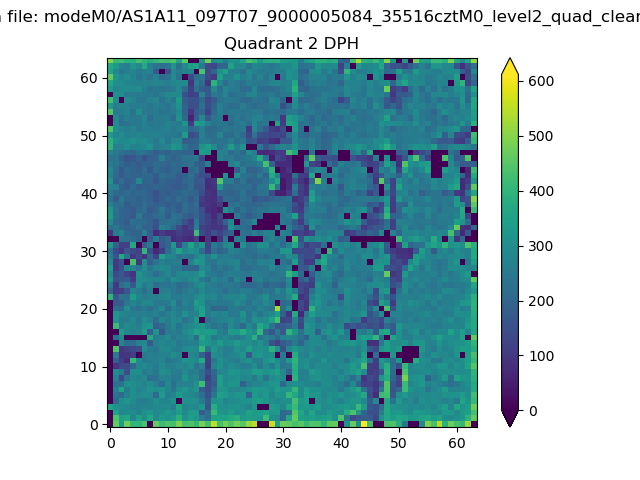 |
Quadrant C |
| Plot type | Count rate plots | Images |
|---|---|---|
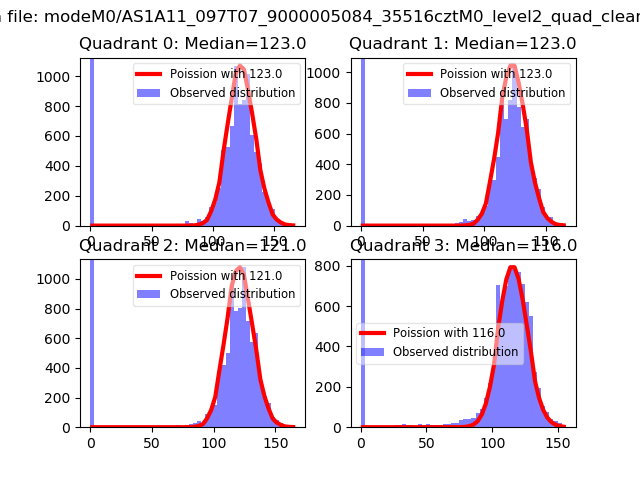
| Comparison with Poisson distribution Blue bars denote a histogram of data divided into 1 sec bins. Red curve is a Poisson curve with rate = median count rate of data. |
 |
 |
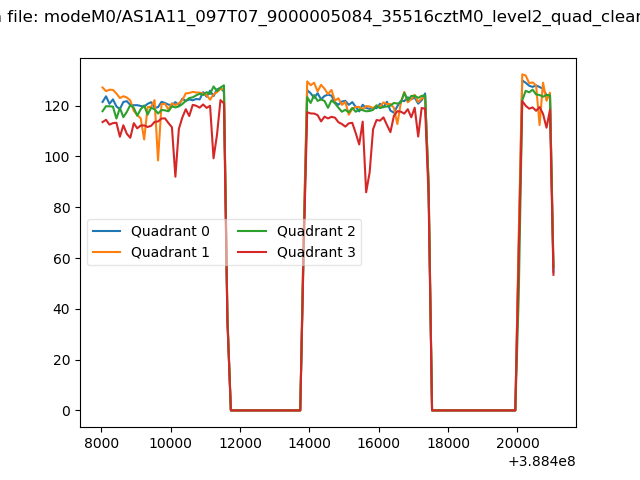
| Quadrant-wise count rates Data is divided into 100 sec bins |
 |
|
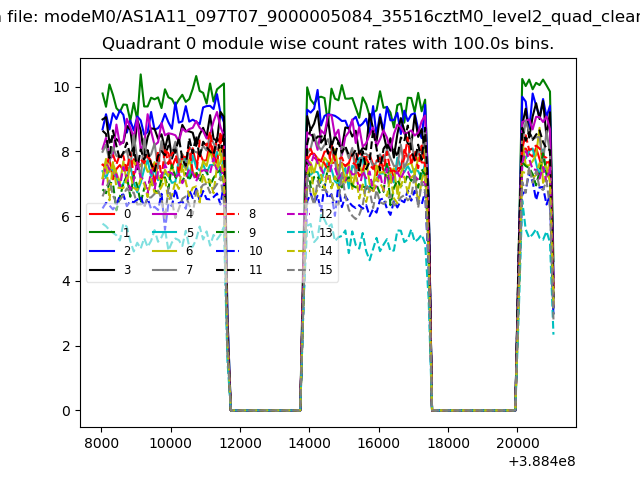
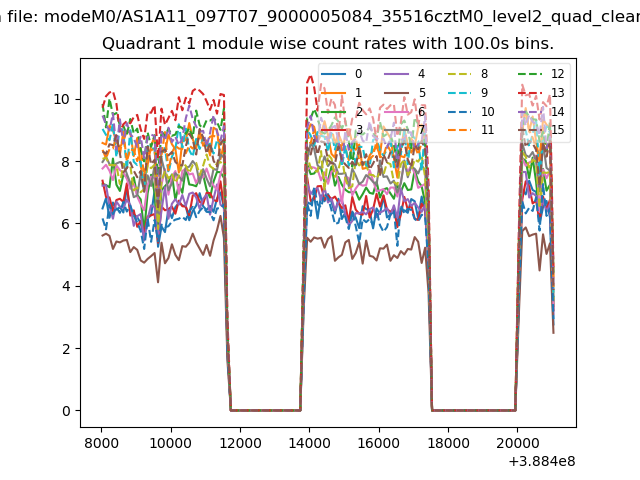
| Module-wise count rates for Quadrant A Data is divided into 100 sec bins |
 |
 |
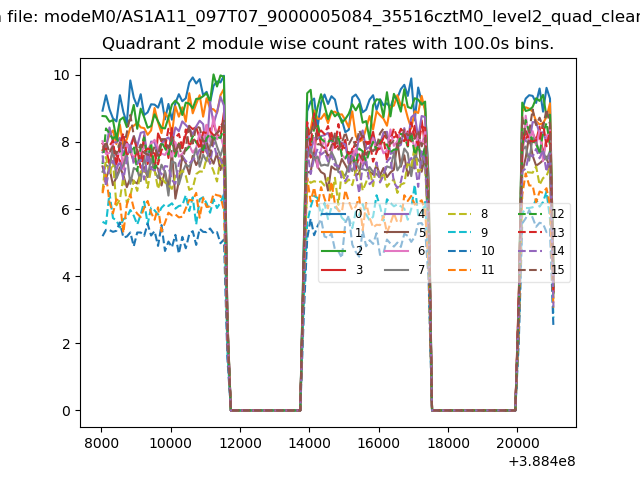
| Module-wise count rates for Quadrant B Data is divided into 100 sec bins |
 |
 |
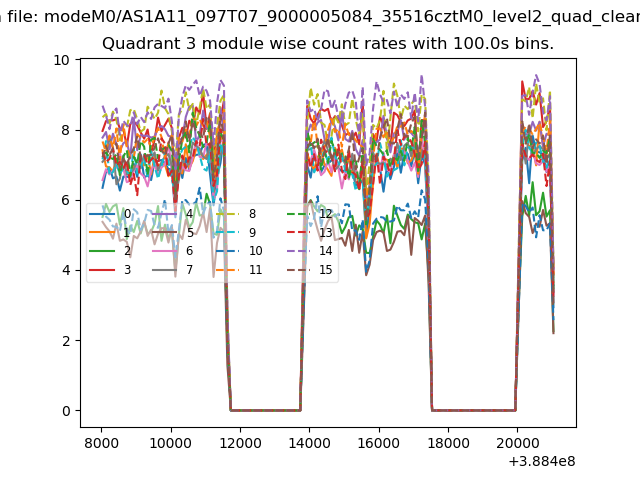
| Module-wise count rates for Quadrant C Data is divided into 100 sec bins |
 |
 |
| Module-wise count rates for Quadrant D Data is divided into 100 sec bins |
 |
 |
| Parameter | Plot |
|---|---|
| CZT HV Monitor | 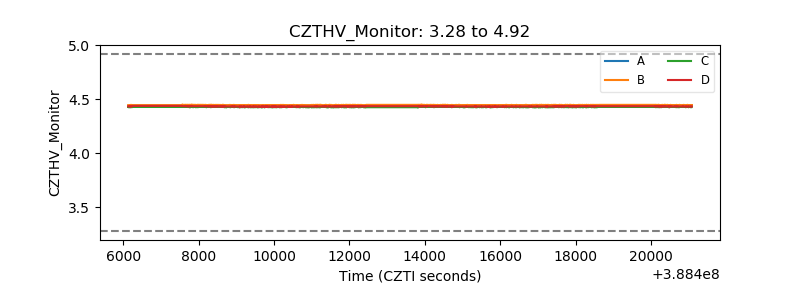 |
| D_VDD | 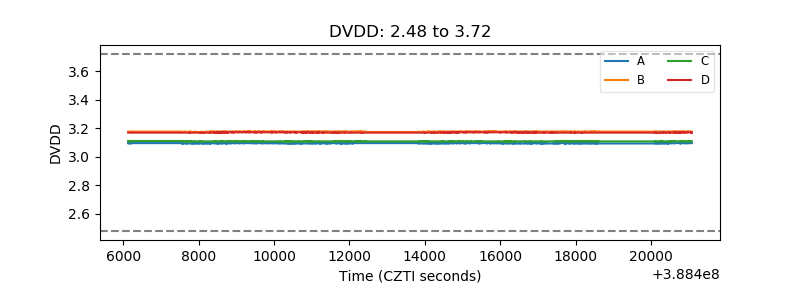 |
| Temperature 1 | 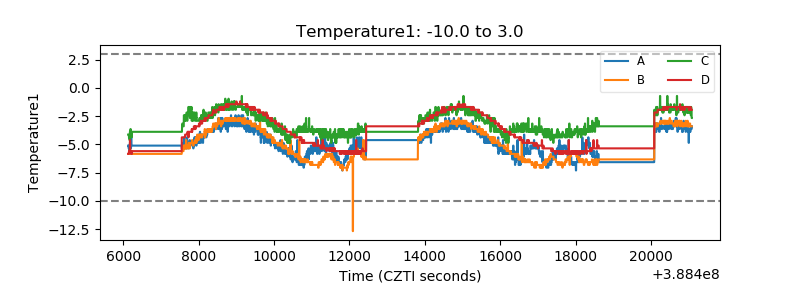 |
| Veto HV Monitor | 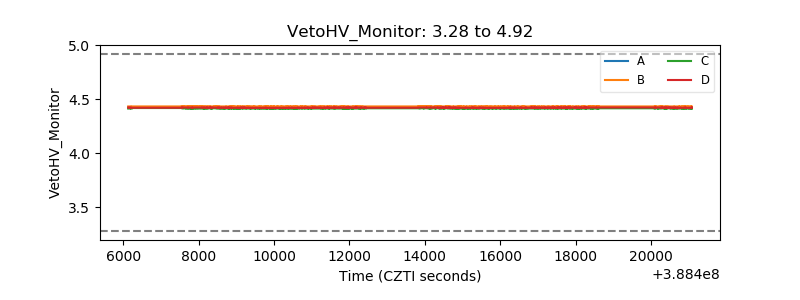 |
| Veto LLD | 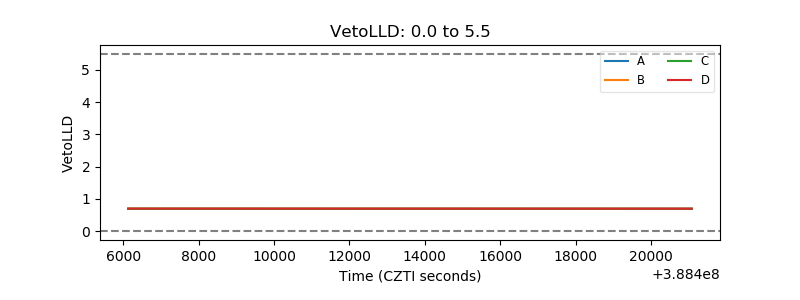 |
| Alpha Counter | 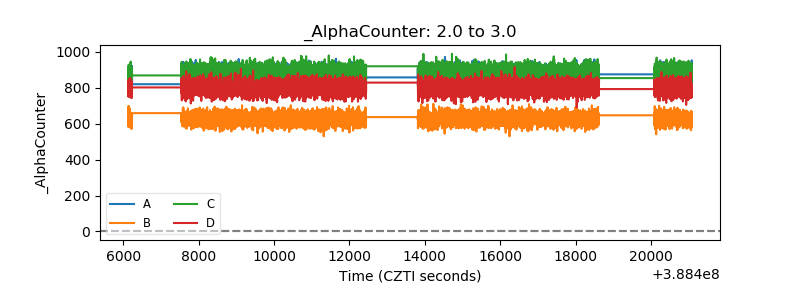 |
| _CPM_Rate | 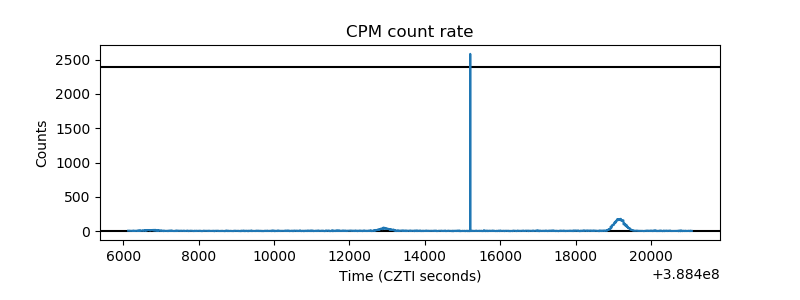 |
| CZT Counter | 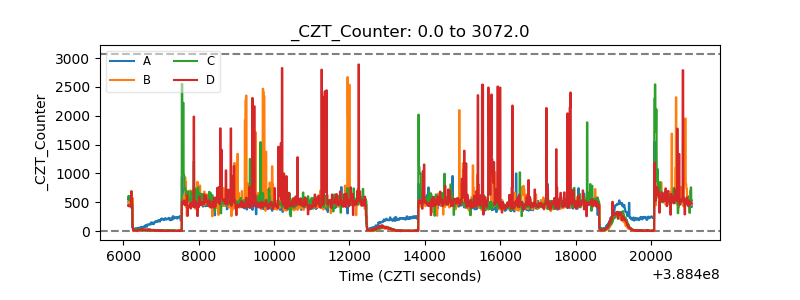 |
| +2.5 Volts monitor | 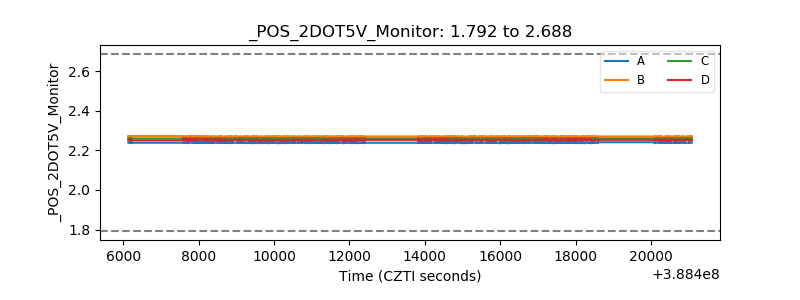 |
| +5 Volts monitor | 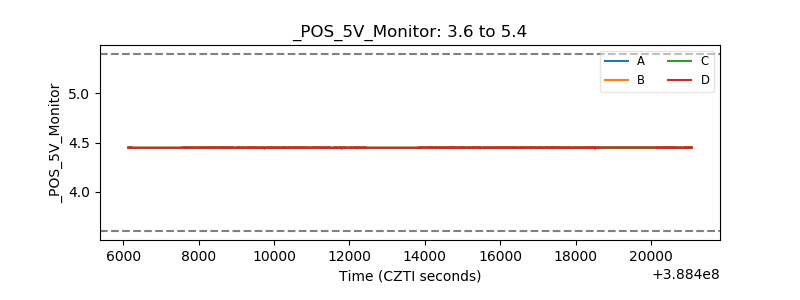 |
| _ROLL_ROT | 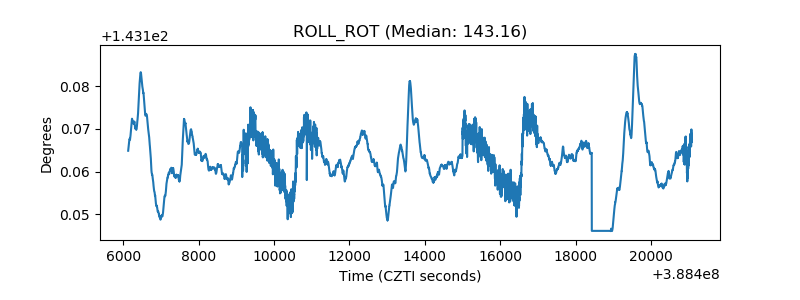 |
| _Roll_DEC | 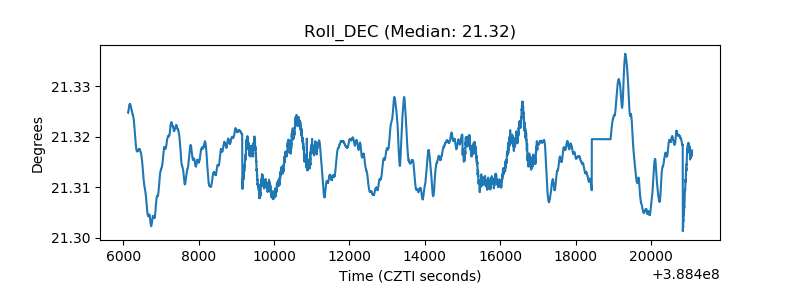 |
| _Roll_RA | 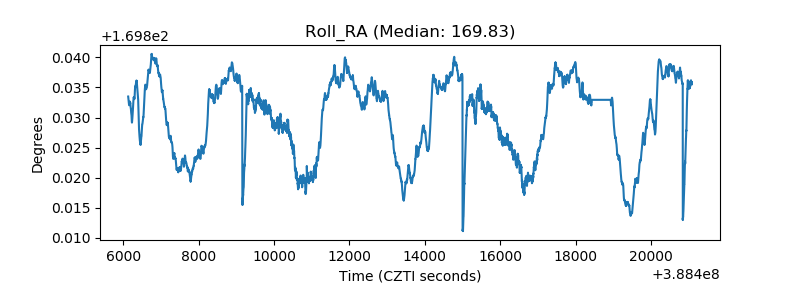 |
| Veto Counter |  |