| Param | Original file | Final file |
|---|---|---|
| Filename | modeM0/AS1A11_097T07_9000005084cztM0_level2_bc.evt | modeM0/AS1A11_097T07_9000005084cztM0_level2_quad_clean.evt |
| Size (bytes) | 2,252,494,080 | 705,922,560 |
| Size | 2.1 GB | 673.2 MB |
| Events in quadrant A | 13,020,860 | 4,457,938 |
| Events in quadrant B | 15,109,232 | 4,498,805 |
| Events in quadrant C | 19,195,790 | 4,388,341 |
| Events in quadrant D | 17,055,588 | 4,172,775 |
| Mode SS | |||
|---|---|---|---|
| Quadrant | BADHDUFLAG | Total packets | Discarded packets |
| A | 0 | 1150 | 0 |
| B | 0 | 1150 | 0 |
| C | 0 | 1150 | 0 |
| D | 0 | 1150 | 0 |
| Mode M0 | |||
|---|---|---|---|
| Quadrant | BADHDUFLAG | Total packets | Discarded packets |
| A | 0 | 117119 | 0 |
| B | 0 | 127527 | 0 |
| C | 0 | 136801 | 0 |
| D | 0 | 131360 | 0 |
| Mode M9 | |||
|---|---|---|---|
| Quadrant | BADHDUFLAG | Total packets | Discarded packets |
| A | 0 | 223 | 0 |
| B | 0 | 223 | 0 |
| C | 0 | 223 | 0 |
| D | 0 | 223 | 0 |
| Quadrant | Total seconds | Saturated seconds | Saturation percentage |
|---|---|---|---|
| A | 56324 | 260 | 0.461615% |
| B | 56324 | 844 | 1.498473% |
| C | 56324 | 1286 | 2.283219% |
| D | 56324 | 1125 | 1.997372% |
Noise dominated data is calculated using 1-second bins in cleaned event files. If a bin has >2000 counts, and if more than 50% of those come from <1% of pixels, then it is considered to be noise-dominated and hence unusable.
| Quadrant | # 1 sec bins | Bins with >0 counts | Bins with >2000 counts | High rate bins dominated by noise | Noise dominated (total time) | Noise dominated (detector-on time) | Marked lightcurve |
|---|---|---|---|---|---|---|---|
| A | 82340 | 56338 | 79 | 79 | 0.10% | 0.14% | 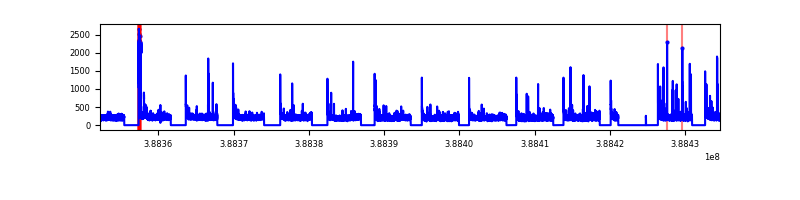 |
| B | 82340 | 56325 | 59 | 59 | 0.07% | 0.10% | 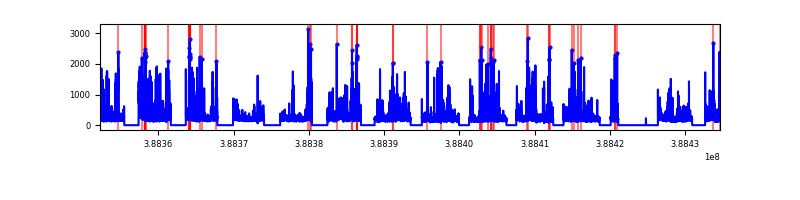 |
| C | 82340 | 56328 | 170 | 170 | 0.21% | 0.30% | 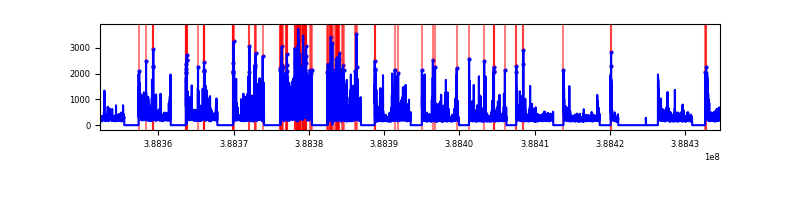 |
| D | 82340 | 56325 | 180 | 180 | 0.22% | 0.32% | 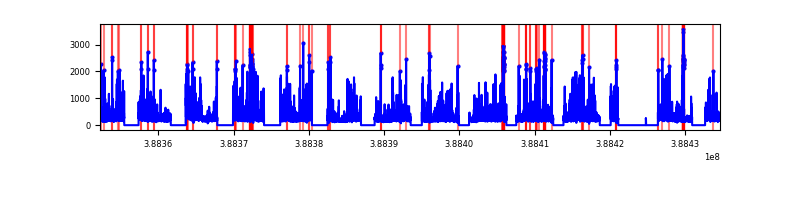 |
Top three noisy pixels from each quadrant. If the there are fewer than three noisy pixels in the level2.evt file, extra rows are filled as -1
| Pixel properties | Quadrant properties | ||||||
|---|---|---|---|---|---|---|---|
| Quadrant | DetID | PixID | Counts | Sigma | Mean | Median | Sigma |
| A | 10 | 83 | 1064027 | 1660.78 | 2895 | 2845 | 639.0 |
| A | 15 | 169 | 566987 | 882.9 | 2895 | 2845 | 639.0 |
| A | 9 | 143 | 111392 | 169.88 | 2895 | 2845 | 639.0 |
| B | 5 | 172 | 1779919 | 3110.27 | 2920 | 2858 | 571.4 |
| B | 5 | 236 | 1097637 | 1916.12 | 2920 | 2858 | 571.4 |
| B | 5 | 200 | 571793 | 995.77 | 2920 | 2858 | 571.4 |
| C | 0 | 10 | 2821507 | 4327.47 | 2837 | 2814 | 651.3 |
| C | 15 | 214 | 2184455 | 3349.42 | 2837 | 2814 | 651.3 |
| C | 0 | 207 | 1371374 | 2101.12 | 2837 | 2814 | 651.3 |
| D | 8 | 195 | 1112556 | 1662.56 | 2835 | 2755 | 667.5 |
| D | 7 | 80 | 1008150 | 1506.16 | 2835 | 2755 | 667.5 |
| D | 13 | 249 | 804124 | 1200.51 | 2835 | 2755 | 667.5 |
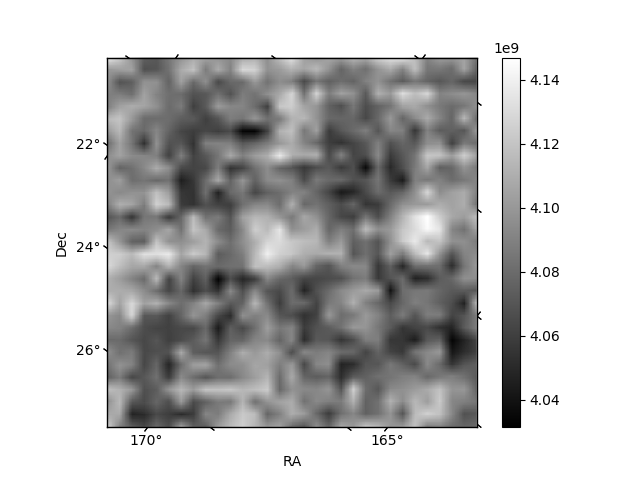
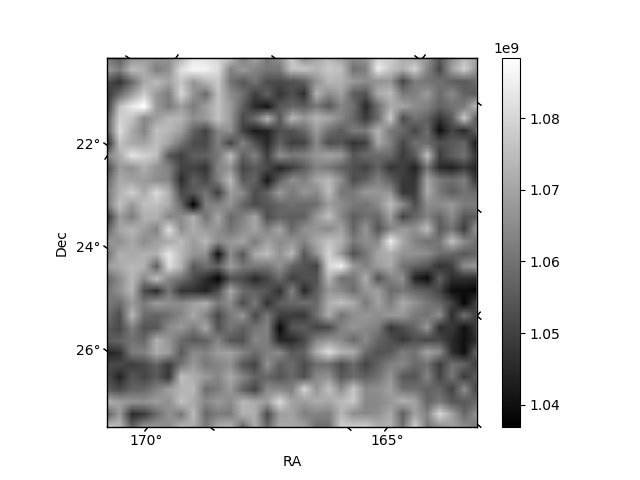
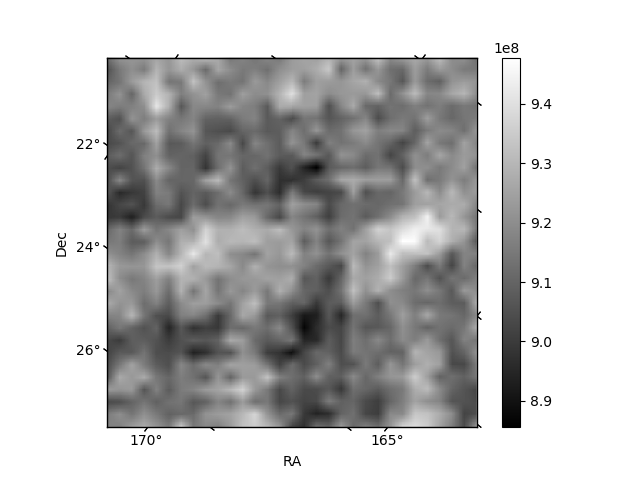
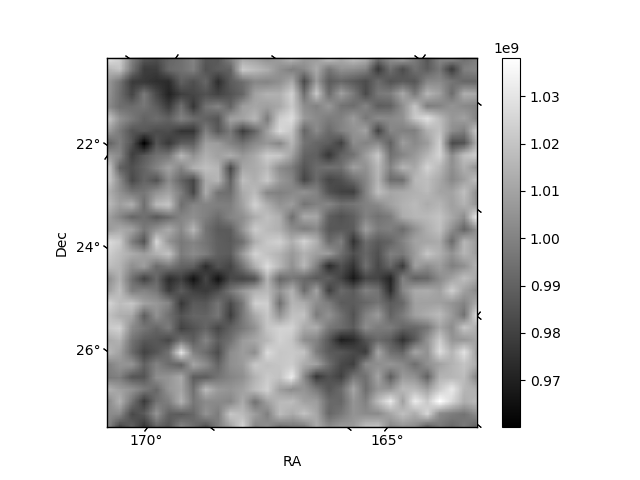
Histogram calculated using DETX and DETY for each event in the final _common_clean file
| Quadrant A | 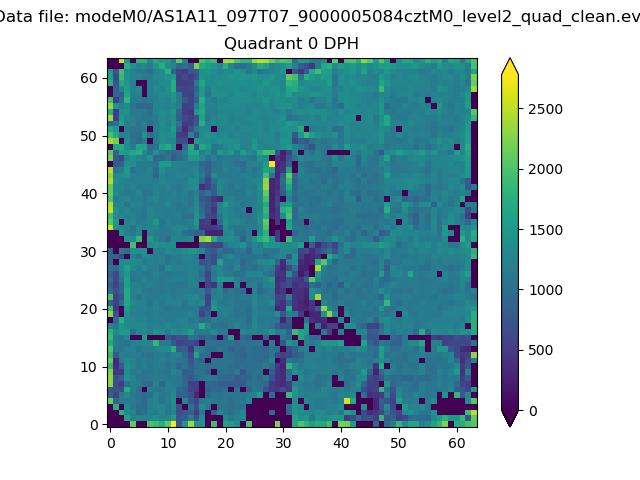 |
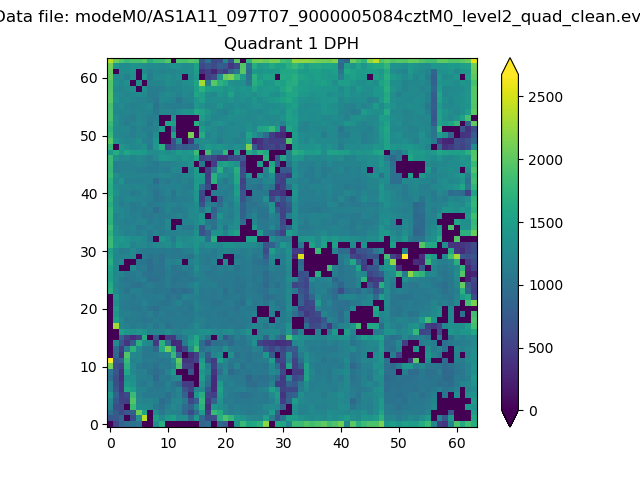 |
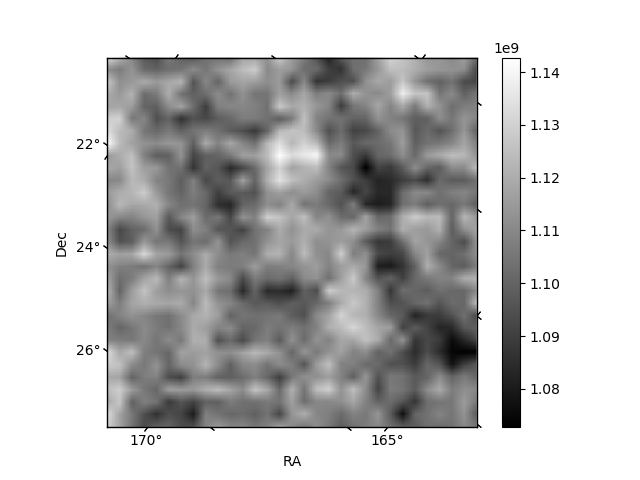
Quadrant B |
|---|---|---|---|
| Quadrant D | 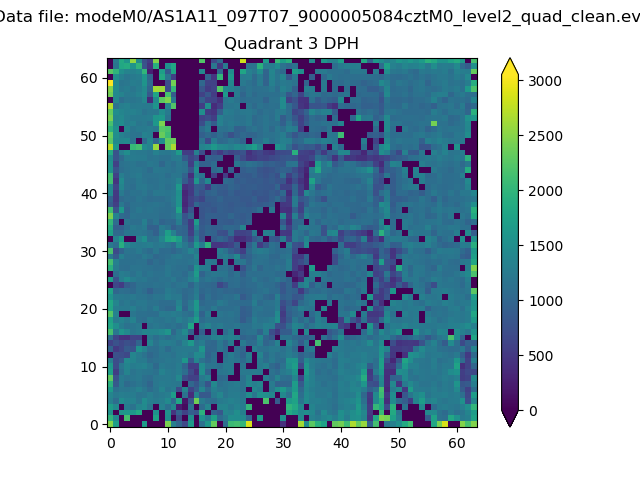 |
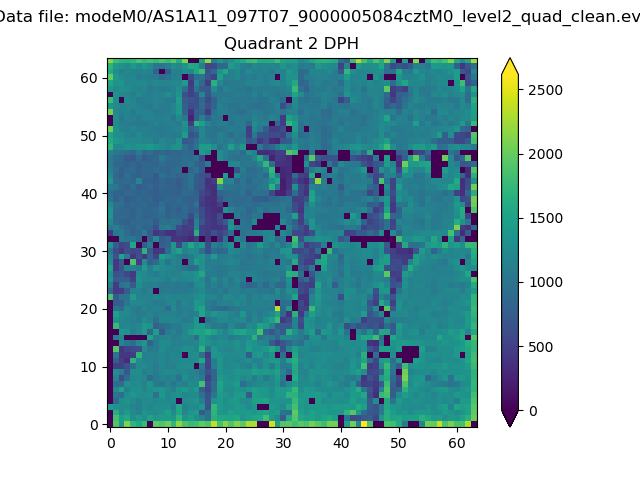 |
Quadrant C |
| Plot type | Count rate plots | Images |
|---|---|---|
| Comparison with Poisson distribution Blue bars denote a histogram of data divided into 1 sec bins. Red curve is a Poisson curve with rate = median count rate of data. |
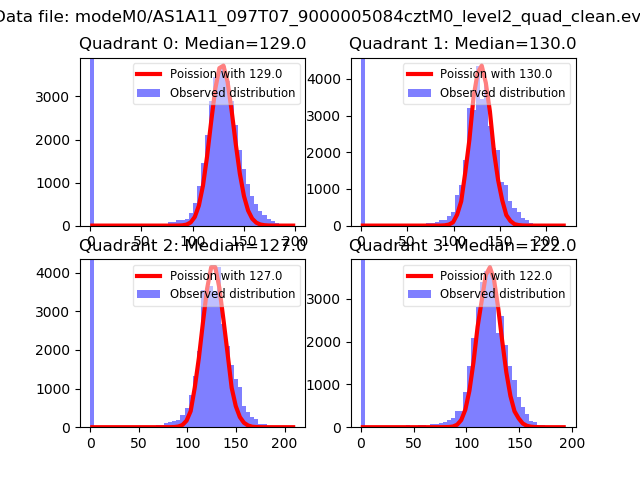 |
 |
| Quadrant-wise count rates Data is divided into 100 sec bins |
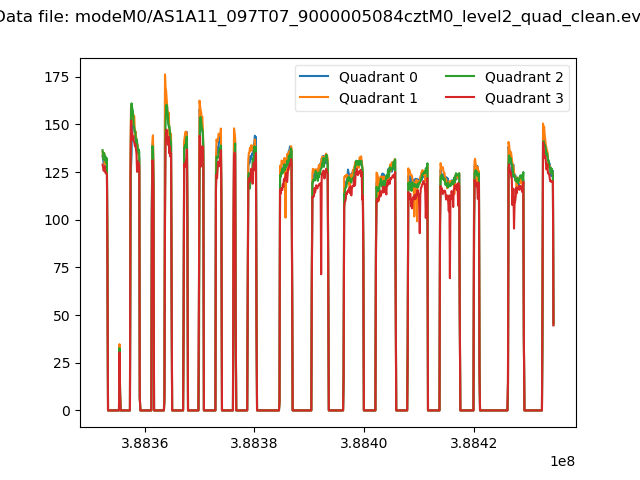 |
|
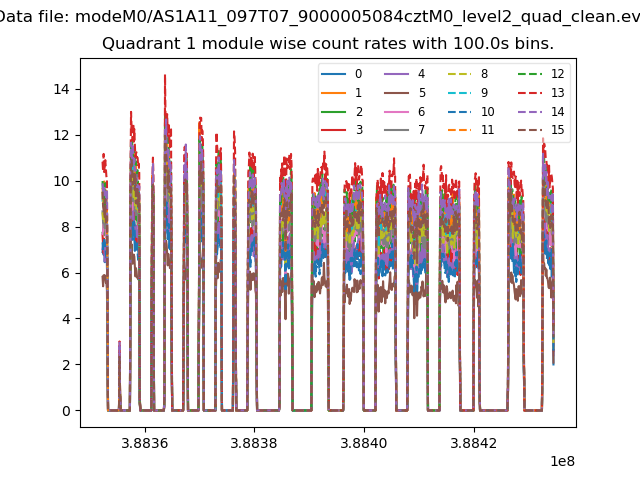
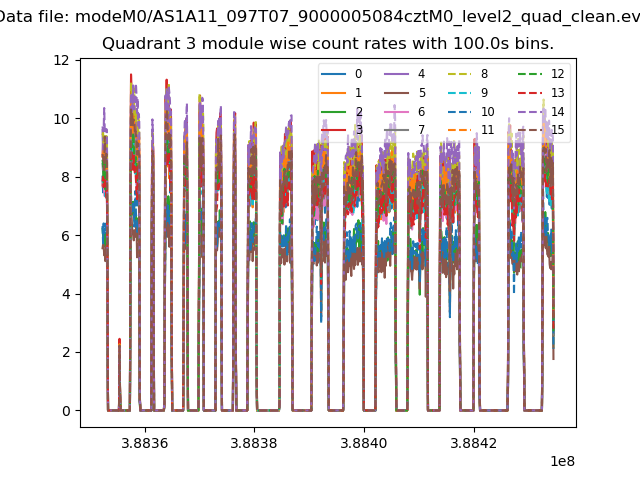
| Module-wise count rates for Quadrant A Data is divided into 100 sec bins |
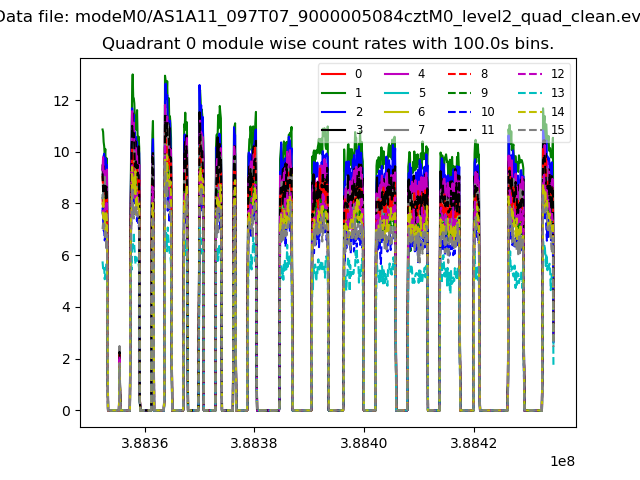 |
 |
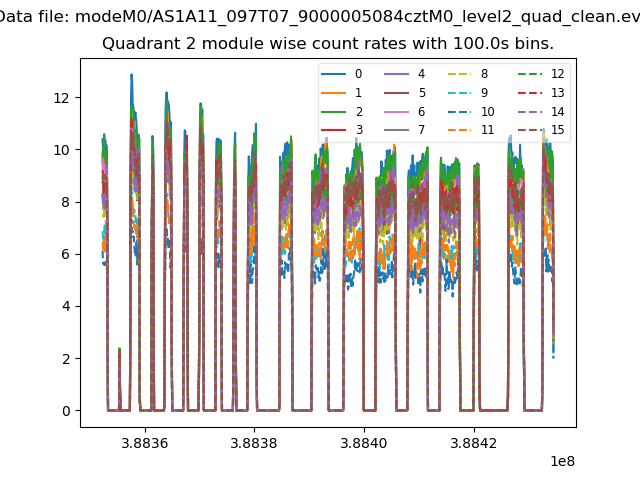
| Module-wise count rates for Quadrant B Data is divided into 100 sec bins |
 |
 |
| Module-wise count rates for Quadrant C Data is divided into 100 sec bins |
 |
 |
| Module-wise count rates for Quadrant D Data is divided into 100 sec bins |
 |
 |
| Parameter | Plot |
|---|---|
| CZT HV Monitor | 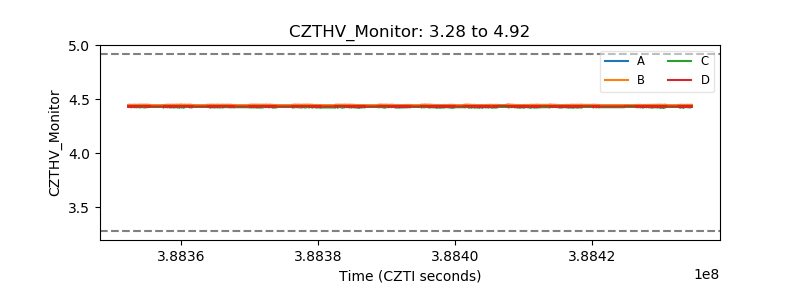 |
| D_VDD | 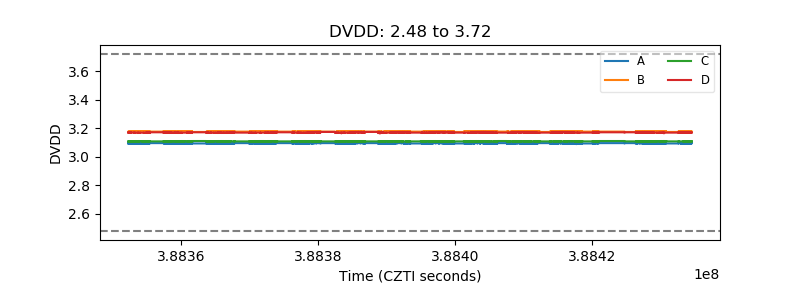 |
| Temperature 1 | 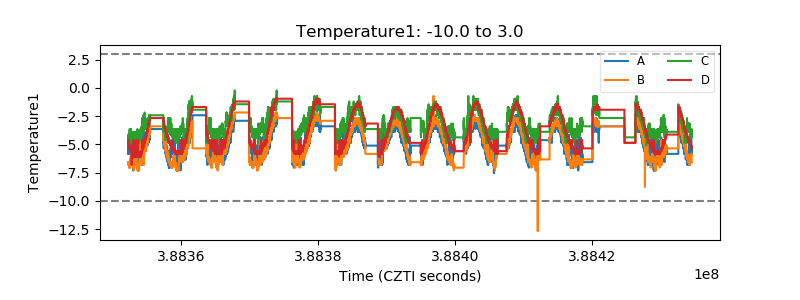 |
| Veto HV Monitor | 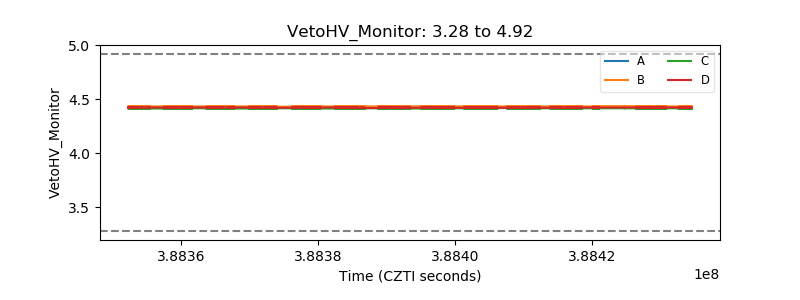 |
| Veto LLD | 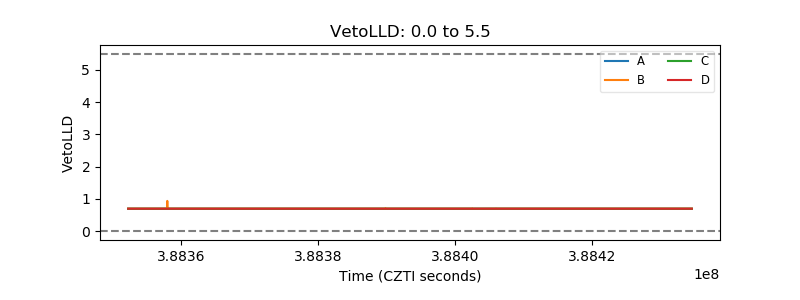 |
| Alpha Counter | 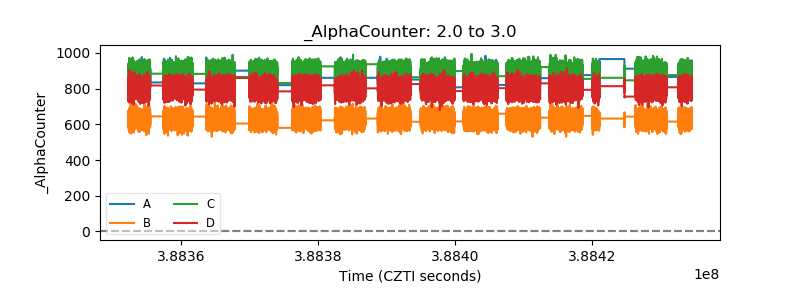 |
| _CPM_Rate | 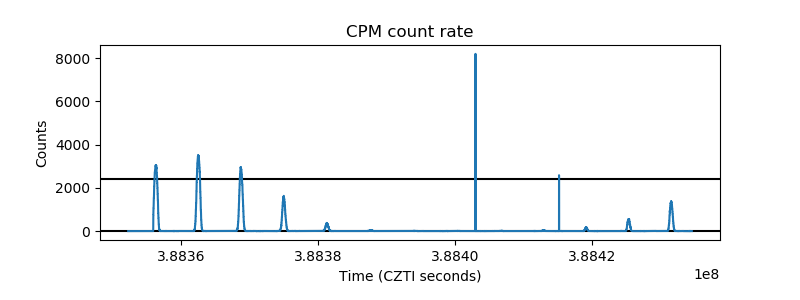 |
| CZT Counter | 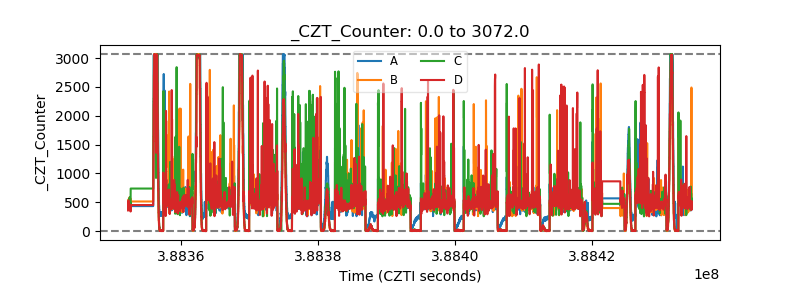 |
| +2.5 Volts monitor | 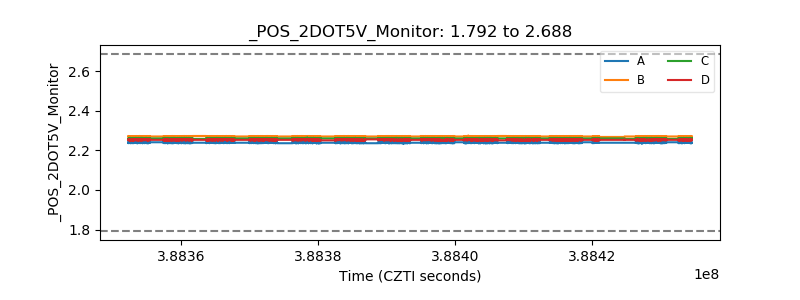 |
| +5 Volts monitor | 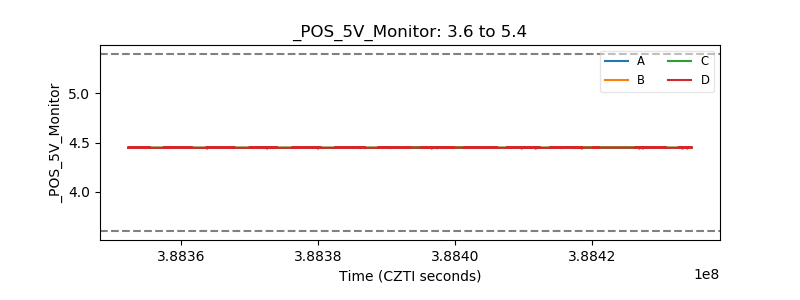 |
| _ROLL_ROT | 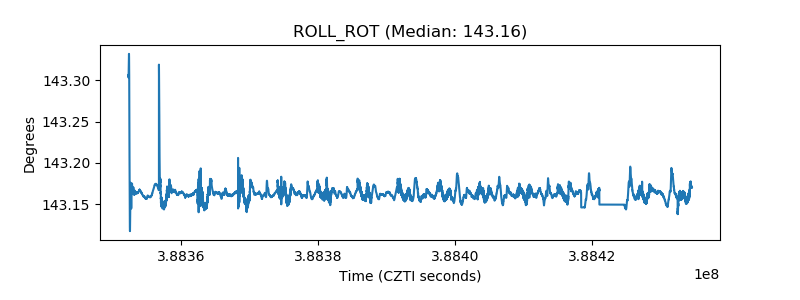 |
| _Roll_DEC | 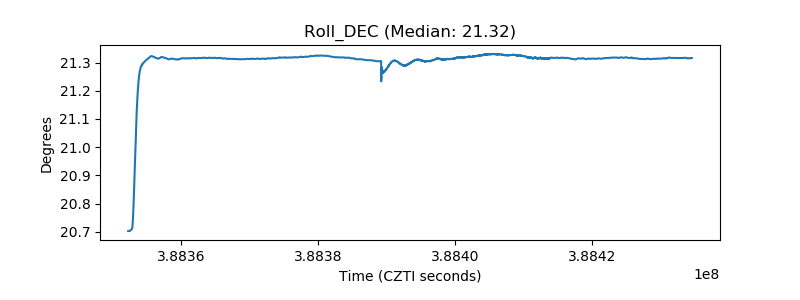 |
| _Roll_RA | 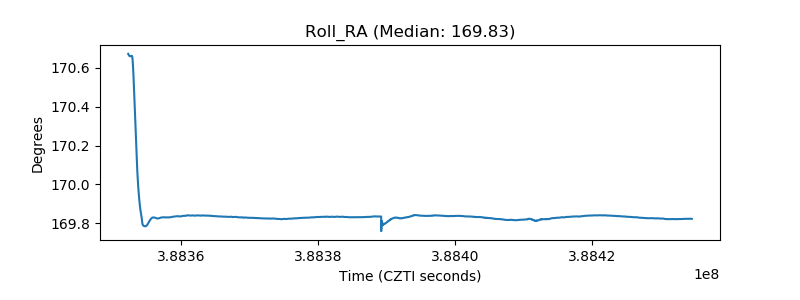 |
| Veto Counter | 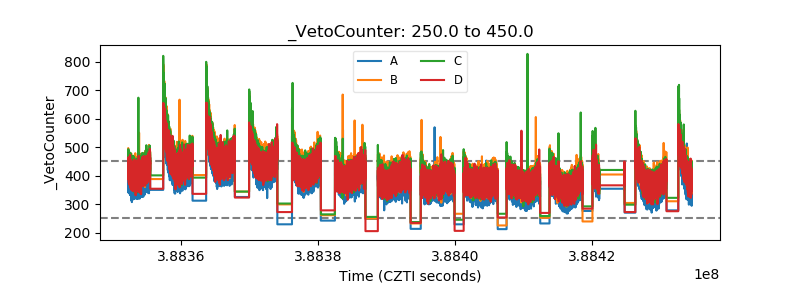 |