| Param | Original file | Final file |
|---|---|---|
| Filename | modeM0/AS1A11_097T22_9000005082_35502cztM0_level2.evt | modeM0/AS1A11_097T22_9000005082_35502cztM0_level2_quad_clean.evt |
| Size (bytes) | 1,335,240,000 | 211,642,560 |
| Size | 1.2 GB | 201.8 MB |
| Events in quadrant A | 8,686,533 | 1,347,916 |
| Events in quadrant B | 9,967,572 | 1,337,097 |
| Events in quadrant C | 9,832,931 | 1,369,191 |
| Events in quadrant D | 10,904,059 | 1,285,140 |
| Mode M9 | |||
|---|---|---|---|
| Quadrant | BADHDUFLAG | Total packets | Discarded packets |
| A | 0 | 47 | 0 |
| B | 0 | 47 | 0 |
| C | 0 | 47 | 0 |
| D | 0 | 48 | 0 |
| Mode M0 | |||
|---|---|---|---|
| Quadrant | BADHDUFLAG | Total packets | Discarded packets |
| A | 0 | 35967 | 5 |
| B | 0 | 39793 | 4 |
| C | 0 | 38508 | 4 |
| D | 0 | 43013 | 4 |
| Mode SS | |||
|---|---|---|---|
| Quadrant | BADHDUFLAG | Total packets | Discarded packets |
| A | 0 | 316 | 0 |
| B | 0 | 316 | 0 |
| C | 0 | 316 | 0 |
| D | 0 | 316 | 0 |
| Quadrant | Total seconds | Saturated seconds | Saturation percentage |
|---|---|---|---|
| A | 15514 | 540 | 3.480727% |
| B | 15514 | 963 | 6.207297% |
| C | 15514 | 457 | 2.945726% |
| D | 15514 | 799 | 5.150187% |
Noise dominated data is calculated using 1-second bins in cleaned event files. If a bin has >2000 counts, and if more than 50% of those come from <1% of pixels, then it is considered to be noise-dominated and hence unusable.
| Quadrant | # 1 sec bins | Bins with >0 counts | Bins with >2000 counts | High rate bins dominated by noise | Noise dominated (total time) | Noise dominated (detector-on time) | Marked lightcurve |
|---|---|---|---|---|---|---|---|
| A | 19748 | 15517 | 445 | 445 | 2.25% | 2.87% | 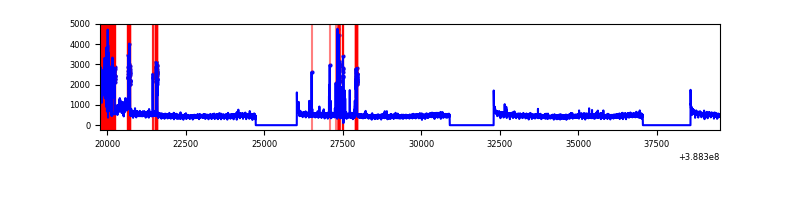 |
| B | 19748 | 15517 | 594 | 594 | 3.01% | 3.83% | 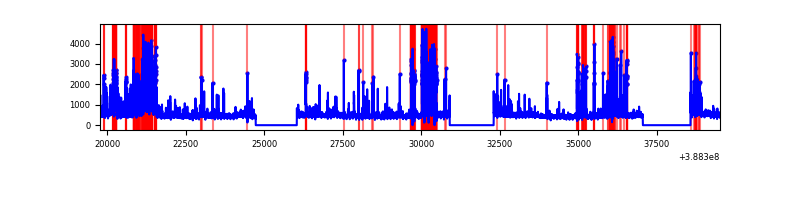 |
| C | 19748 | 15517 | 385 | 385 | 1.95% | 2.48% | 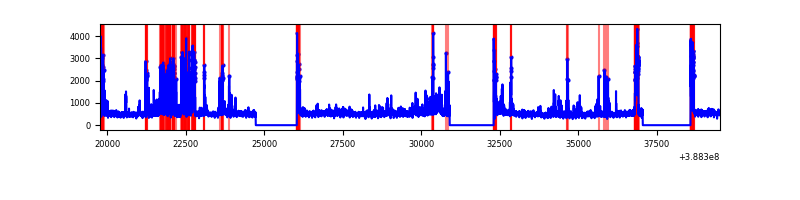 |
| D | 19748 | 15517 | 719 | 719 | 3.64% | 4.63% | 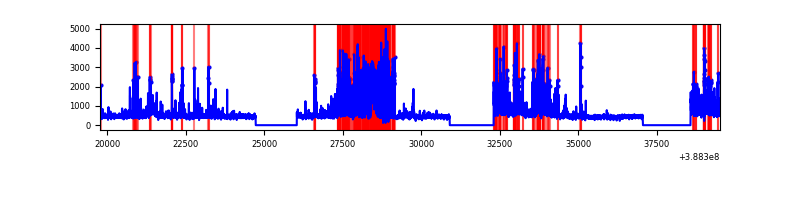 |
Top three noisy pixels from each quadrant. If the there are fewer than three noisy pixels in the level2.evt file, extra rows are filled as -1
| Pixel properties | Quadrant properties | ||||||
|---|---|---|---|---|---|---|---|
| Quadrant | DetID | PixID | Counts | Sigma | Mean | Median | Sigma |
| A | 15 | 169 | 1581171 | 4486.6 | 1746 | 1712 | 352.0 |
| A | 10 | 83 | 312709 | 883.42 | 1746 | 1712 | 352.0 |
| A | 13 | 6 | 29771 | 79.7 | 1746 | 1712 | 352.0 |
| B | 5 | 172 | 1569321 | 4766.56 | 1722 | 1672 | 328.9 |
| B | 5 | 236 | 1402909 | 4260.57 | 1722 | 1672 | 328.9 |
| B | 5 | 200 | 89747 | 267.8 | 1722 | 1672 | 328.9 |
| C | 0 | 239 | 942428 | 2376.64 | 1722 | 1735 | 395.8 |
| C | 15 | 214 | 634780 | 1599.38 | 1722 | 1735 | 395.8 |
| C | 0 | 10 | 556739 | 1402.21 | 1722 | 1735 | 395.8 |
| D | 12 | 217 | 2353243 | 5672.23 | 1704 | 1653 | 414.6 |
| D | 13 | 249 | 799820 | 1925.24 | 1704 | 1653 | 414.6 |
| D | 8 | 195 | 215815 | 516.58 | 1704 | 1653 | 414.6 |
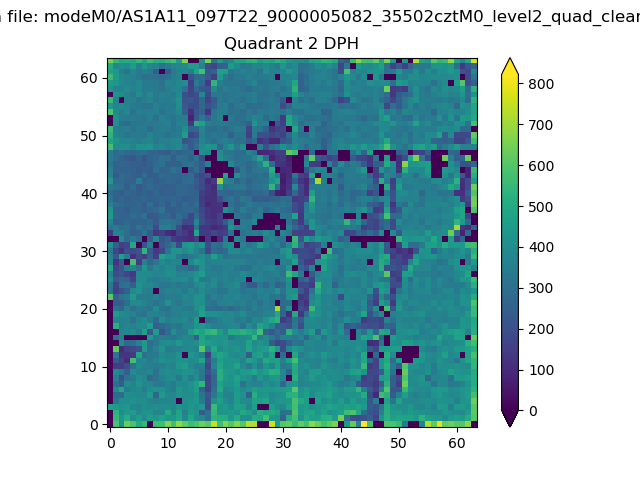
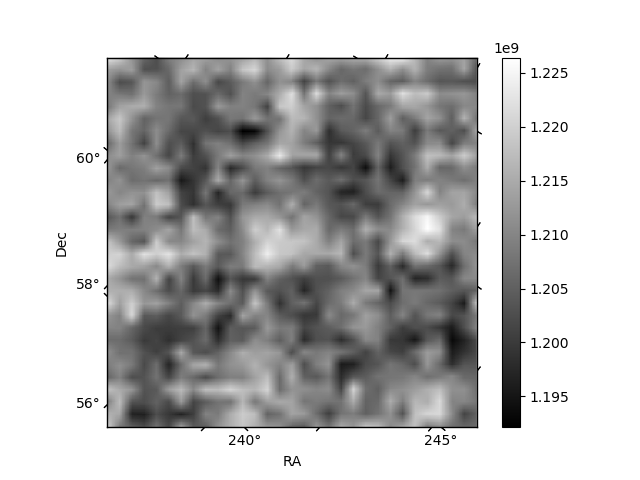
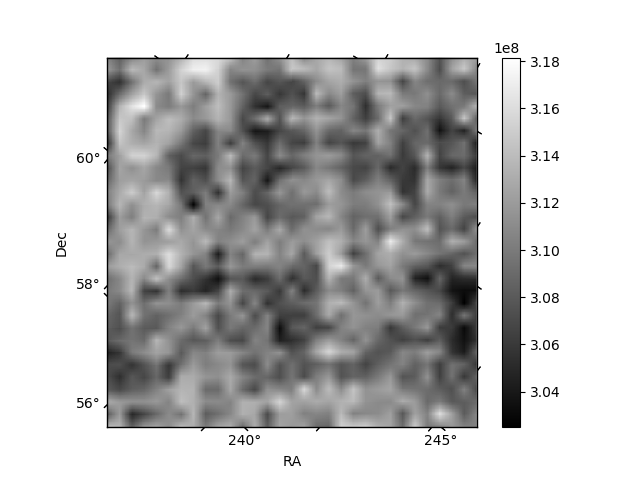
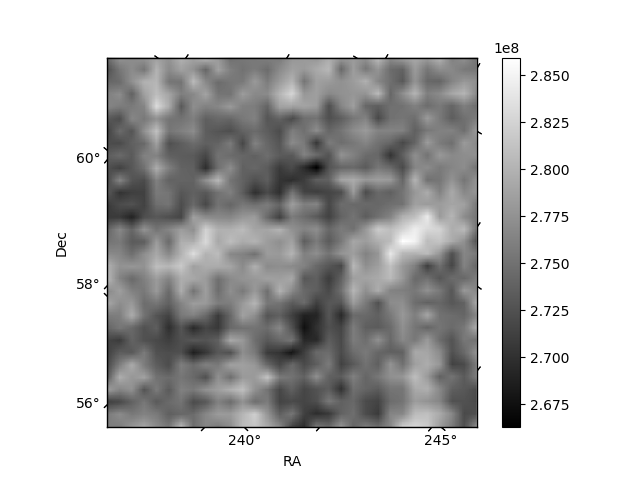
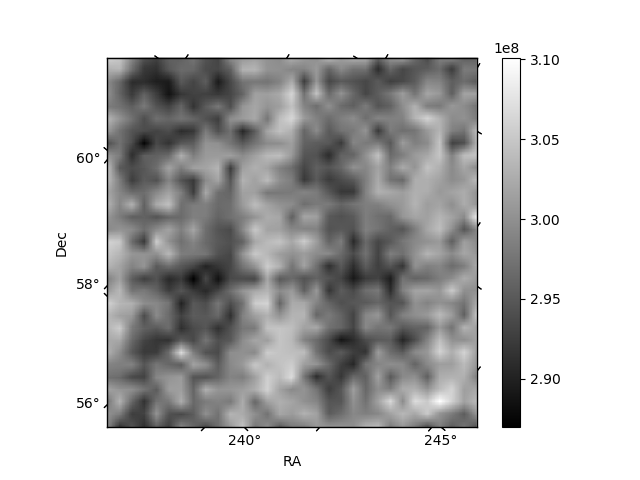
Histogram calculated using DETX and DETY for each event in the final _common_clean file
| Quadrant A | 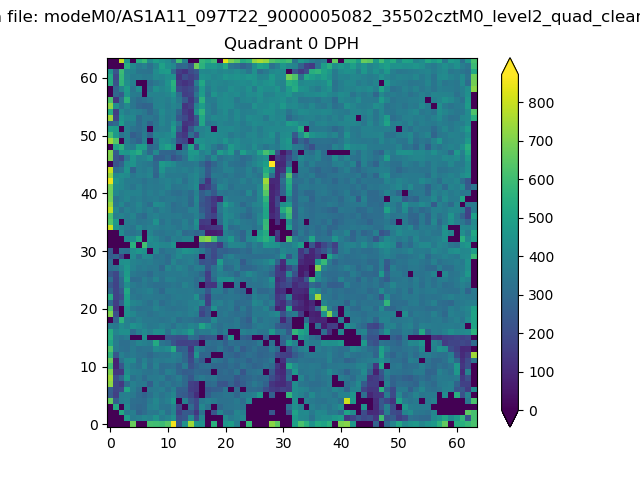 |
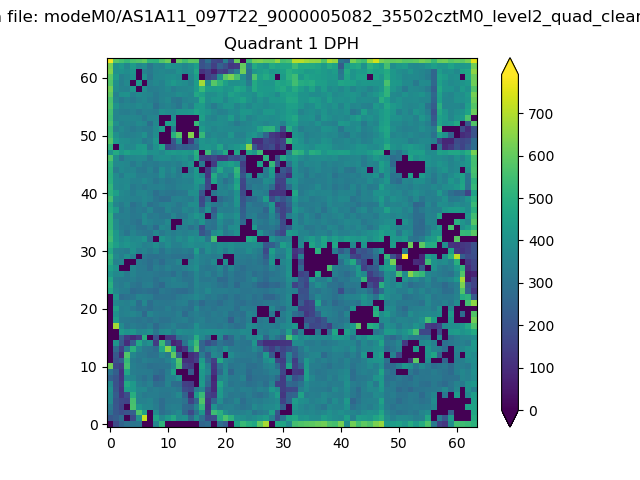 |
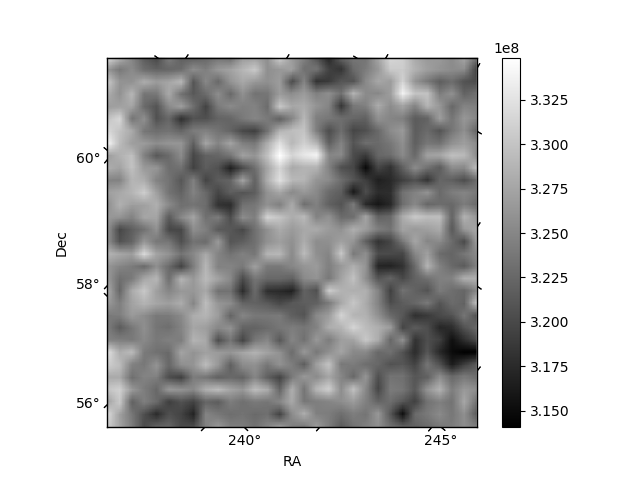
Quadrant B |
|---|---|---|---|
| Quadrant D | 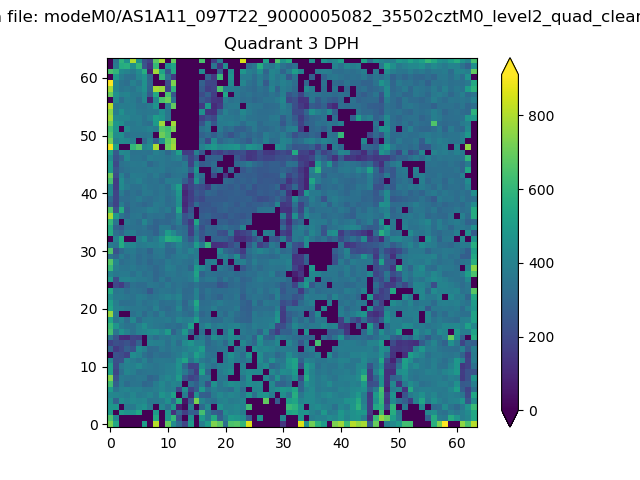 |
 |
Quadrant C |
| Plot type | Count rate plots | Images |
|---|---|---|
| Comparison with Poisson distribution Blue bars denote a histogram of data divided into 1 sec bins. Red curve is a Poisson curve with rate = median count rate of data. |
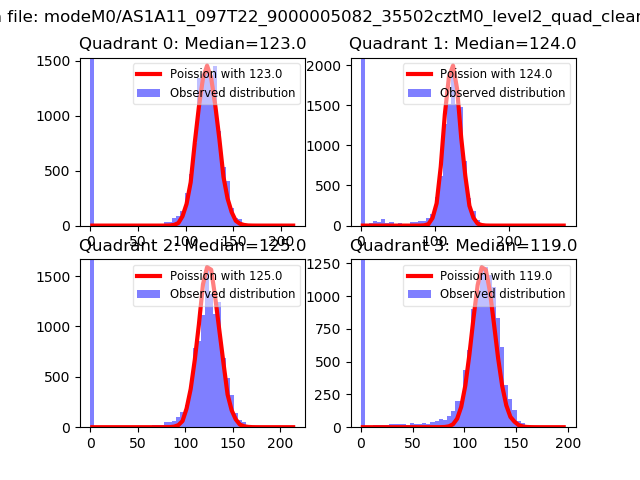 |
 |
| Quadrant-wise count rates Data is divided into 100 sec bins |
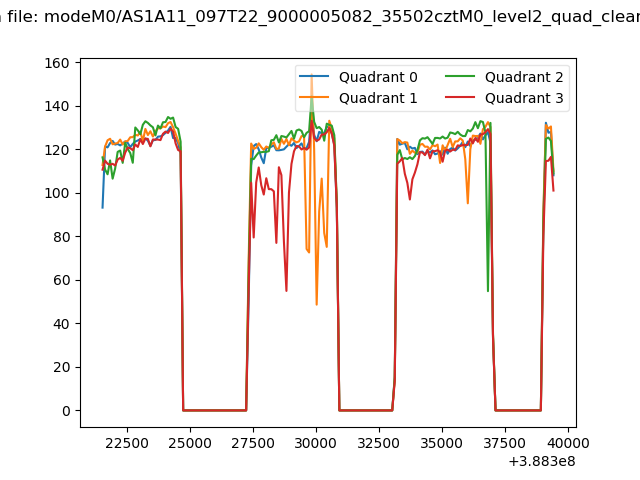 |
|
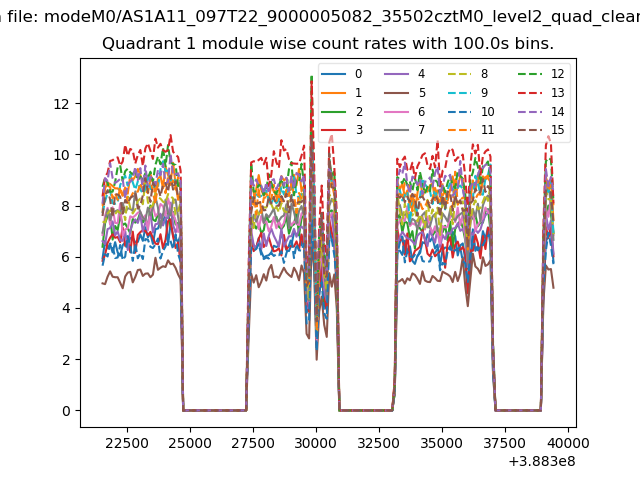
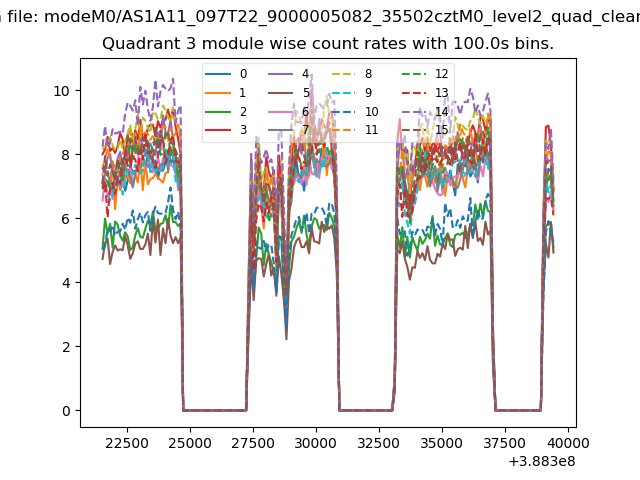
| Module-wise count rates for Quadrant A Data is divided into 100 sec bins |
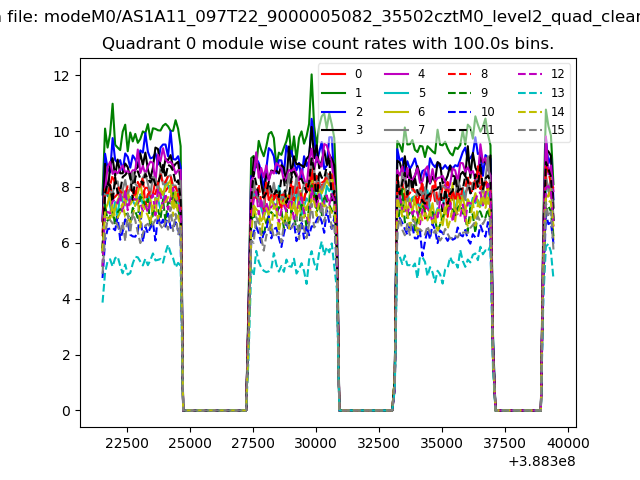 |
 |
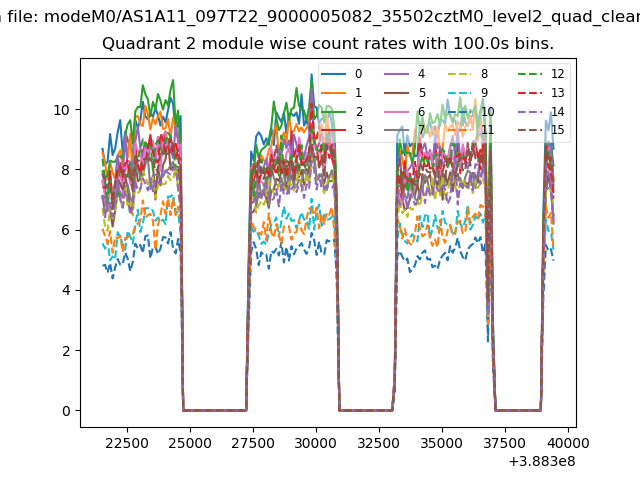
| Module-wise count rates for Quadrant B Data is divided into 100 sec bins |
 |
 |
| Module-wise count rates for Quadrant C Data is divided into 100 sec bins |
 |
 |
| Module-wise count rates for Quadrant D Data is divided into 100 sec bins |
 |
 |
| Parameter | Plot |
|---|---|
| CZT HV Monitor | 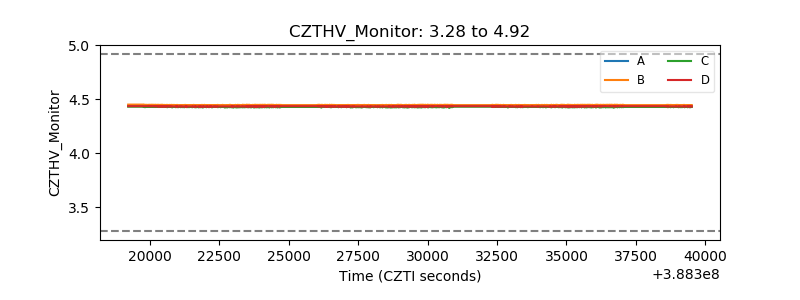 |
| D_VDD | 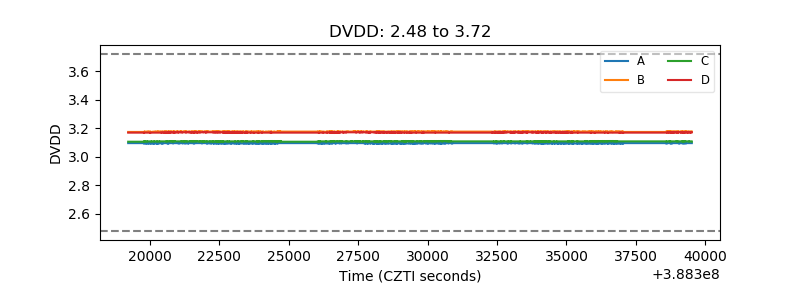 |
| Temperature 1 | 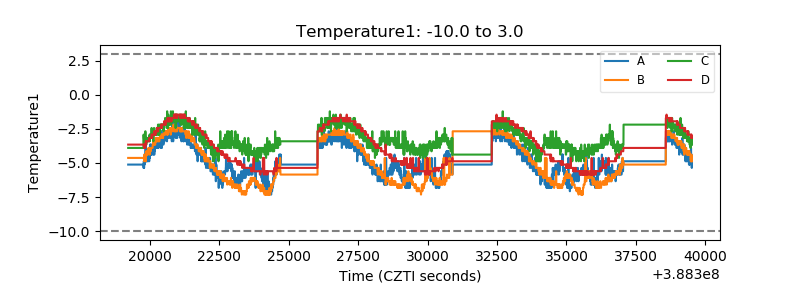 |
| Veto HV Monitor | 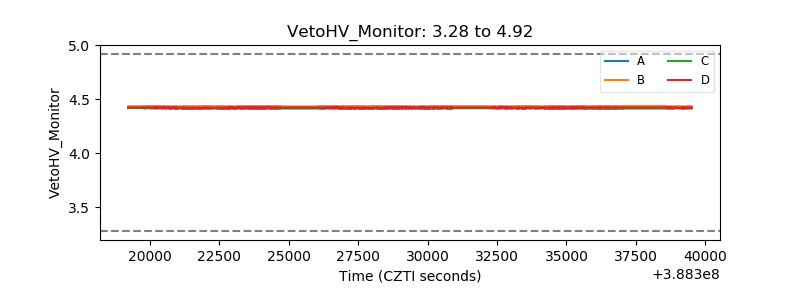 |
| Veto LLD | 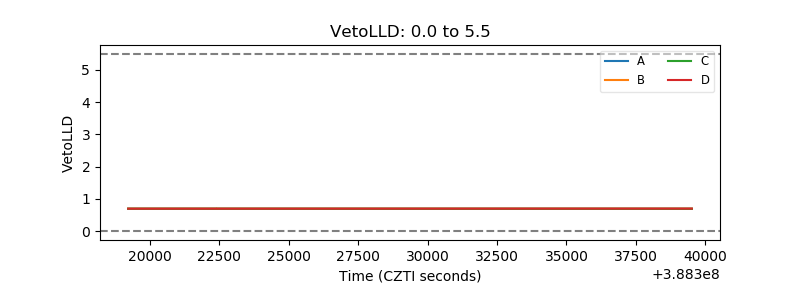 |
| Alpha Counter | 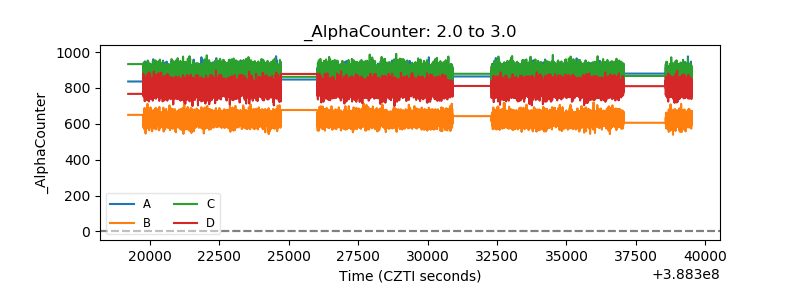 |
| _CPM_Rate | 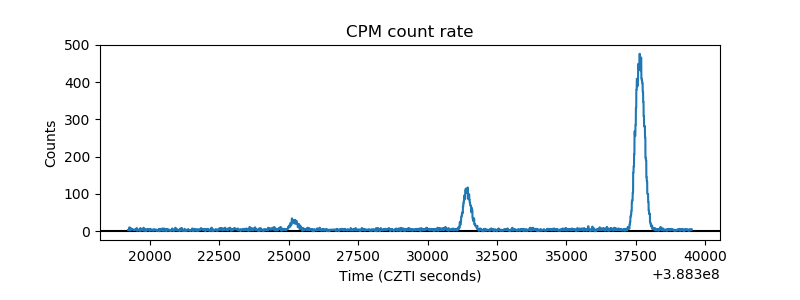 |
| CZT Counter | 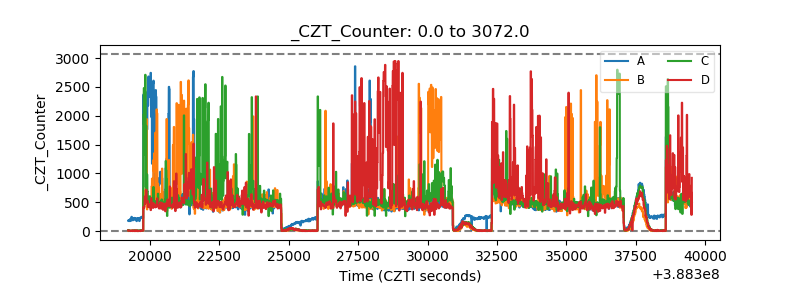 |
| +2.5 Volts monitor | 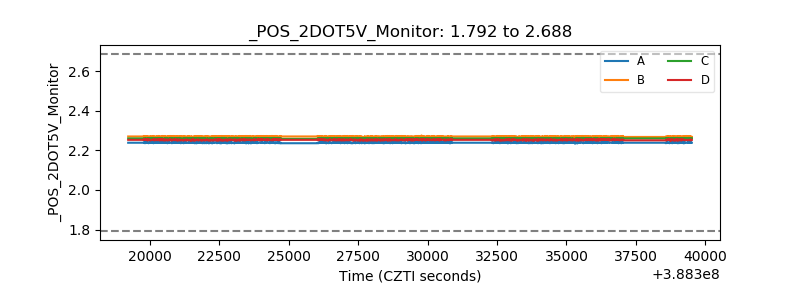 |
| +5 Volts monitor | 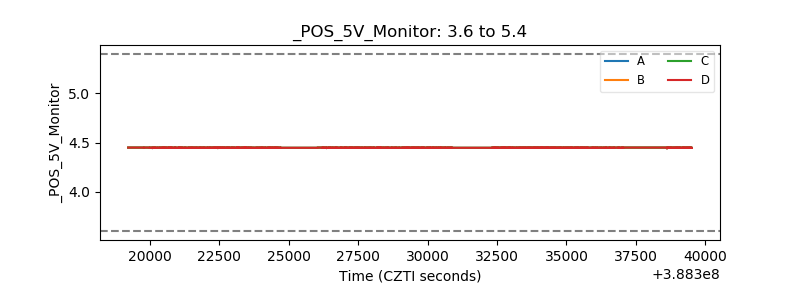 |
| _ROLL_ROT | 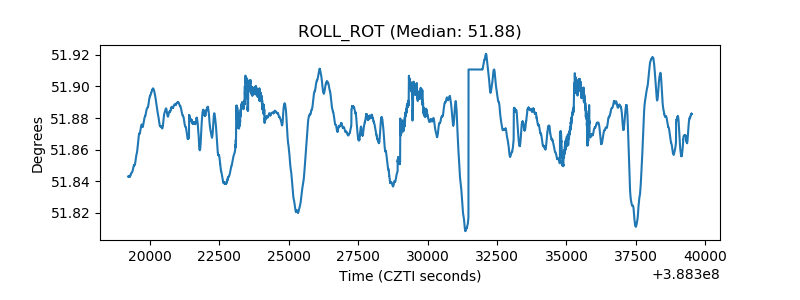 |
| _Roll_DEC | 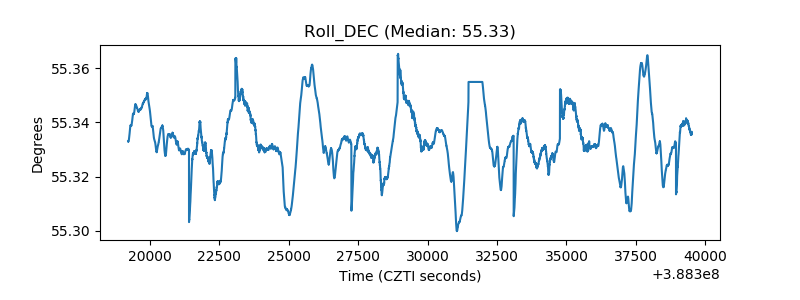 |
| _Roll_RA | 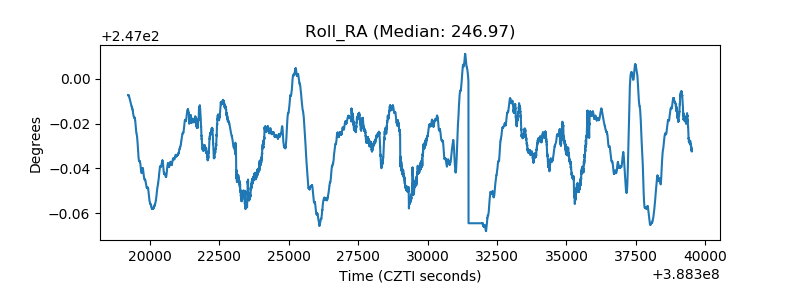 |
| Veto Counter | 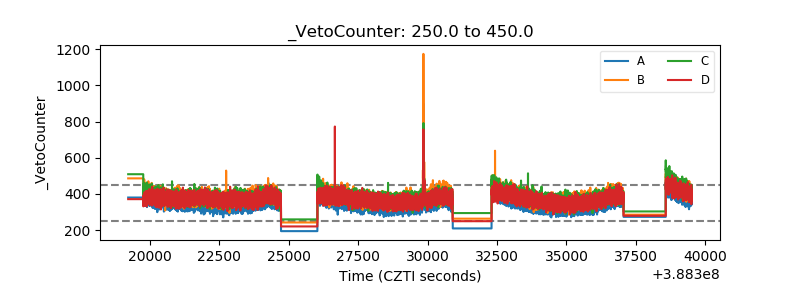 |