| Param | Original file | Final file |
|---|---|---|
| Filename | modeM0/AS1A11_097T22_9000005082_35499cztM0_level2.evt | modeM0/AS1A11_097T22_9000005082_35499cztM0_level2_quad_clean.evt |
| Size (bytes) | 671,952,960 | 56,128,320 |
| Size | 640.8 MB | 53.5 MB |
| Events in quadrant A | 8,220,327 | 138,444 |
| Events in quadrant B | 5,343,192 | 360,070 |
| Events in quadrant C | 3,195,027 | 403,467 |
| Events in quadrant D | 3,189,297 | 381,526 |
| Mode M9 | |||
|---|---|---|---|
| Quadrant | BADHDUFLAG | Total packets | Discarded packets |
| A | 0 | 21 | 0 |
| B | 0 | 21 | 0 |
| C | 0 | 21 | 0 |
| D | 0 | 22 | 0 |
| Mode M0 | |||
|---|---|---|---|
| Quadrant | BADHDUFLAG | Total packets | Discarded packets |
| A | 0 | 28421 | 3 |
| B | 0 | 19763 | 2 |
| C | 0 | 12903 | 2 |
| D | 0 | 13471 | 2 |
| Mode SS | |||
|---|---|---|---|
| Quadrant | BADHDUFLAG | Total packets | Discarded packets |
| A | 0 | 120 | 0 |
| B | 0 | 120 | 0 |
| C | 0 | 120 | 0 |
| D | 0 | 120 | 0 |
| Quadrant | Total seconds | Saturated seconds | Saturation percentage |
|---|---|---|---|
| A | 5933 | 3129 | 52.738918% |
| B | 5933 | 948 | 15.978426% |
| C | 5933 | 79 | 1.331535% |
| D | 5933 | 102 | 1.719198% |
Noise dominated data is calculated using 1-second bins in cleaned event files. If a bin has >2000 counts, and if more than 50% of those come from <1% of pixels, then it is considered to be noise-dominated and hence unusable.
| Quadrant | # 1 sec bins | Bins with >0 counts | Bins with >2000 counts | High rate bins dominated by noise | Noise dominated (total time) | Noise dominated (detector-on time) | Marked lightcurve |
|---|---|---|---|---|---|---|---|
| A | 7215 | 5934 | 1535 | 1535 | 21.28% | 25.87% | 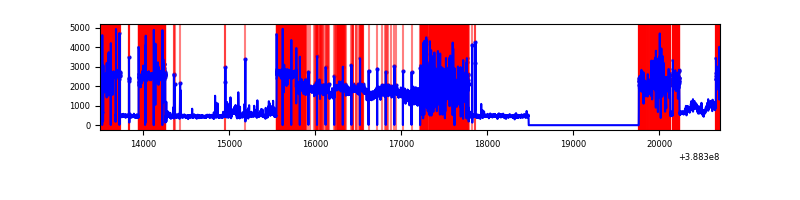 |
| B | 7215 | 5934 | 764 | 764 | 10.59% | 12.87% | 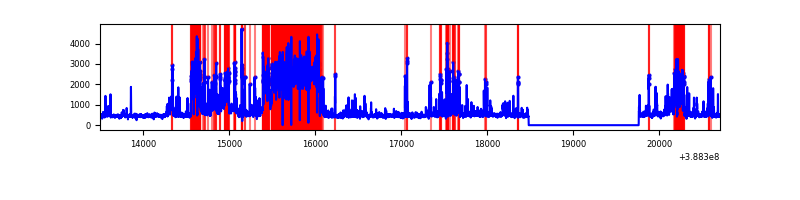 |
| C | 7215 | 5934 | 67 | 67 | 0.93% | 1.13% | 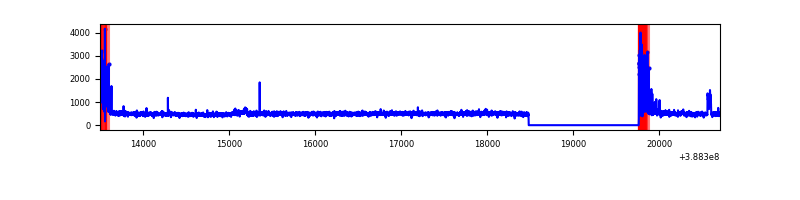 |
| D | 7215 | 5934 | 66 | 66 | 0.91% | 1.11% | 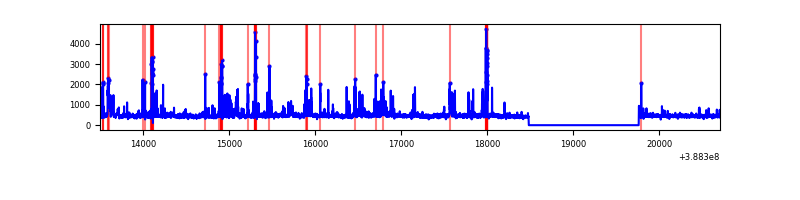 |
Top three noisy pixels from each quadrant. If the there are fewer than three noisy pixels in the level2.evt file, extra rows are filled as -1
| Pixel properties | Quadrant properties | ||||||
|---|---|---|---|---|---|---|---|
| Quadrant | DetID | PixID | Counts | Sigma | Mean | Median | Sigma |
| A | 15 | 169 | 6581186 | 81000.42 | 397 | 390 | 81.2 |
| A | 10 | 83 | 78916 | 966.55 | 397 | 390 | 81.2 |
| A | 2 | 79 | 13486 | 161.19 | 397 | 390 | 81.2 |
| B | 5 | 236 | 2461936 | 20644.02 | 617 | 600 | 119.2 |
| B | 5 | 172 | 368741 | 3087.72 | 617 | 600 | 119.2 |
| B | 4 | 232 | 22318 | 182.16 | 617 | 600 | 119.2 |
| C | 0 | 10 | 288744 | 1873.05 | 661 | 663 | 153.8 |
| C | 15 | 214 | 246581 | 1598.91 | 661 | 663 | 153.8 |
| C | 9 | 187 | 35962 | 229.51 | 661 | 663 | 153.8 |
| D | 7 | 80 | 271239 | 1692.91 | 656 | 638 | 159.8 |
| D | 13 | 249 | 134522 | 837.59 | 656 | 638 | 159.8 |
| D | 10 | 199 | 62262 | 385.53 | 656 | 638 | 159.8 |
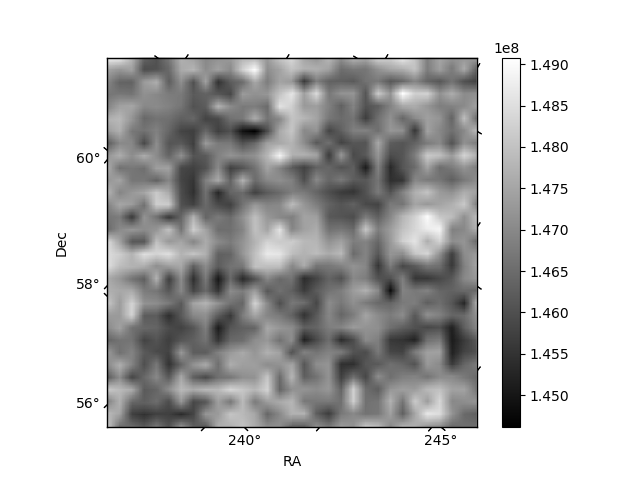
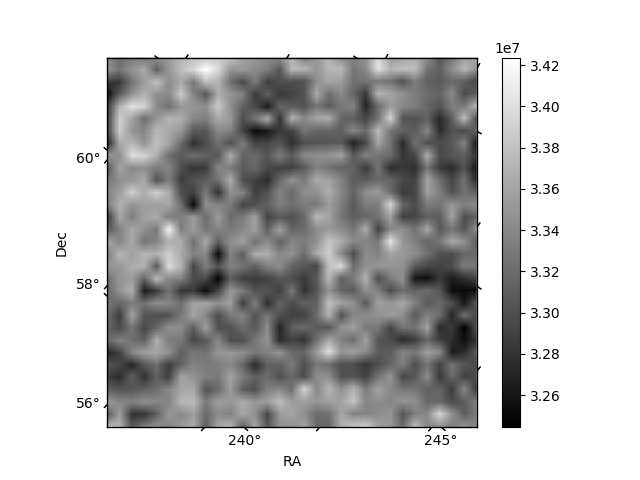
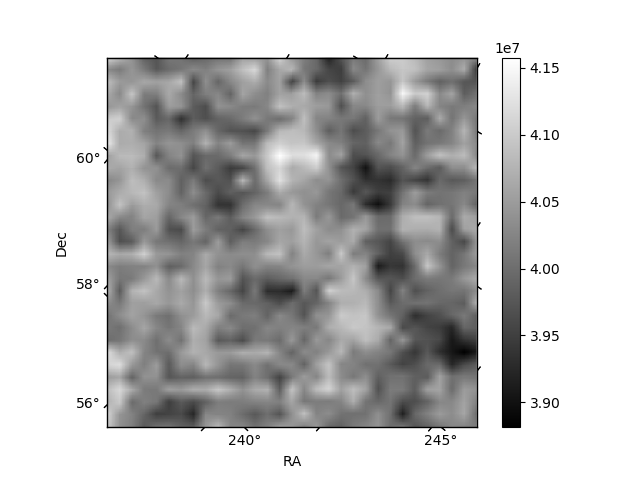
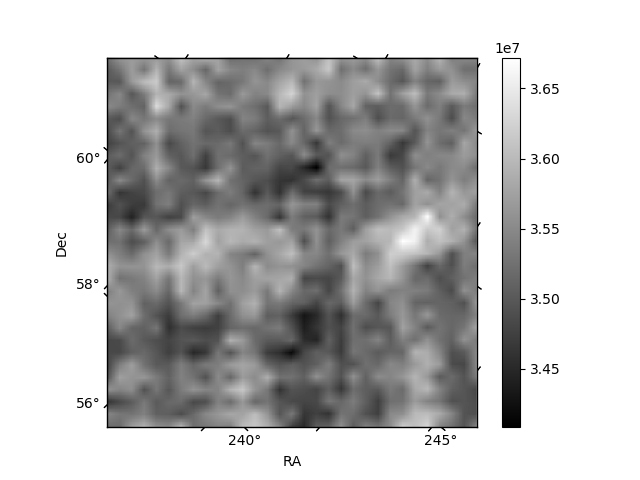
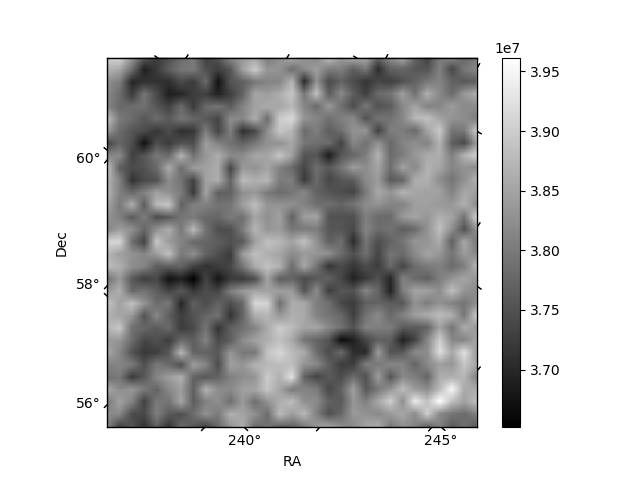
Histogram calculated using DETX and DETY for each event in the final _common_clean file
| Quadrant A | 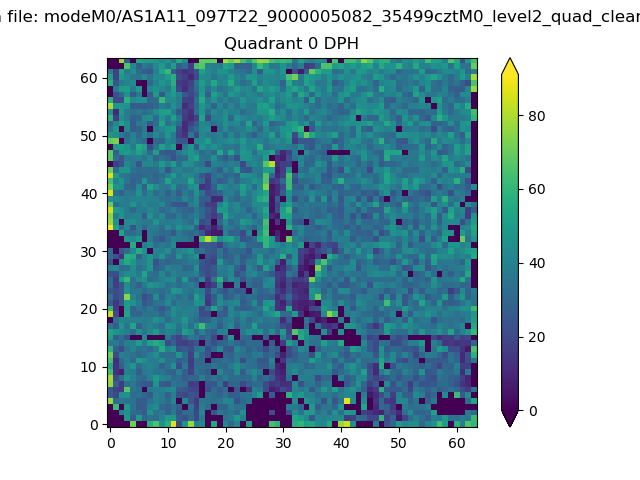 |
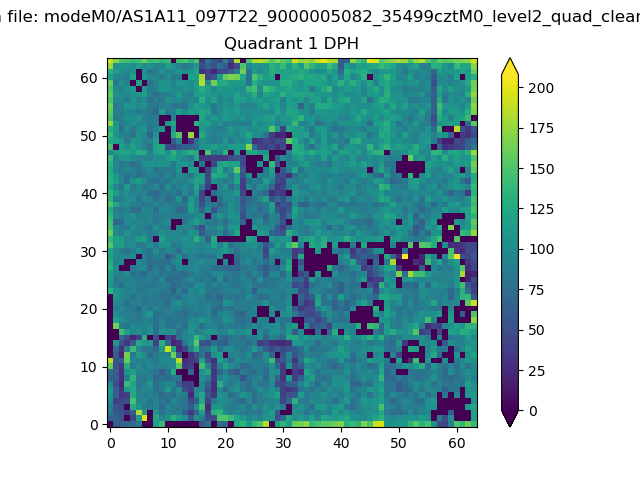 |
Quadrant B |
|---|---|---|---|
| Quadrant D |  |
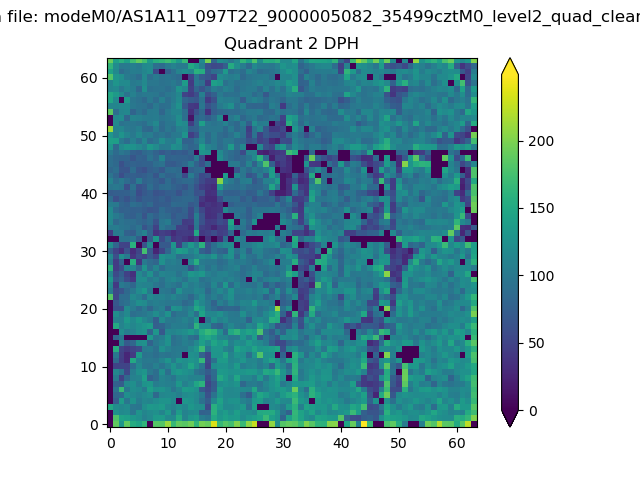 |
Quadrant C |
| Plot type | Count rate plots | Images |
|---|---|---|
| Comparison with Poisson distribution Blue bars denote a histogram of data divided into 1 sec bins. Red curve is a Poisson curve with rate = median count rate of data. |
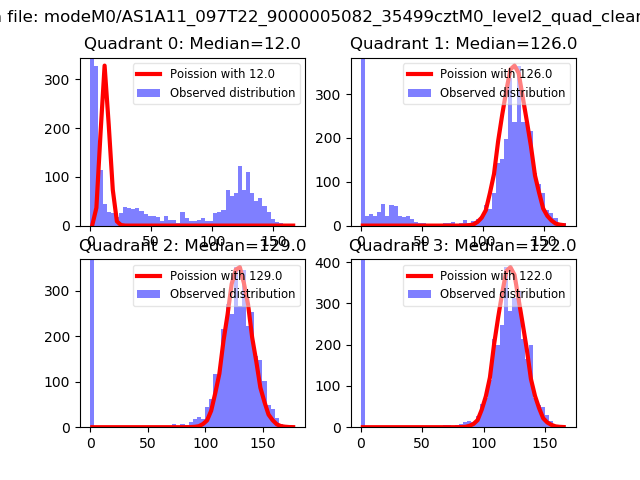 |
 |
| Quadrant-wise count rates Data is divided into 100 sec bins |
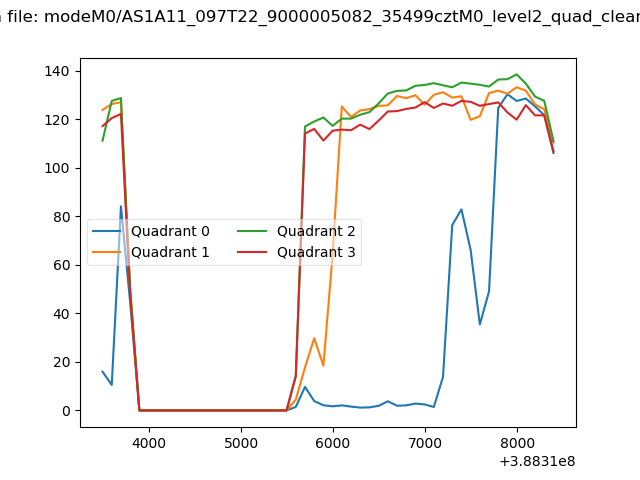 |
|
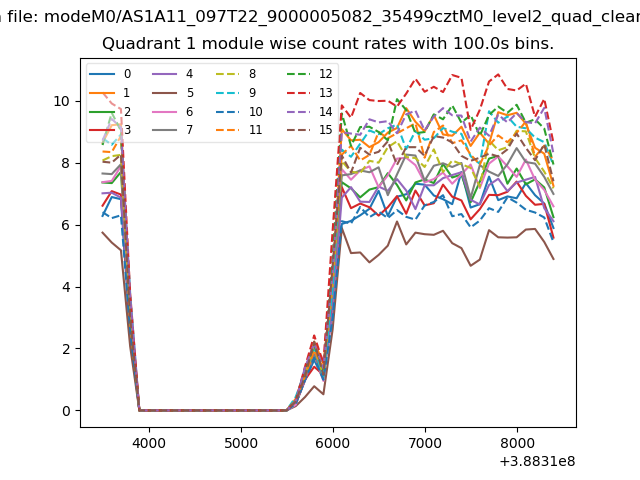
| Module-wise count rates for Quadrant A Data is divided into 100 sec bins |
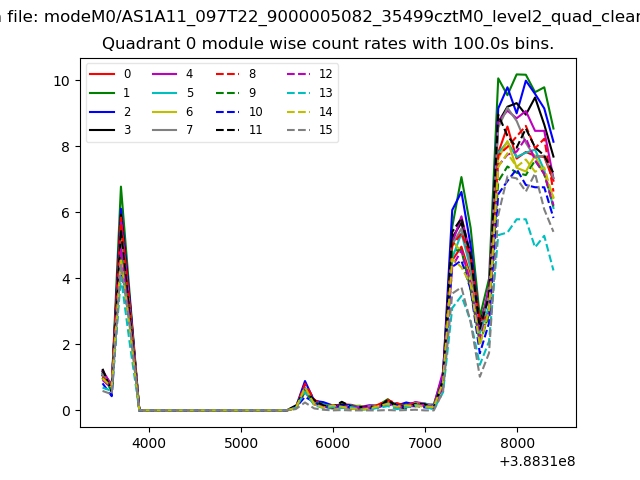 |
 |
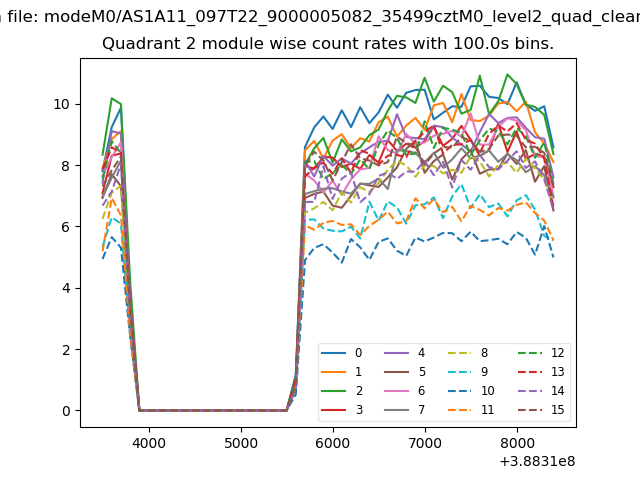
| Module-wise count rates for Quadrant B Data is divided into 100 sec bins |
 |
 |
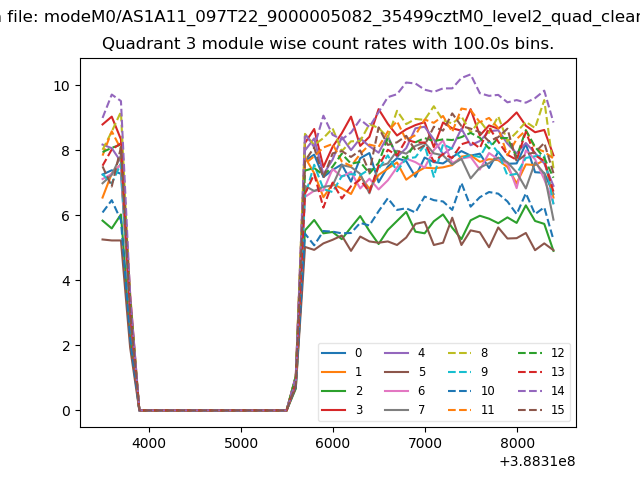
| Module-wise count rates for Quadrant C Data is divided into 100 sec bins |
 |
 |
| Module-wise count rates for Quadrant D Data is divided into 100 sec bins |
 |
 |
| Parameter | Plot |
|---|---|
| CZT HV Monitor | 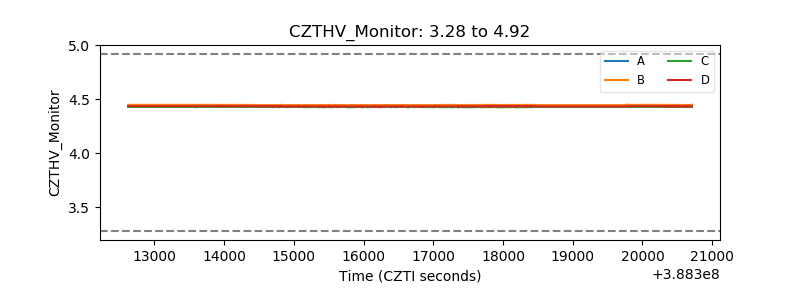 |
| D_VDD | 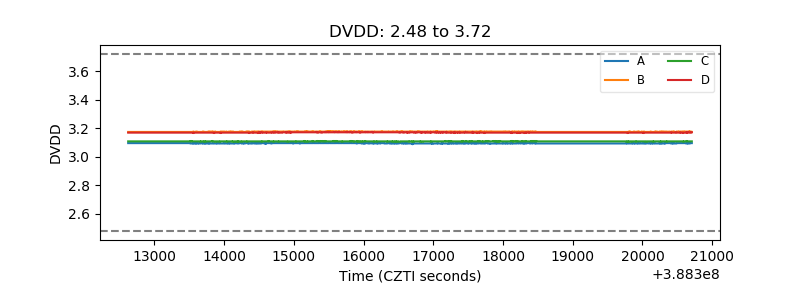 |
| Temperature 1 | 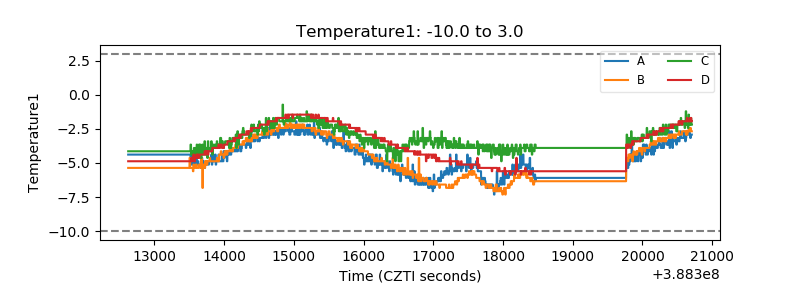 |
| Veto HV Monitor | 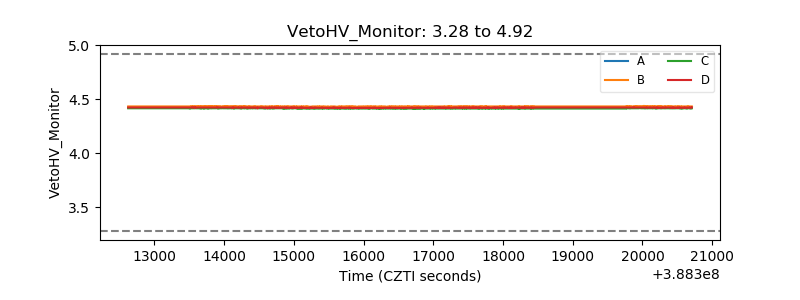 |
| Veto LLD | 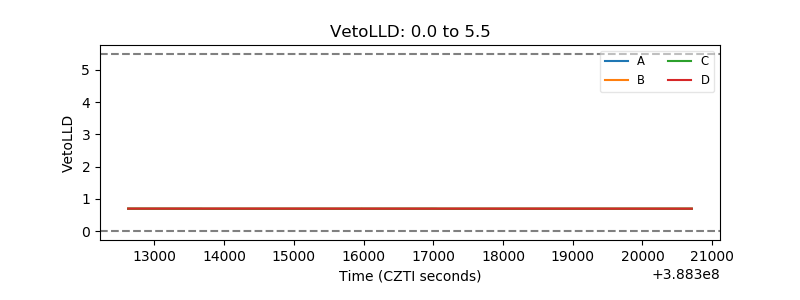 |
| Alpha Counter | 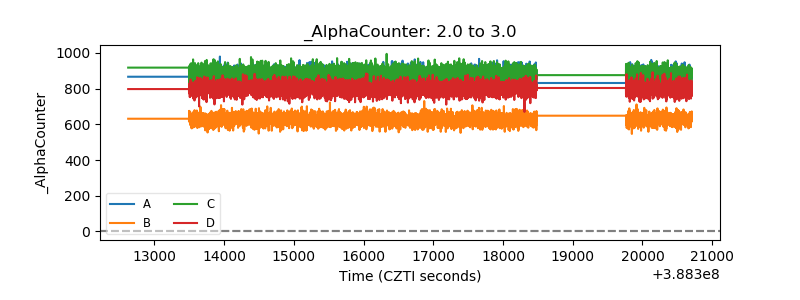 |
| _CPM_Rate | 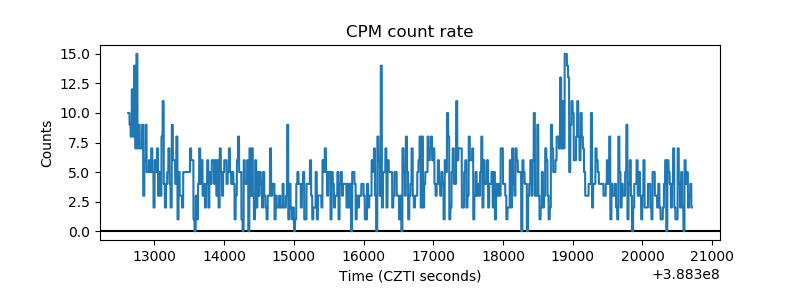 |
| CZT Counter | 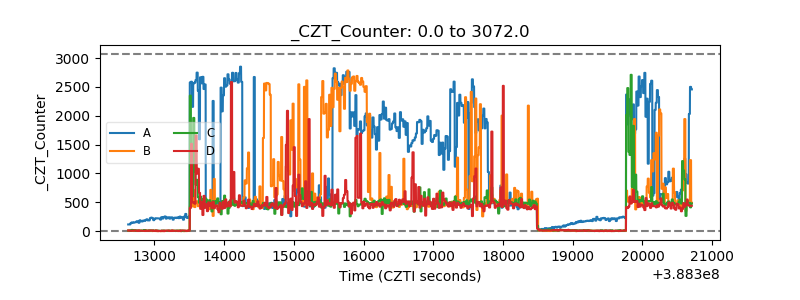 |
| +2.5 Volts monitor | 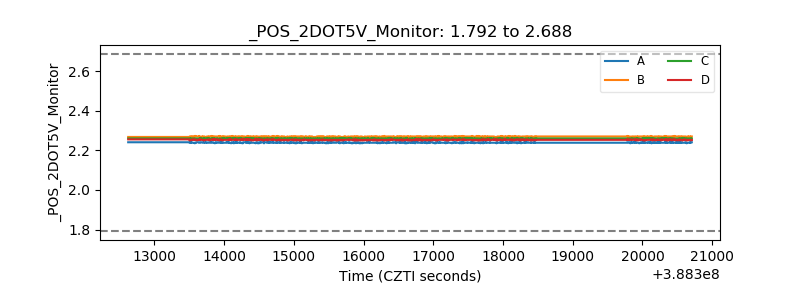 |
| +5 Volts monitor | 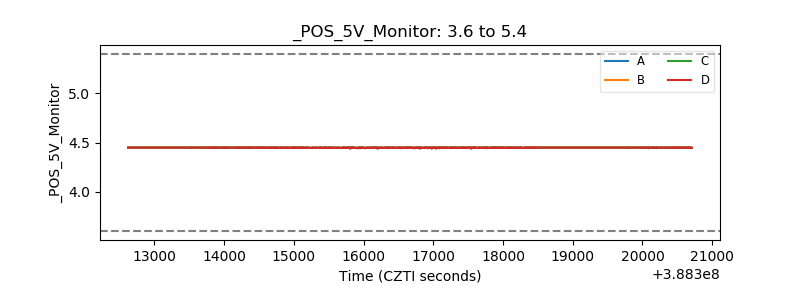 |
| _ROLL_ROT | 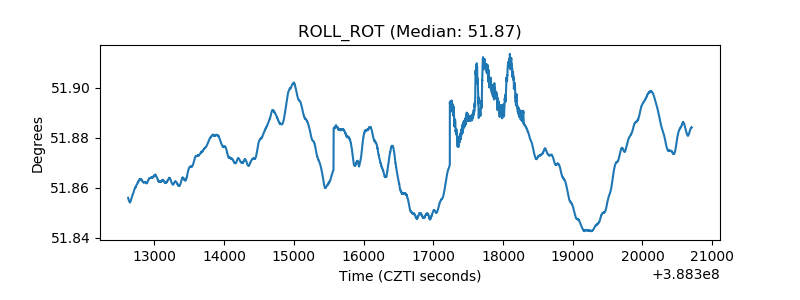 |
| _Roll_DEC | 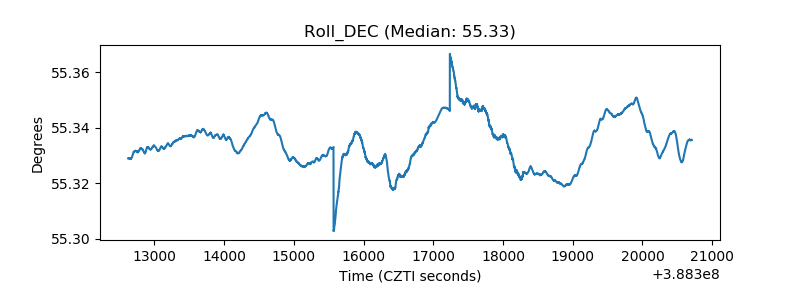 |
| _Roll_RA | 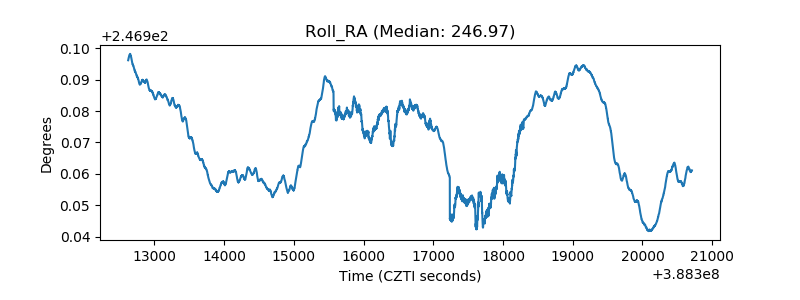 |
| Veto Counter | 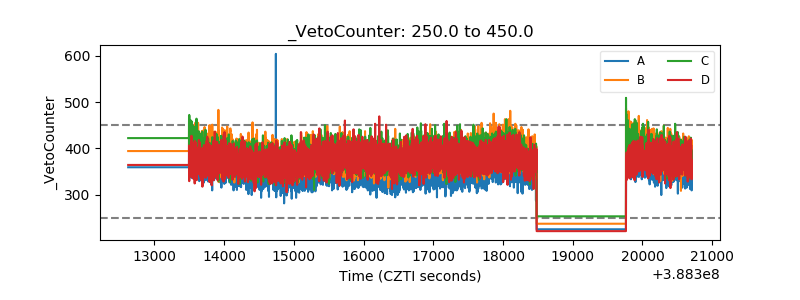 |