| Param | Original file | Final file |
|---|---|---|
| Filename | modeM0/AS1A11_097T22_9000005082_35495cztM0_level2.evt | modeM0/AS1A11_097T22_9000005082_35495cztM0_level2_quad_clean.evt |
| Size (bytes) | 519,727,680 | 69,926,400 |
| Size | 495.7 MB | 66.7 MB |
| Events in quadrant A | 5,257,670 | 418,512 |
| Events in quadrant B | 3,007,655 | 459,814 |
| Events in quadrant C | 3,782,810 | 449,956 |
| Events in quadrant D | 3,341,872 | 427,362 |
| Mode M9 | |||
|---|---|---|---|
| Quadrant | BADHDUFLAG | Total packets | Discarded packets |
| A | 0 | 29 | 0 |
| B | 0 | 29 | 0 |
| C | 0 | 29 | 0 |
| D | 0 | 30 | 0 |
| Mode M0 | |||
|---|---|---|---|
| Quadrant | BADHDUFLAG | Total packets | Discarded packets |
| A | 0 | 19090 | 3 |
| B | 0 | 12222 | 2 |
| C | 0 | 14473 | 2 |
| D | 0 | 13542 | 2 |
| Mode SS | |||
|---|---|---|---|
| Quadrant | BADHDUFLAG | Total packets | Discarded packets |
| A | 0 | 106 | 0 |
| B | 0 | 106 | 0 |
| C | 0 | 106 | 0 |
| D | 0 | 106 | 0 |
| Quadrant | Total seconds | Saturated seconds | Saturation percentage |
|---|---|---|---|
| A | 5158 | 1213 | 23.516867% |
| B | 5158 | 148 | 2.869329% |
| C | 5158 | 304 | 5.893757% |
| D | 5158 | 228 | 4.420318% |
Noise dominated data is calculated using 1-second bins in cleaned event files. If a bin has >2000 counts, and if more than 50% of those come from <1% of pixels, then it is considered to be noise-dominated and hence unusable.
| Quadrant | # 1 sec bins | Bins with >0 counts | Bins with >2000 counts | High rate bins dominated by noise | Noise dominated (total time) | Noise dominated (detector-on time) | Marked lightcurve |
|---|---|---|---|---|---|---|---|
| A | 7310 | 5159 | 1038 | 1038 | 14.20% | 20.12% | 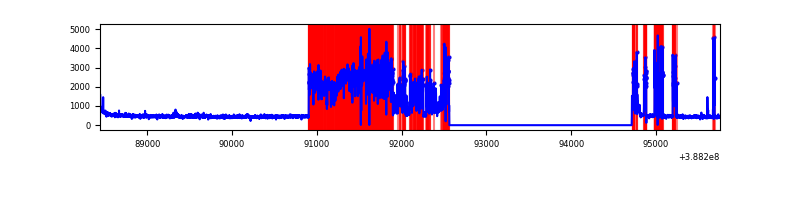 |
| B | 7310 | 5159 | 86 | 86 | 1.18% | 1.67% | 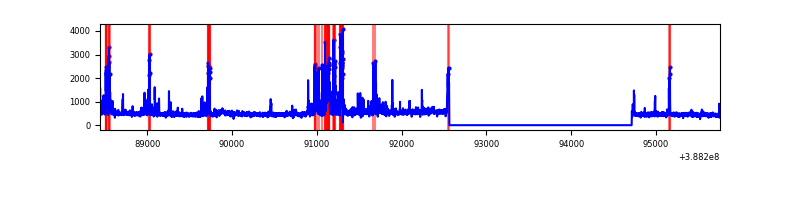 |
| C | 7310 | 5159 | 241 | 241 | 3.30% | 4.67% | 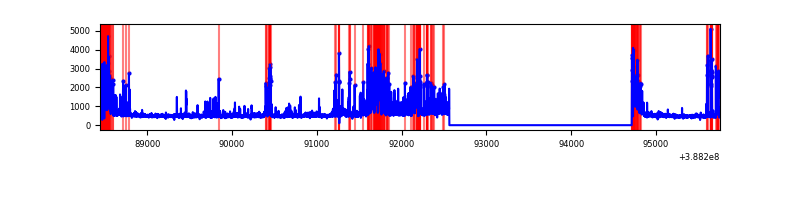 |
| D | 7310 | 5159 | 199 | 199 | 2.72% | 3.86% | 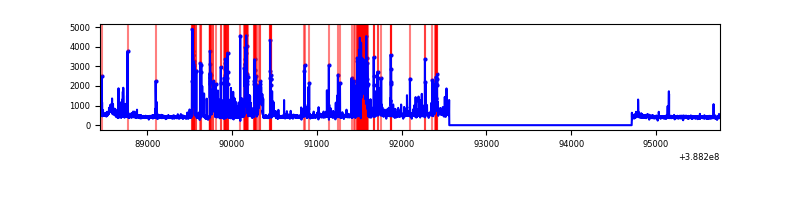 |
Top three noisy pixels from each quadrant. If the there are fewer than three noisy pixels in the level2.evt file, extra rows are filled as -1
| Pixel properties | Quadrant properties | ||||||
|---|---|---|---|---|---|---|---|
| Quadrant | DetID | PixID | Counts | Sigma | Mean | Median | Sigma |
| A | 15 | 169 | 3096698 | 29259.72 | 528 | 520 | 105.8 |
| A | 10 | 83 | 119284 | 1122.35 | 528 | 520 | 105.8 |
| A | 13 | 254 | 6585 | 57.32 | 528 | 520 | 105.8 |
| B | 5 | 172 | 466443 | 4154.79 | 595 | 580 | 112.1 |
| B | 5 | 236 | 104431 | 926.19 | 595 | 580 | 112.1 |
| B | 4 | 232 | 45520 | 400.8 | 595 | 580 | 112.1 |
| C | 0 | 10 | 653583 | 4990.39 | 571 | 577 | 130.9 |
| C | 9 | 69 | 468786 | 3578.14 | 571 | 577 | 130.9 |
| C | 15 | 214 | 213703 | 1628.75 | 571 | 577 | 130.9 |
| D | 7 | 80 | 903912 | 6637.24 | 567 | 552 | 136.1 |
| D | 12 | 233 | 59209 | 430.97 | 567 | 552 | 136.1 |
| D | 13 | 249 | 59180 | 430.76 | 567 | 552 | 136.1 |
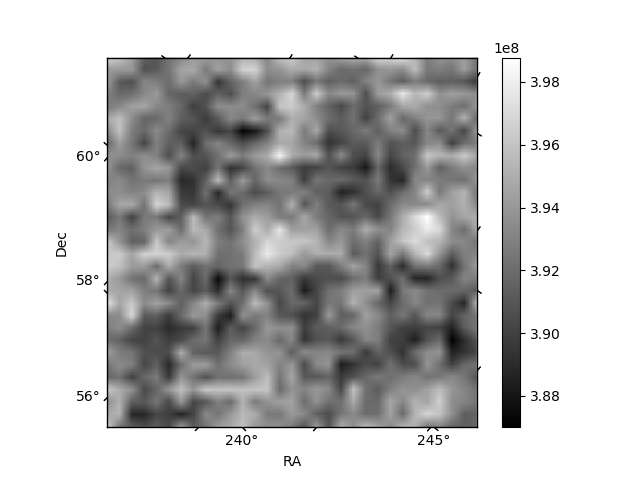
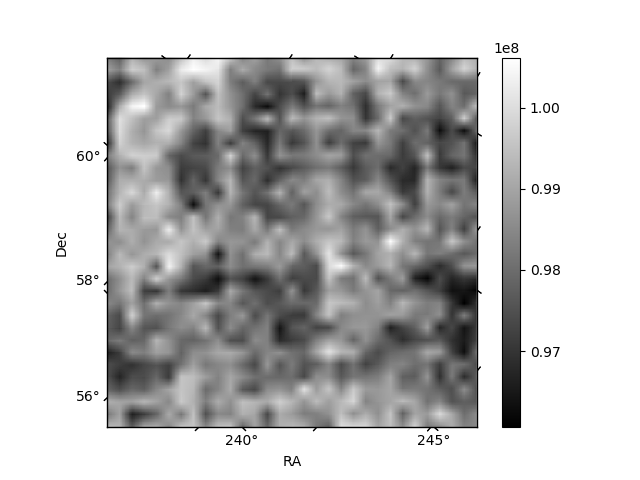
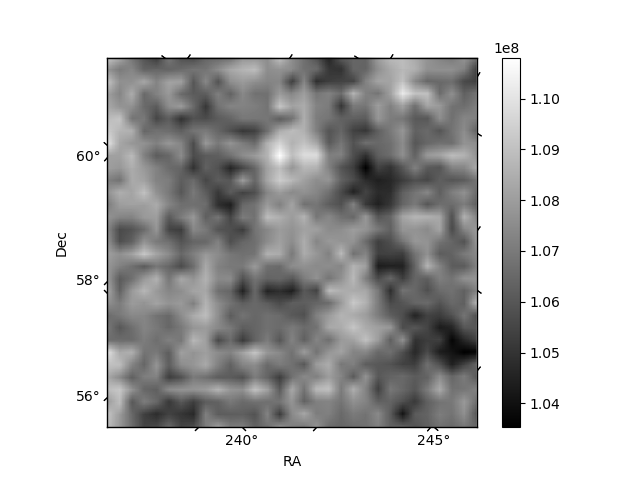
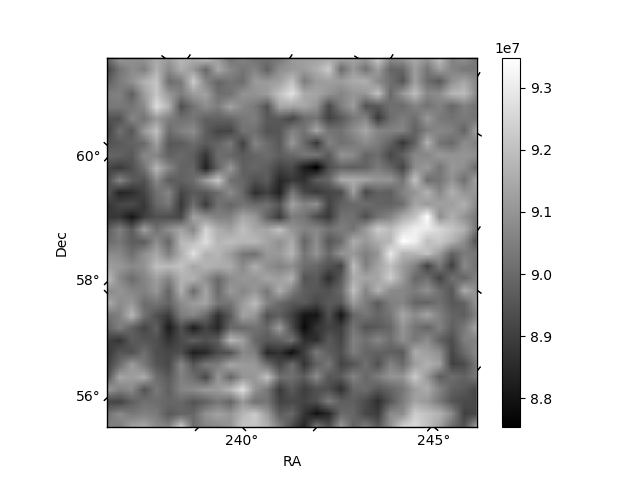
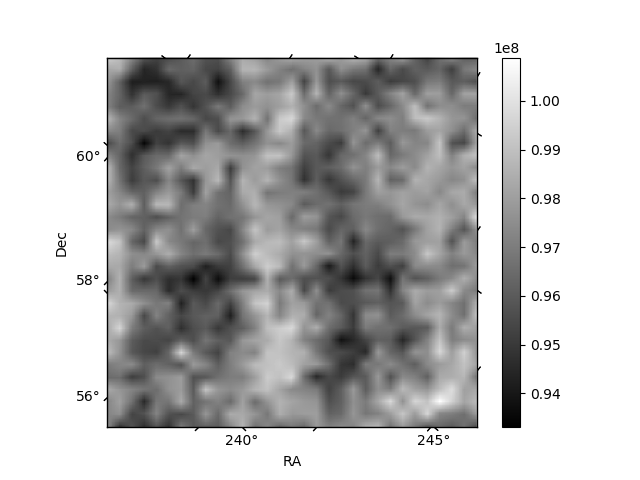
Histogram calculated using DETX and DETY for each event in the final _common_clean file
| Quadrant A | 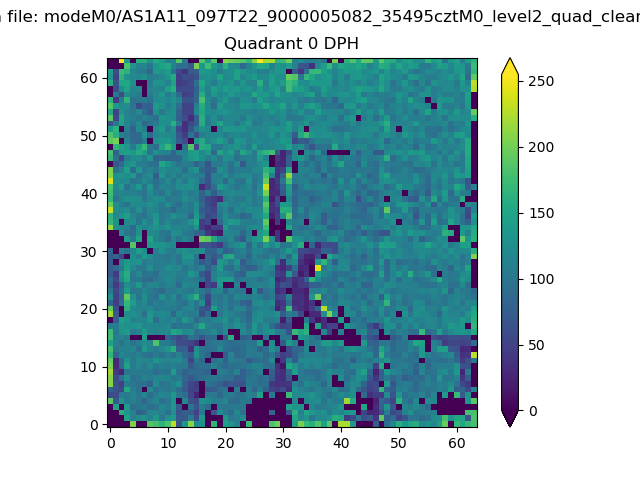 |
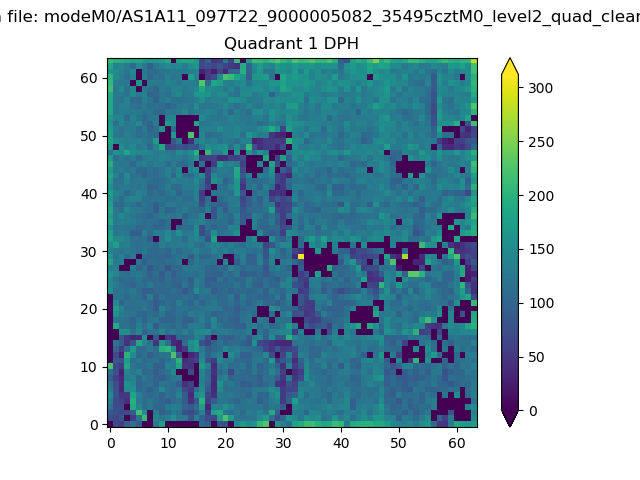 |
Quadrant B |
|---|---|---|---|
| Quadrant D | 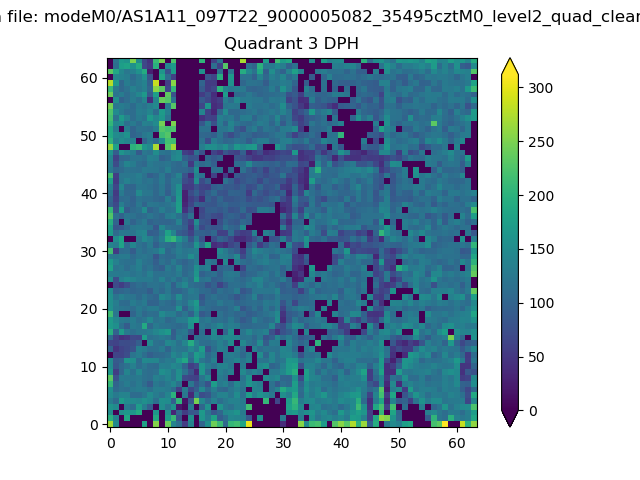 |
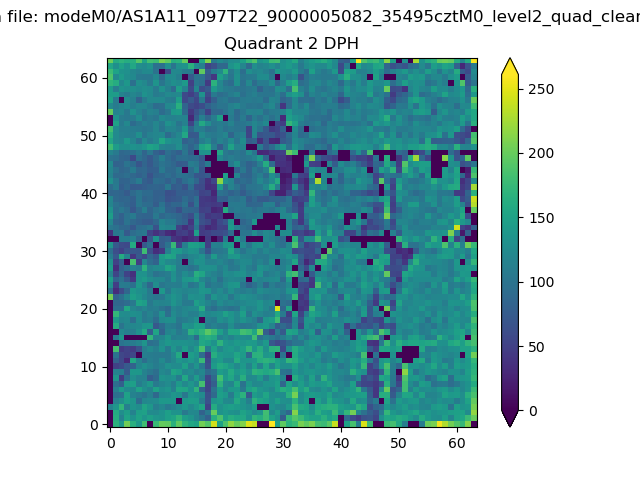 |
Quadrant C |
| Plot type | Count rate plots | Images |
|---|---|---|
| Comparison with Poisson distribution Blue bars denote a histogram of data divided into 1 sec bins. Red curve is a Poisson curve with rate = median count rate of data. |
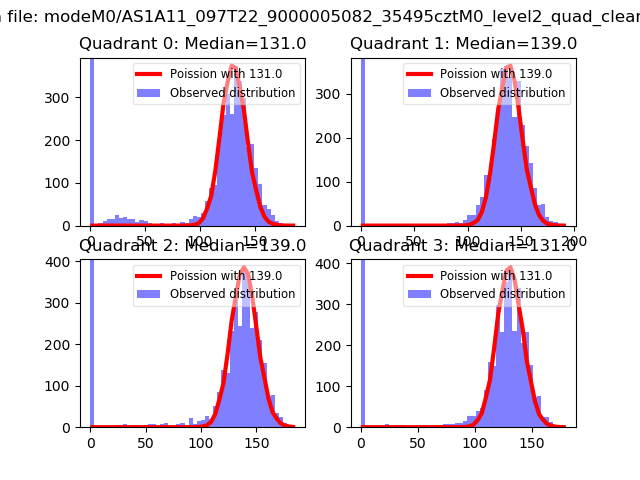 |
 |
| Quadrant-wise count rates Data is divided into 100 sec bins |
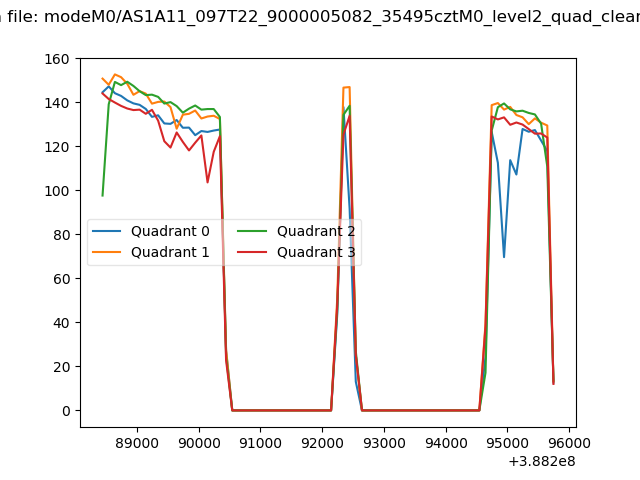 |
|
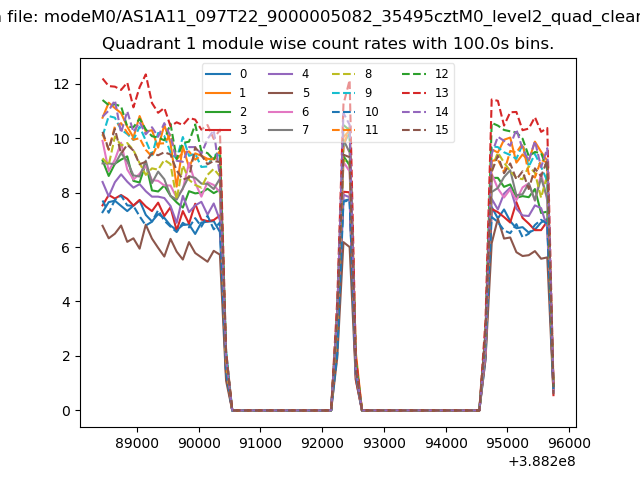
| Module-wise count rates for Quadrant A Data is divided into 100 sec bins |
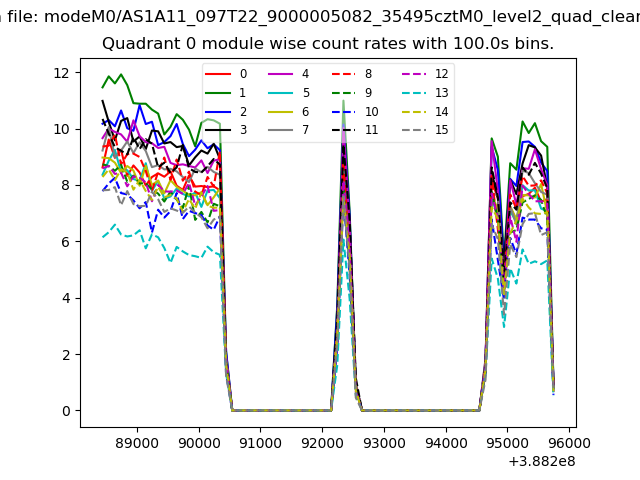 |
 |
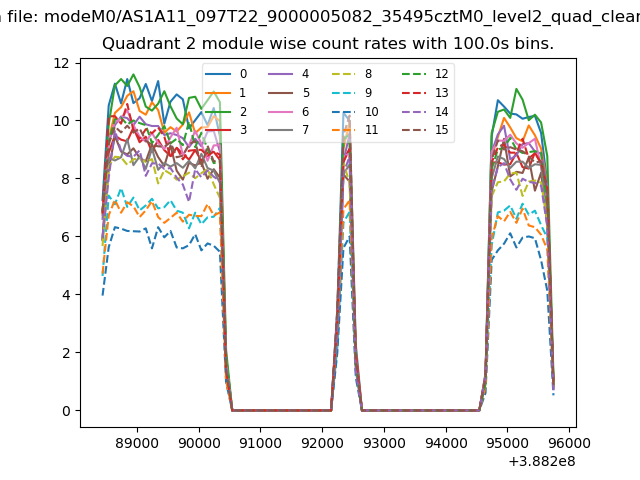
| Module-wise count rates for Quadrant B Data is divided into 100 sec bins |
 |
 |
| Module-wise count rates for Quadrant C Data is divided into 100 sec bins |
 |
 |
| Module-wise count rates for Quadrant D Data is divided into 100 sec bins |
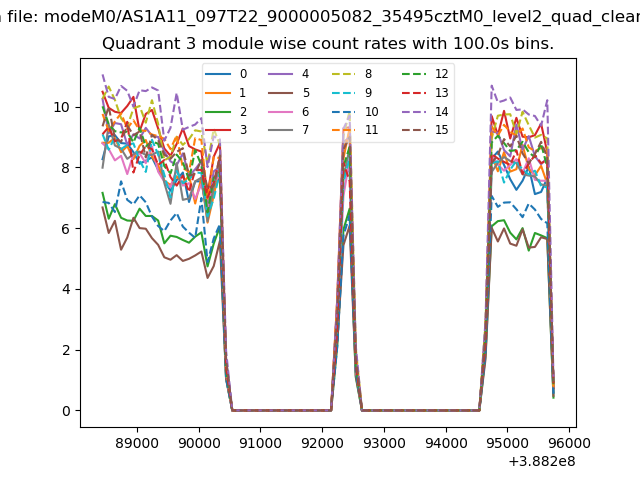 |
 |
| Parameter | Plot |
|---|---|
| CZT HV Monitor | 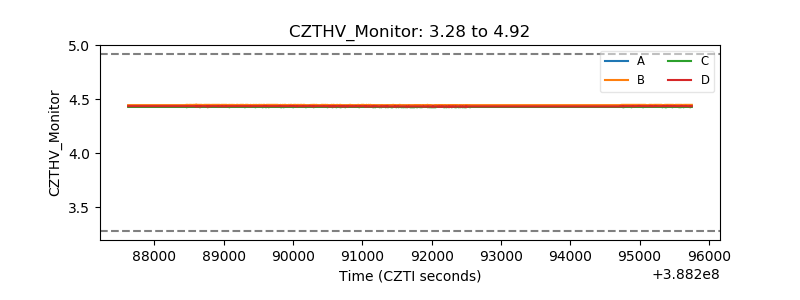 |
| D_VDD | 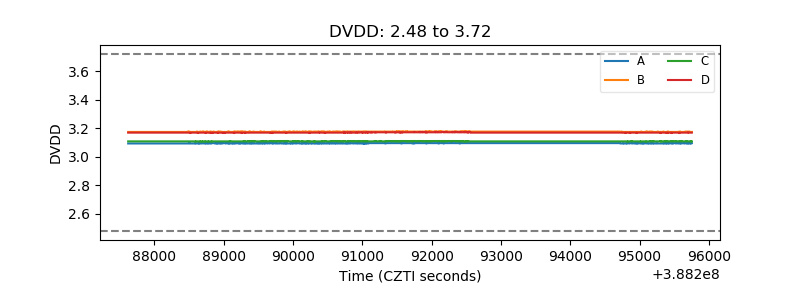 |
| Temperature 1 | 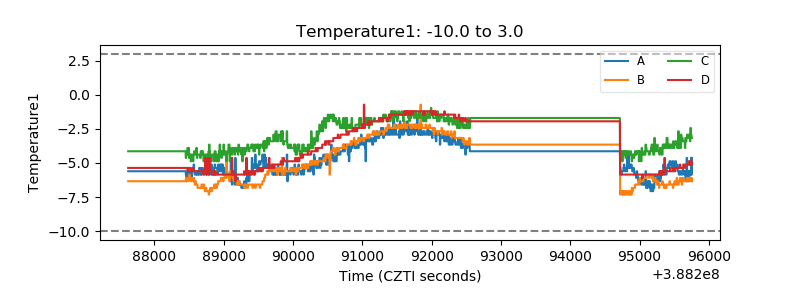 |
| Veto HV Monitor | 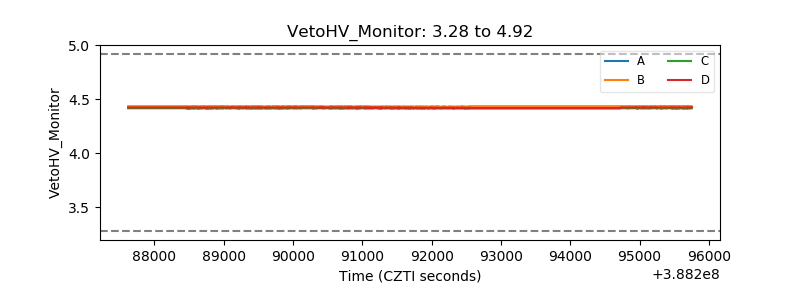 |
| Veto LLD | 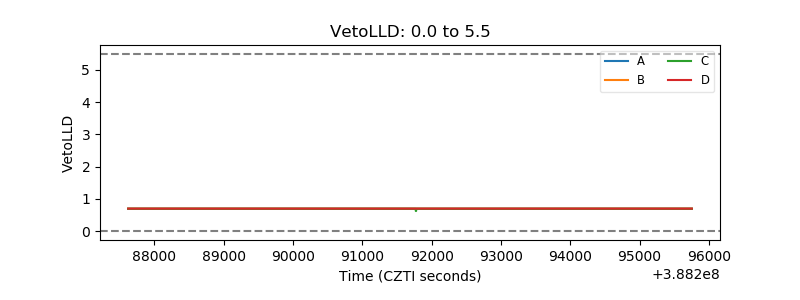 |
| Alpha Counter | 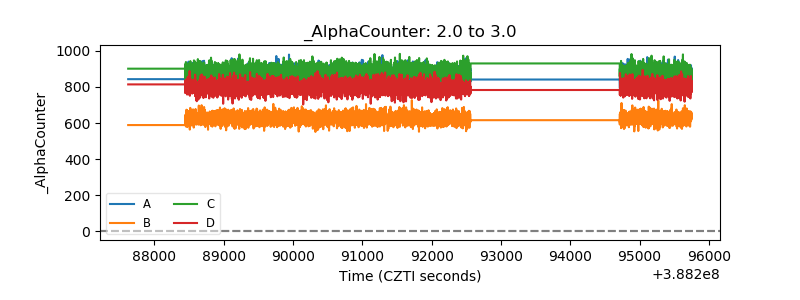 |
| _CPM_Rate | 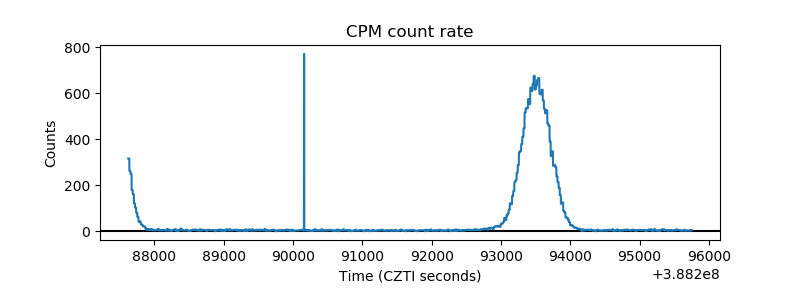 |
| CZT Counter | 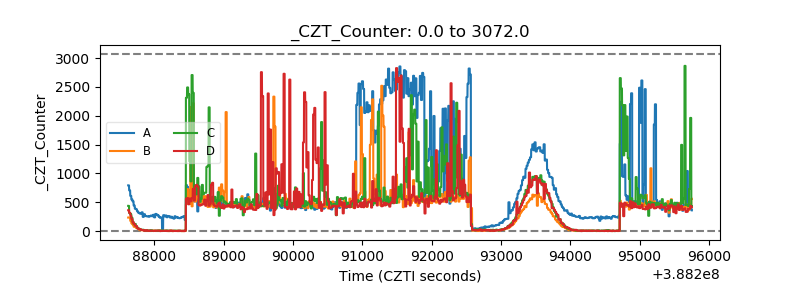 |
| +2.5 Volts monitor | 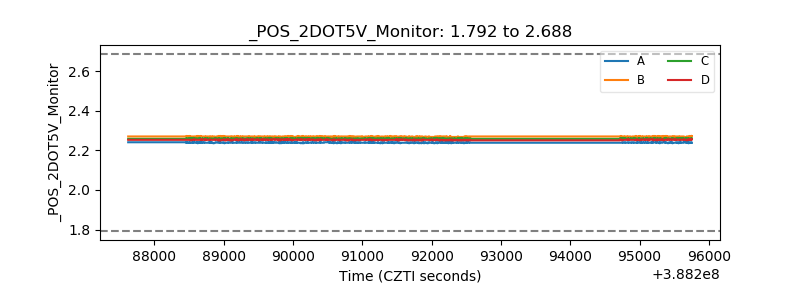 |
| +5 Volts monitor | 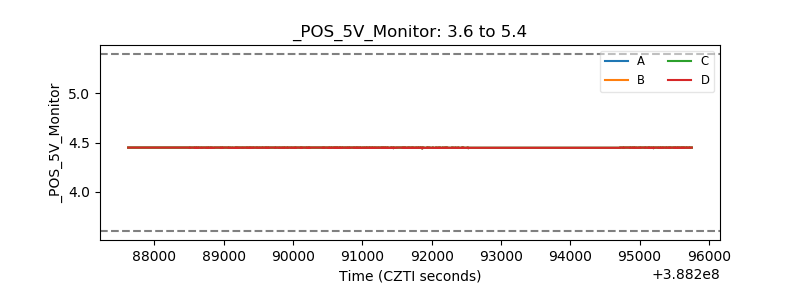 |
| _ROLL_ROT | 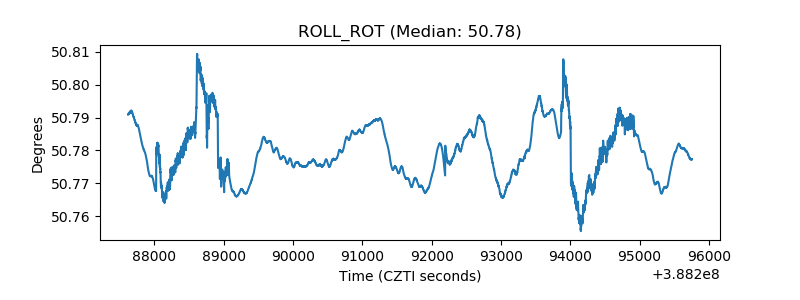 |
| _Roll_DEC | 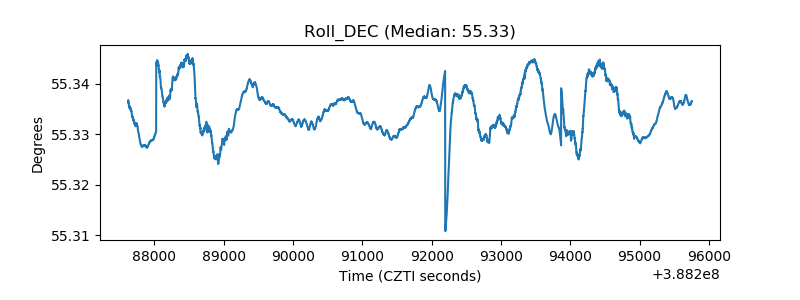 |
| _Roll_RA | 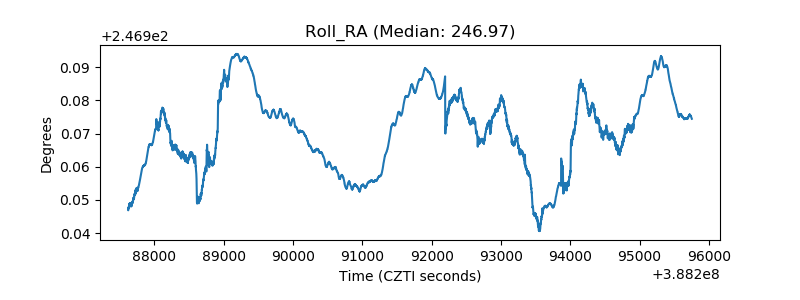 |
| Veto Counter | 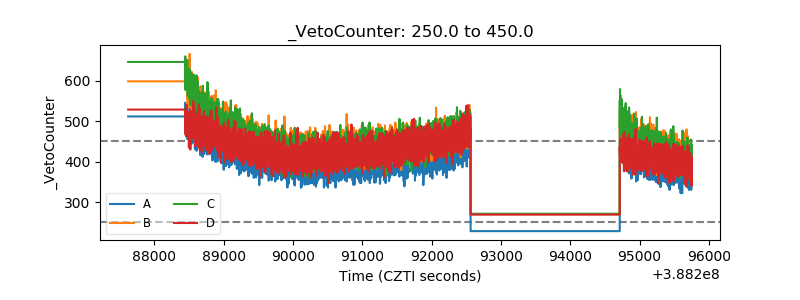 |