| Param | Original file | Final file |
|---|---|---|
| Filename | modeM0/AS1A11_097T22_9000005082_35491cztM0_level2.evt | modeM0/AS1A11_097T22_9000005082_35491cztM0_level2_quad_clean.evt |
| Size (bytes) | 547,747,200 | 91,892,160 |
| Size | 522.4 MB | 87.6 MB |
| Events in quadrant A | 2,722,282 | 600,662 |
| Events in quadrant B | 6,551,234 | 579,444 |
| Events in quadrant C | 3,545,746 | 628,761 |
| Events in quadrant D | 3,396,999 | 589,074 |
| Mode M9 | |||
|---|---|---|---|
| Quadrant | BADHDUFLAG | Total packets | Discarded packets |
| A | 0 | 36 | 0 |
| B | 0 | 36 | 0 |
| C | 0 | 36 | 0 |
| D | 0 | 36 | 0 |
| Mode M0 | |||
|---|---|---|---|
| Quadrant | BADHDUFLAG | Total packets | Discarded packets |
| A | 0 | 11671 | 3 |
| B | 0 | 23304 | 2 |
| C | 0 | 14050 | 2 |
| D | 0 | 13910 | 2 |
| Mode SS | |||
|---|---|---|---|
| Quadrant | BADHDUFLAG | Total packets | Discarded packets |
| A | 0 | 112 | 0 |
| B | 0 | 112 | 0 |
| C | 0 | 112 | 0 |
| D | 0 | 112 | 0 |
| Quadrant | Total seconds | Saturated seconds | Saturation percentage |
|---|---|---|---|
| A | 5502 | 13 | 0.236278% |
| B | 5502 | 1114 | 20.247183% |
| C | 5502 | 151 | 2.744457% |
| D | 5502 | 157 | 2.853508% |
Noise dominated data is calculated using 1-second bins in cleaned event files. If a bin has >2000 counts, and if more than 50% of those come from <1% of pixels, then it is considered to be noise-dominated and hence unusable.
| Quadrant | # 1 sec bins | Bins with >0 counts | Bins with >2000 counts | High rate bins dominated by noise | Noise dominated (total time) | Noise dominated (detector-on time) | Marked lightcurve |
|---|---|---|---|---|---|---|---|
| A | 9057 | 5504 | 2 | 2 | 0.02% | 0.04% | 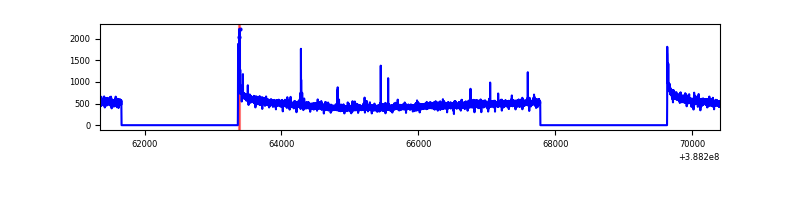 |
| B | 9057 | 5504 | 741 | 741 | 8.18% | 13.46% | 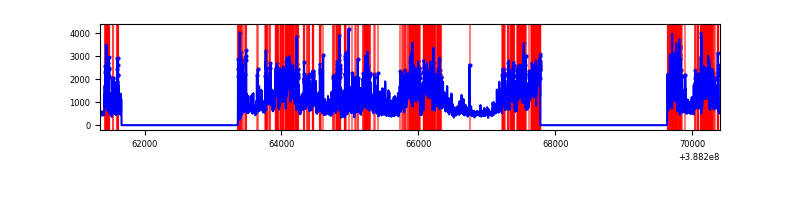 |
| C | 9057 | 5504 | 113 | 113 | 1.25% | 2.05% | 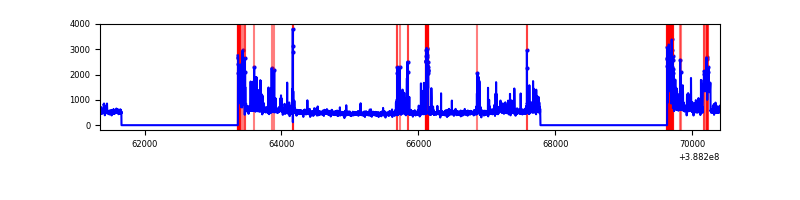 |
| D | 9057 | 5504 | 135 | 135 | 1.49% | 2.45% | 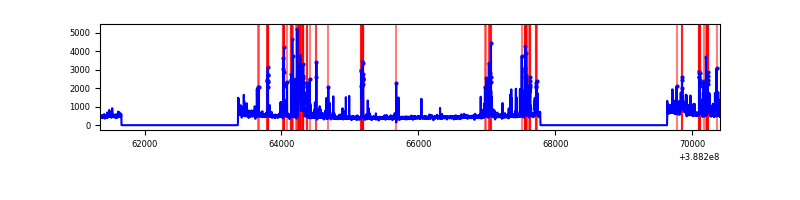 |
Top three noisy pixels from each quadrant. If the there are fewer than three noisy pixels in the level2.evt file, extra rows are filled as -1
| Pixel properties | Quadrant properties | ||||||
|---|---|---|---|---|---|---|---|
| Quadrant | DetID | PixID | Counts | Sigma | Mean | Median | Sigma |
| A | 10 | 83 | 132195 | 1016.31 | 644 | 632 | 129.5 |
| A | 15 | 169 | 69982 | 535.72 | 644 | 632 | 129.5 |
| A | 9 | 143 | 26809 | 202.22 | 644 | 632 | 129.5 |
| B | 4 | 171 | 3553466 | 30907.34 | 613 | 599 | 115.0 |
| B | 5 | 172 | 236530 | 2052.43 | 613 | 599 | 115.0 |
| B | 5 | 236 | 156425 | 1355.57 | 613 | 599 | 115.0 |
| C | 0 | 207 | 377690 | 2560.08 | 641 | 646 | 147.3 |
| C | 0 | 10 | 272525 | 1846.02 | 641 | 646 | 147.3 |
| C | 15 | 214 | 225612 | 1527.49 | 641 | 646 | 147.3 |
| D | 13 | 249 | 364908 | 2406.55 | 632 | 616 | 151.4 |
| D | 7 | 80 | 237638 | 1565.79 | 632 | 616 | 151.4 |
| D | 8 | 195 | 115600 | 759.59 | 632 | 616 | 151.4 |
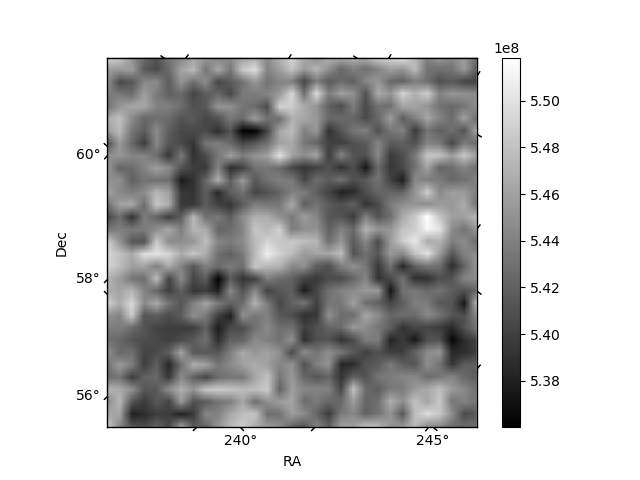
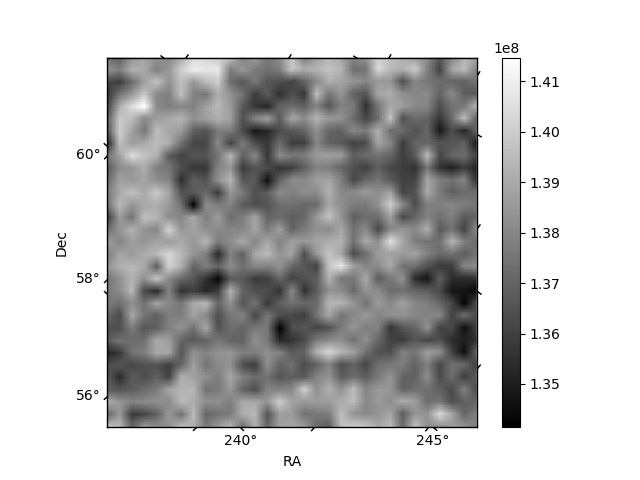
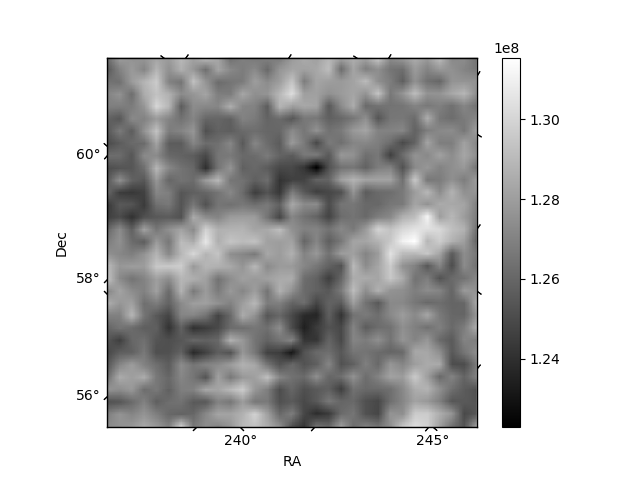
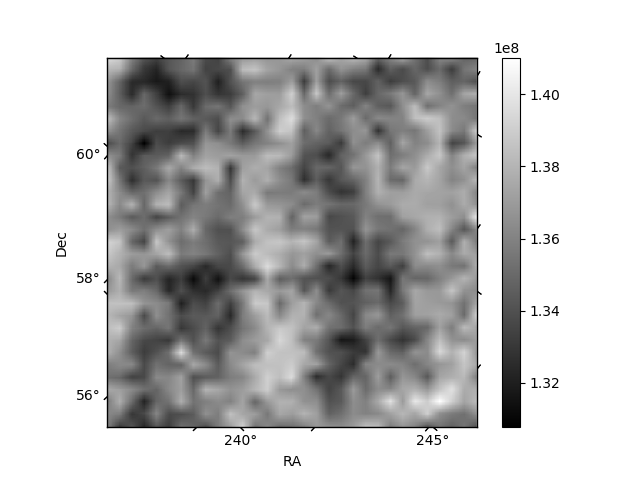
Histogram calculated using DETX and DETY for each event in the final _common_clean file
| Quadrant A | 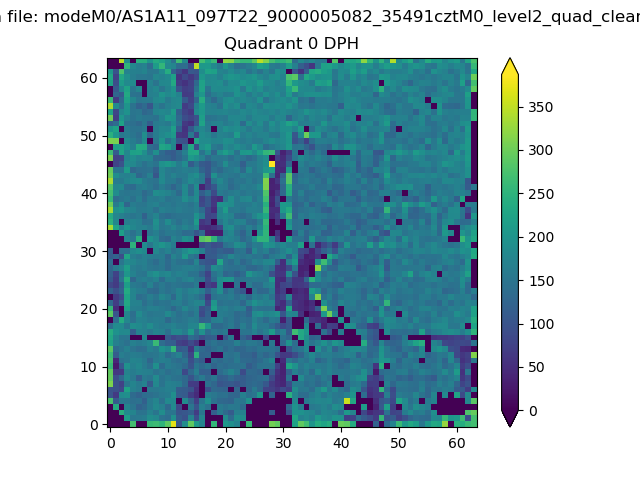 |
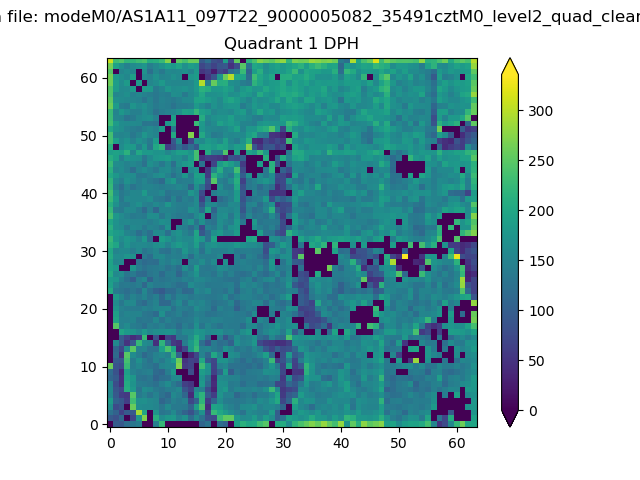 |
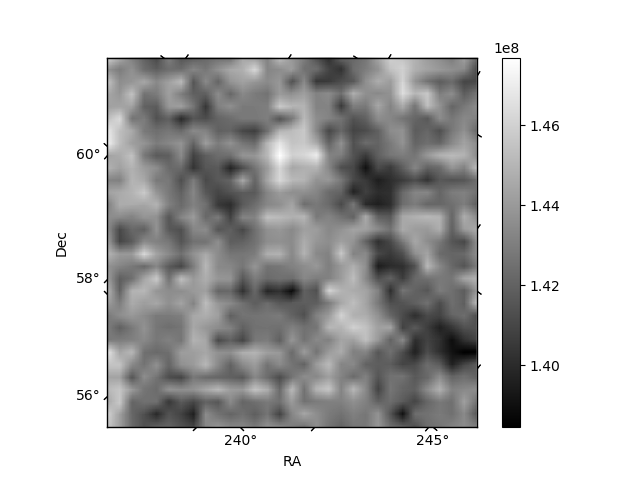
Quadrant B |
|---|---|---|---|
| Quadrant D | 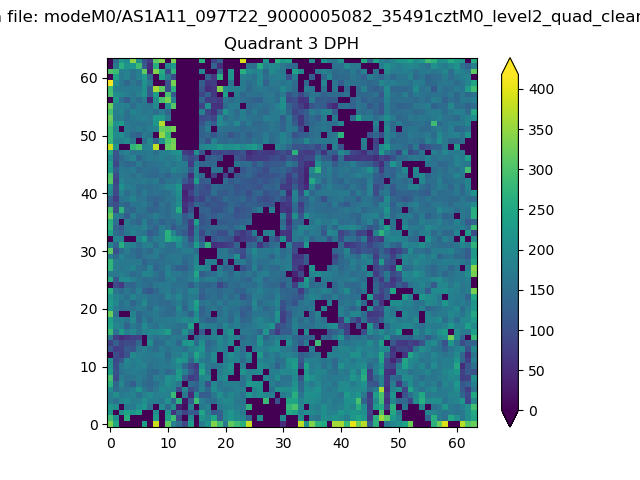 |
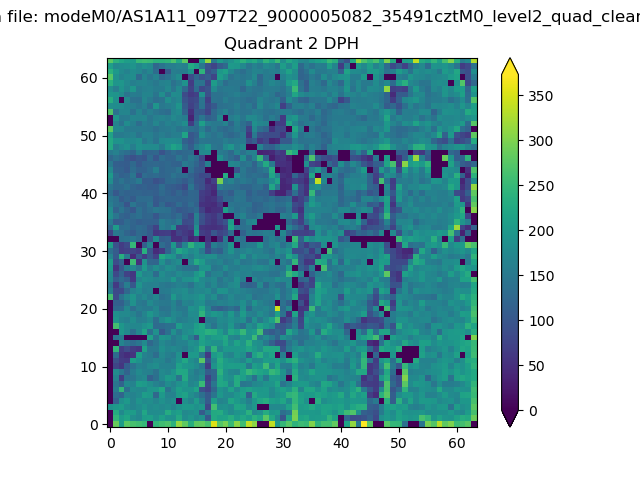 |
Quadrant C |
| Plot type | Count rate plots | Images |
|---|---|---|
| Comparison with Poisson distribution Blue bars denote a histogram of data divided into 1 sec bins. Red curve is a Poisson curve with rate = median count rate of data. |
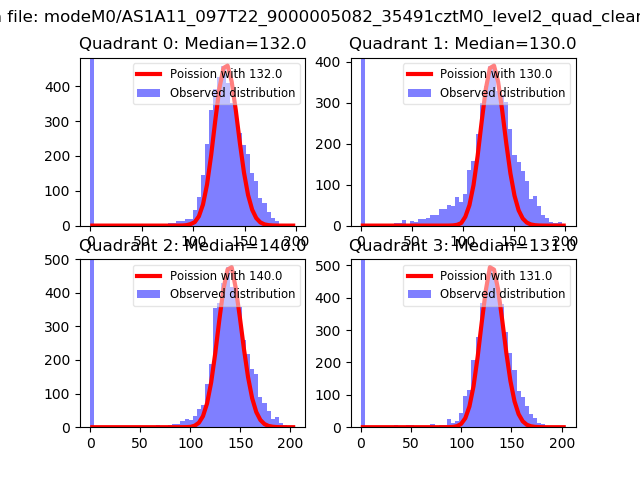 |
 |
| Quadrant-wise count rates Data is divided into 100 sec bins |
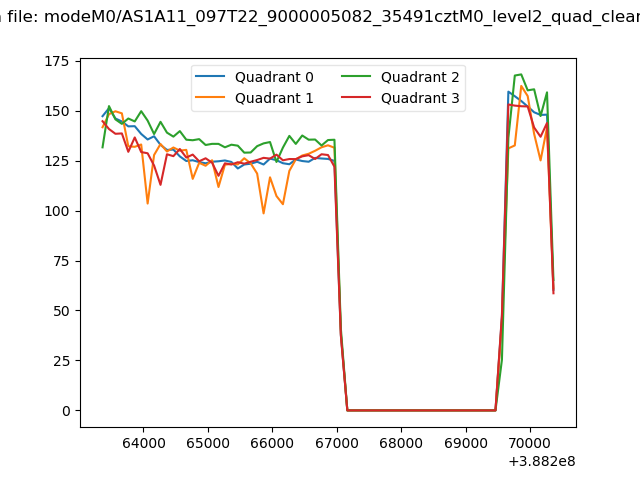 |
|
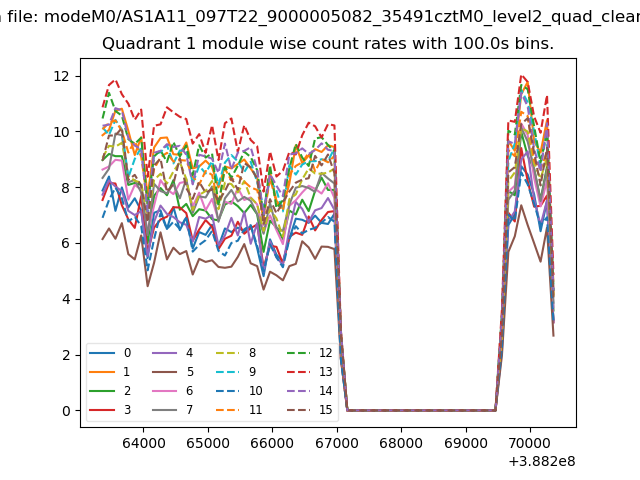
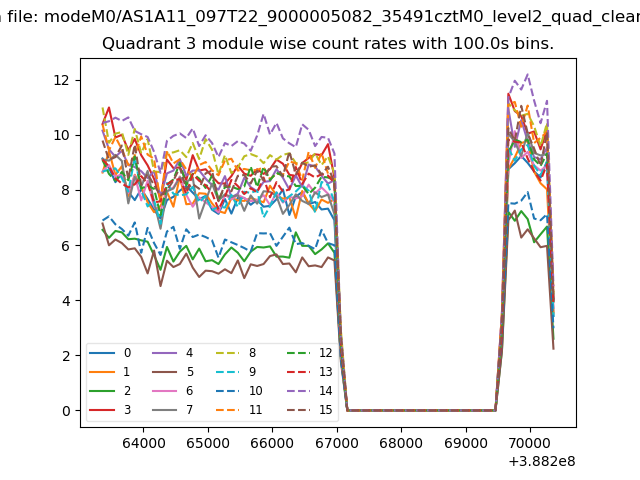
| Module-wise count rates for Quadrant A Data is divided into 100 sec bins |
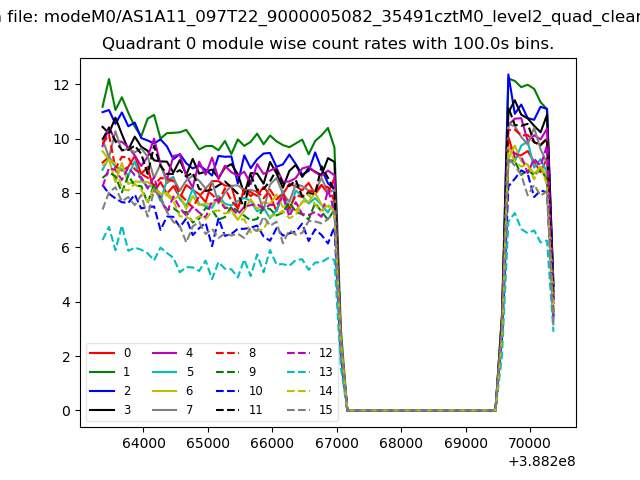 |
 |
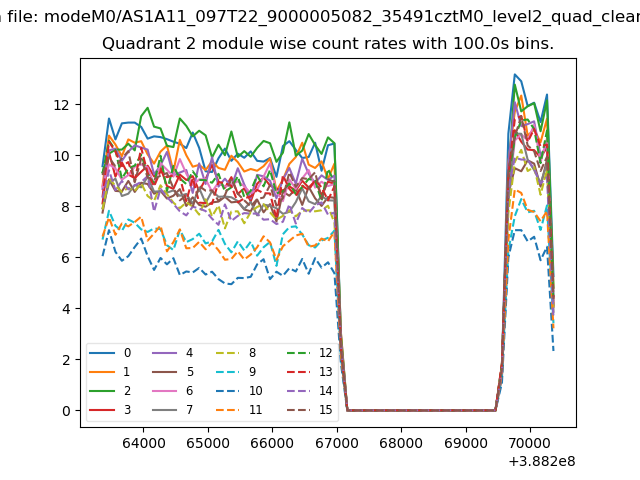
| Module-wise count rates for Quadrant B Data is divided into 100 sec bins |
 |
 |
| Module-wise count rates for Quadrant C Data is divided into 100 sec bins |
 |
 |
| Module-wise count rates for Quadrant D Data is divided into 100 sec bins |
 |
 |
| Parameter | Plot |
|---|---|
| CZT HV Monitor | 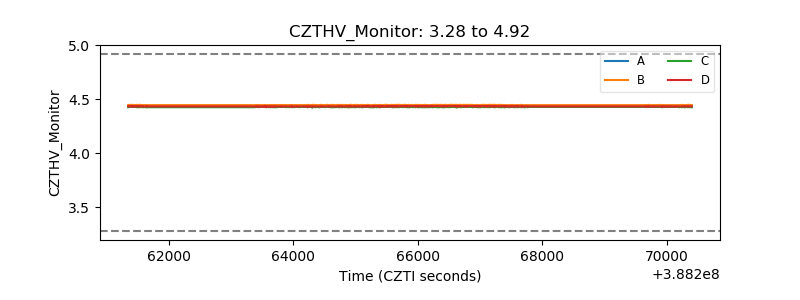 |
| D_VDD | 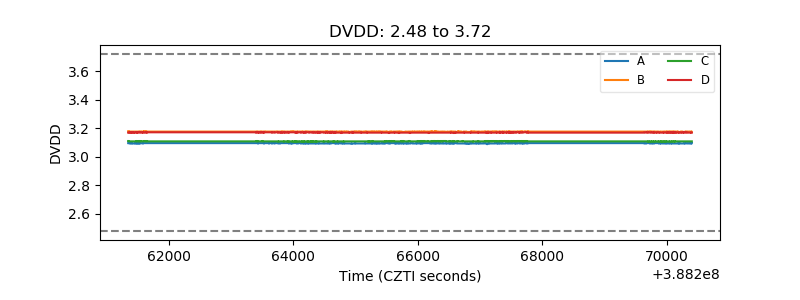 |
| Temperature 1 | 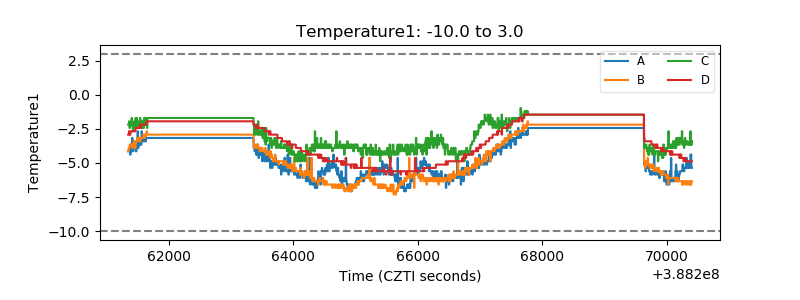 |
| Veto HV Monitor | 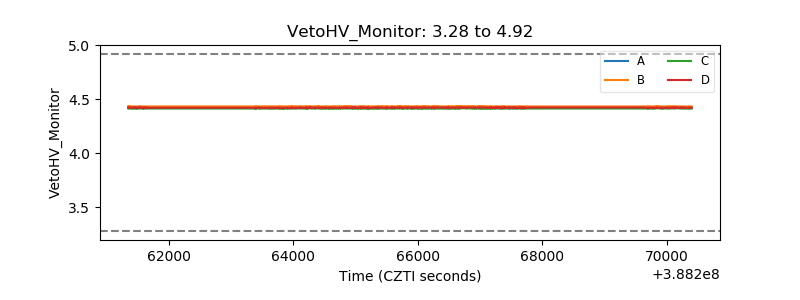 |
| Veto LLD | 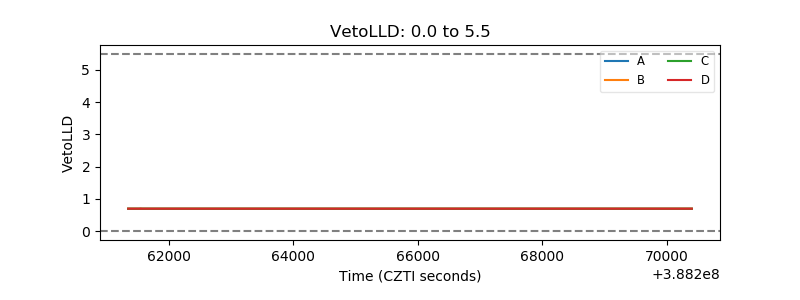 |
| Alpha Counter | 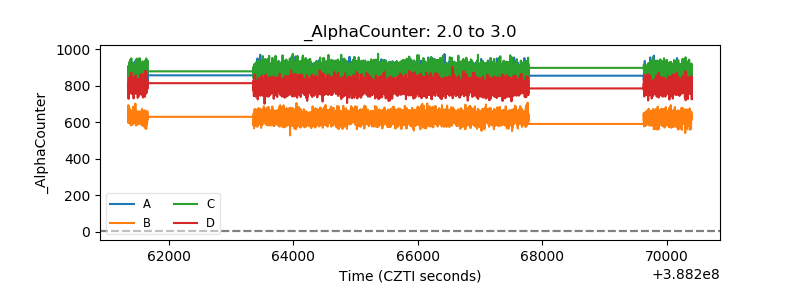 |
| _CPM_Rate | 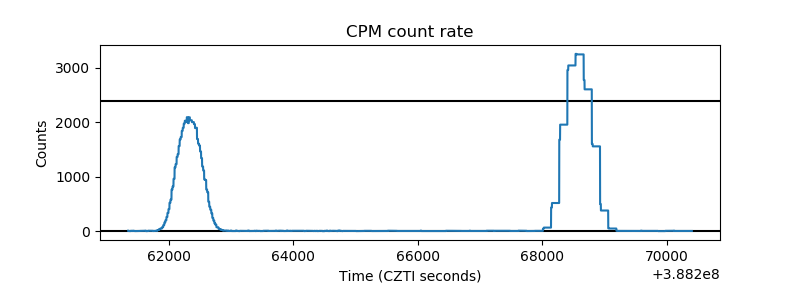 |
| CZT Counter | 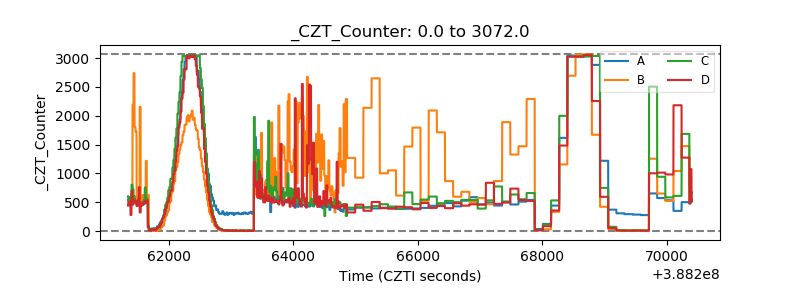 |
| +2.5 Volts monitor | 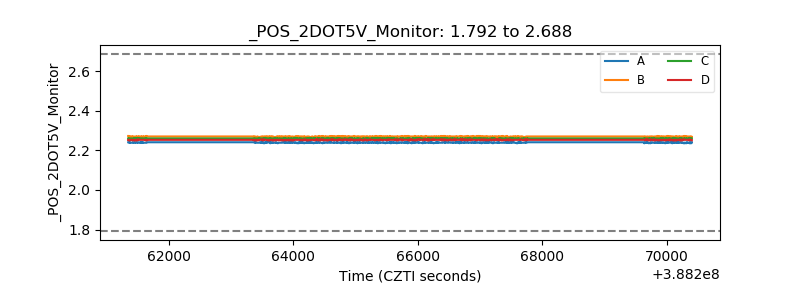 |
| +5 Volts monitor | 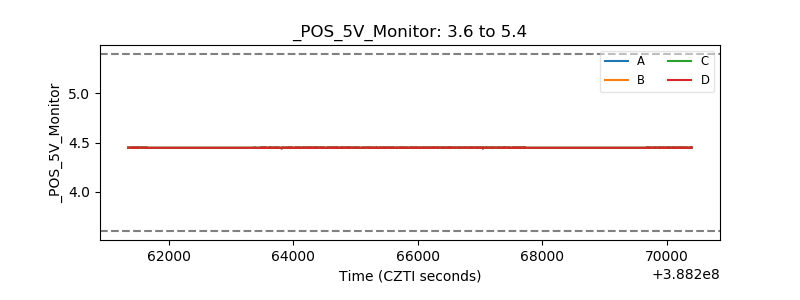 |
| _ROLL_ROT | 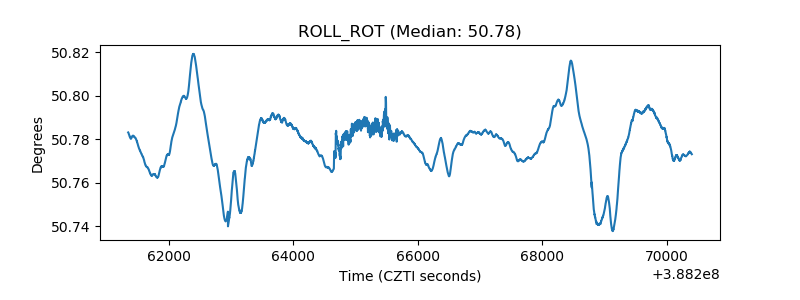 |
| _Roll_DEC | 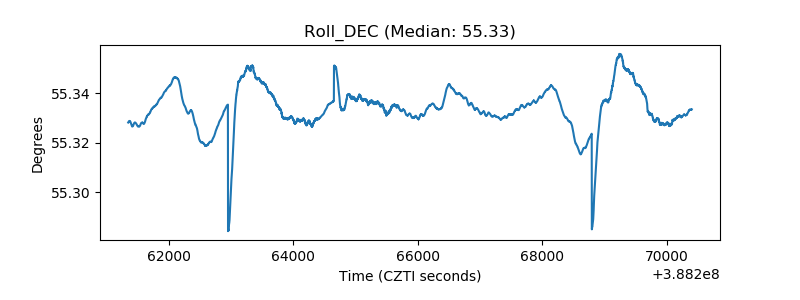 |
| _Roll_RA | 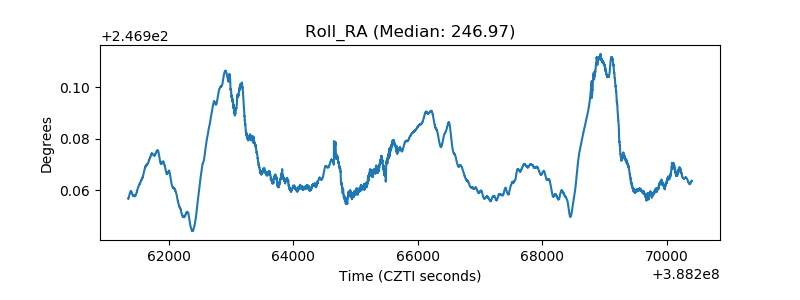 |
| Veto Counter | 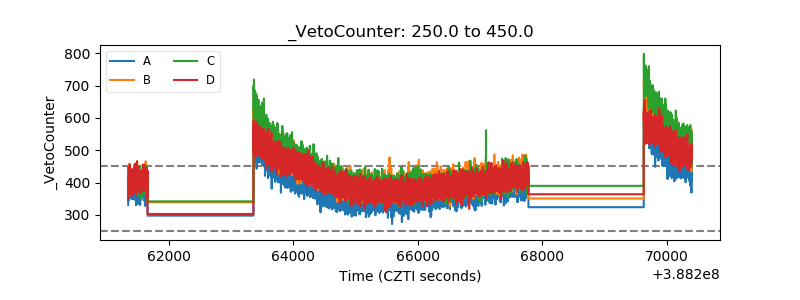 |