| Param | Original file | Final file |
|---|---|---|
| Filename | modeM0/AS1T04_095T01_9000005080_35482cztM0_level2.evt | modeM0/AS1T04_095T01_9000005080_35482cztM0_level2_quad_clean.evt |
| Size (bytes) | 590,382,720 | 91,745,280 |
| Size | 563.0 MB | 87.5 MB |
| Events in quadrant A | 4,547,532 | 583,572 |
| Events in quadrant B | 3,366,449 | 641,109 |
| Events in quadrant C | 5,318,318 | 604,364 |
| Events in quadrant D | 4,295,184 | 583,641 |
| Mode M0 | |||
|---|---|---|---|
| Quadrant | BADHDUFLAG | Total packets | Discarded packets |
| A | 0 | 16979 | 3 |
| B | 0 | 13419 | 2 |
| C | 0 | 19352 | 2 |
| D | 0 | 16162 | 2 |
| Mode M9 | |||
|---|---|---|---|
| Quadrant | BADHDUFLAG | Total packets | Discarded packets |
| A | 0 | 19 | 0 |
| B | 0 | 19 | 0 |
| C | 0 | 19 | 0 |
| D | 0 | 20 | 0 |
| Mode SS | |||
|---|---|---|---|
| Quadrant | BADHDUFLAG | Total packets | Discarded packets |
| A | 0 | 108 | 0 |
| B | 0 | 108 | 0 |
| C | 0 | 108 | 0 |
| D | 0 | 108 | 0 |
| Quadrant | Total seconds | Saturated seconds | Saturation percentage |
|---|---|---|---|
| A | 5201 | 1022 | 19.650067% |
| B | 5201 | 230 | 4.422226% |
| C | 5201 | 523 | 10.055759% |
| D | 5201 | 534 | 10.267256% |
Noise dominated data is calculated using 1-second bins in cleaned event files. If a bin has >2000 counts, and if more than 50% of those come from <1% of pixels, then it is considered to be noise-dominated and hence unusable.
| Quadrant | # 1 sec bins | Bins with >0 counts | Bins with >2000 counts | High rate bins dominated by noise | Noise dominated (total time) | Noise dominated (detector-on time) | Marked lightcurve |
|---|---|---|---|---|---|---|---|
| A | 7052 | 5202 | 808 | 808 | 11.46% | 15.53% | 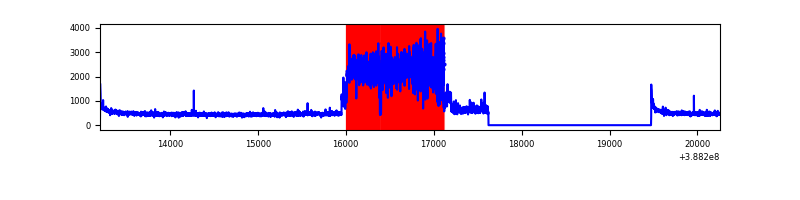 |
| B | 7052 | 5202 | 146 | 146 | 2.07% | 2.81% | 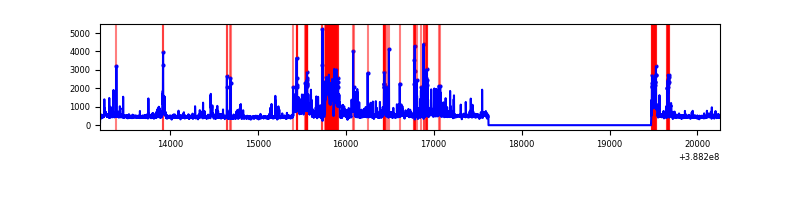 |
| C | 7052 | 5202 | 432 | 432 | 6.13% | 8.30% | 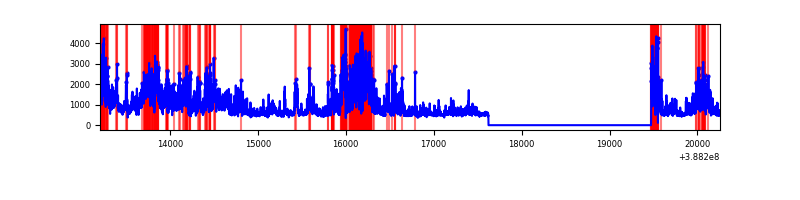 |
| D | 7052 | 5202 | 449 | 449 | 6.37% | 8.63% | 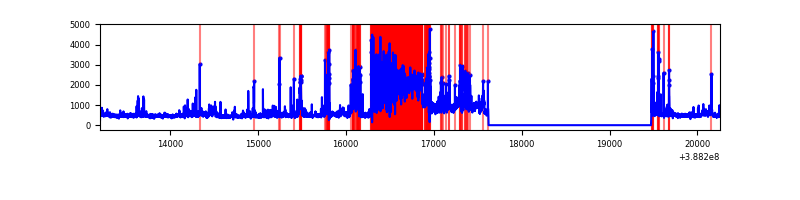 |
Top three noisy pixels from each quadrant. If the there are fewer than three noisy pixels in the level2.evt file, extra rows are filled as -1
| Pixel properties | Quadrant properties | ||||||
|---|---|---|---|---|---|---|---|
| Quadrant | DetID | PixID | Counts | Sigma | Mean | Median | Sigma |
| A | 15 | 169 | 2276792 | 20606.91 | 550 | 539 | 110.5 |
| A | 10 | 83 | 130895 | 1180.11 | 550 | 539 | 110.5 |
| A | 13 | 6 | 8107 | 68.51 | 550 | 539 | 110.5 |
| B | 5 | 236 | 651883 | 5837.41 | 587 | 572 | 111.6 |
| B | 5 | 172 | 200314 | 1790.2 | 587 | 572 | 111.6 |
| B | 4 | 81 | 88613 | 789.07 | 587 | 572 | 111.6 |
| C | 4 | 254 | 2418865 | 18444.84 | 566 | 569 | 131.1 |
| C | 0 | 10 | 281686 | 2144.14 | 566 | 569 | 131.1 |
| C | 15 | 214 | 211770 | 1610.87 | 566 | 569 | 131.1 |
| D | 10 | 118 | 1189550 | 8743.21 | 564 | 549 | 136.0 |
| D | 7 | 80 | 367460 | 2698.05 | 564 | 549 | 136.0 |
| D | 8 | 195 | 109347 | 800.04 | 564 | 549 | 136.0 |
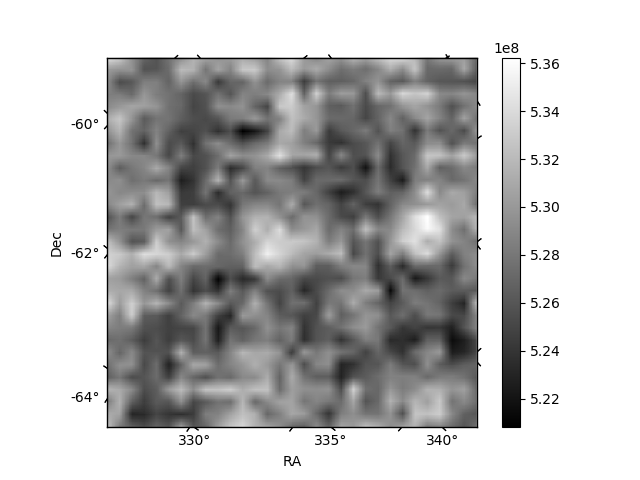
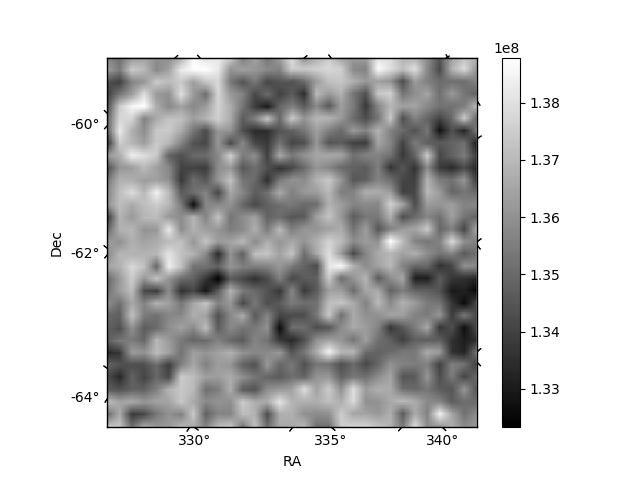
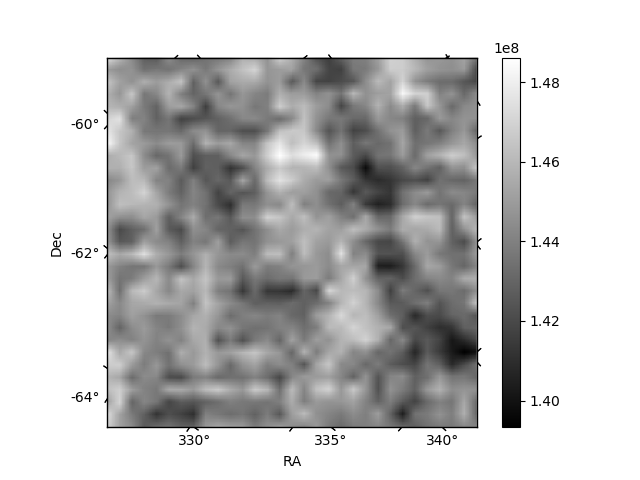
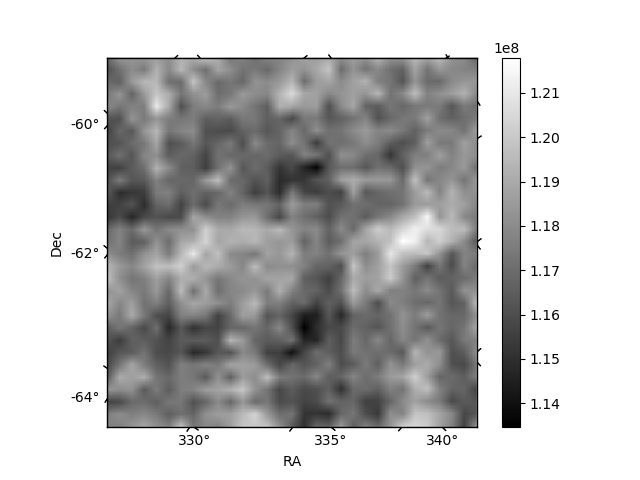
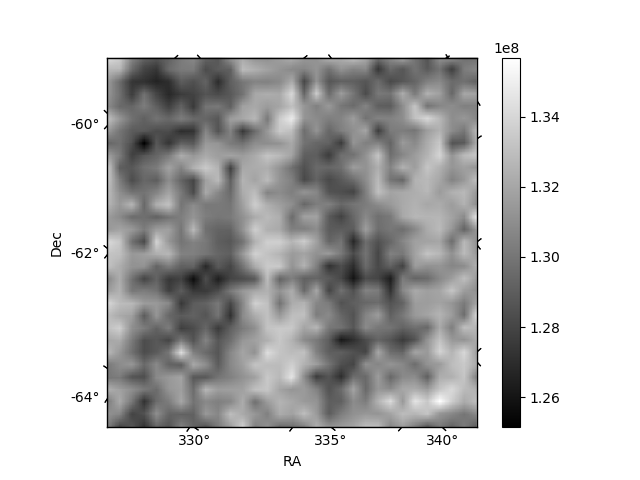
Histogram calculated using DETX and DETY for each event in the final _common_clean file
| Quadrant A | 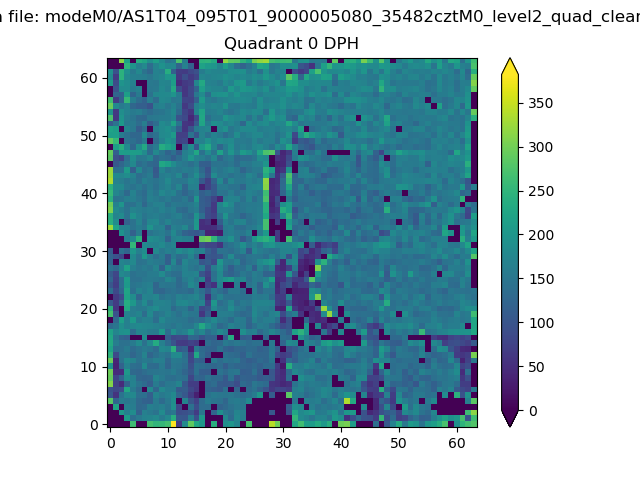 |
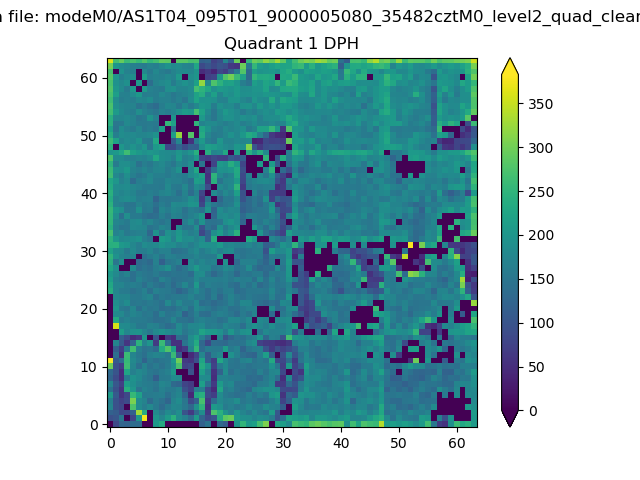 |
Quadrant B |
|---|---|---|---|
| Quadrant D | 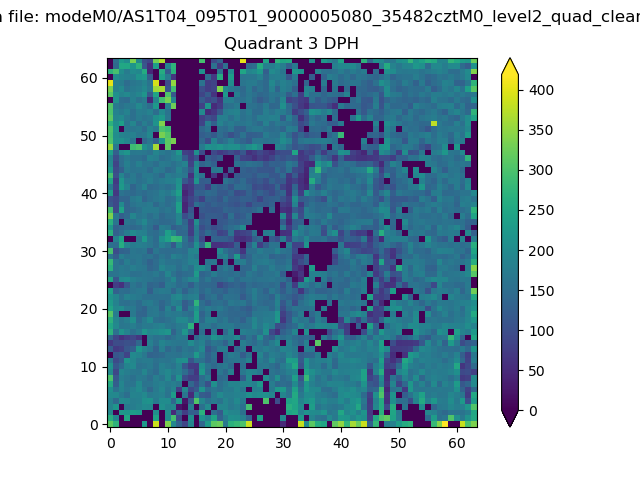 |
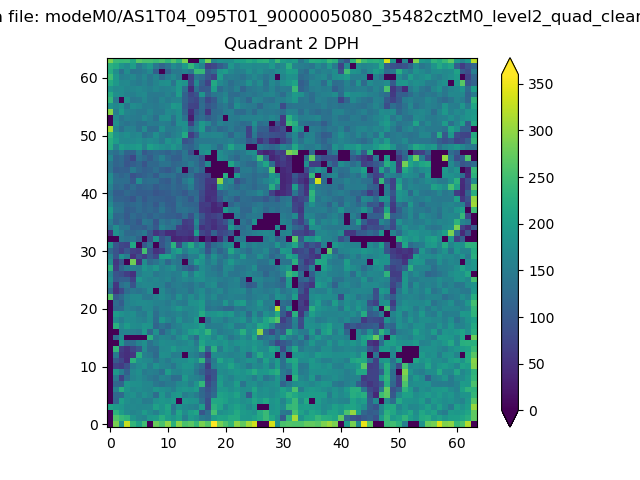 |
Quadrant C |
| Plot type | Count rate plots | Images |
|---|---|---|
| Comparison with Poisson distribution Blue bars denote a histogram of data divided into 1 sec bins. Red curve is a Poisson curve with rate = median count rate of data. |
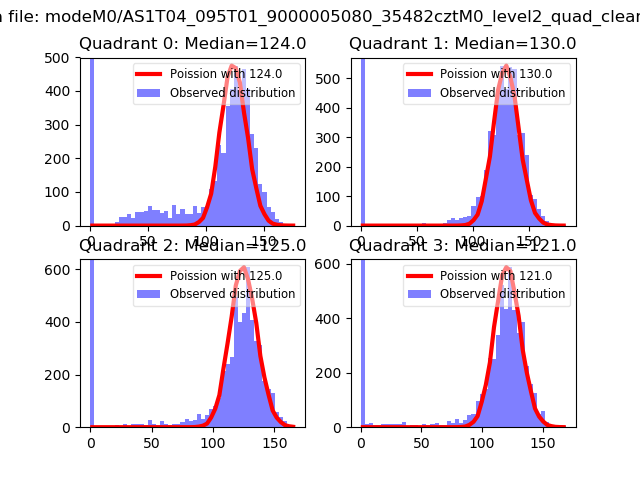 |
 |
| Quadrant-wise count rates Data is divided into 100 sec bins |
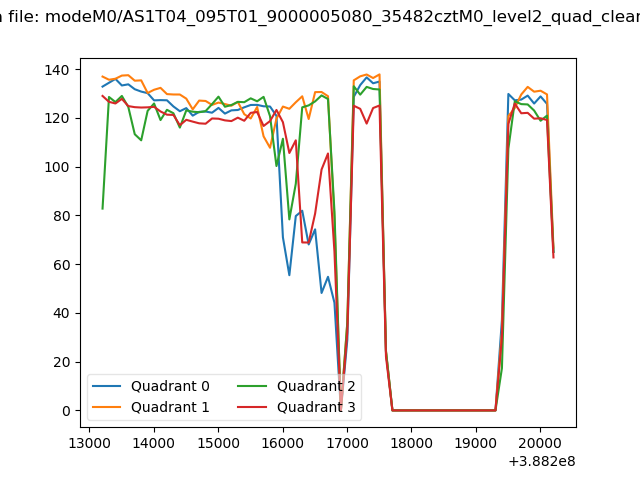 |
|
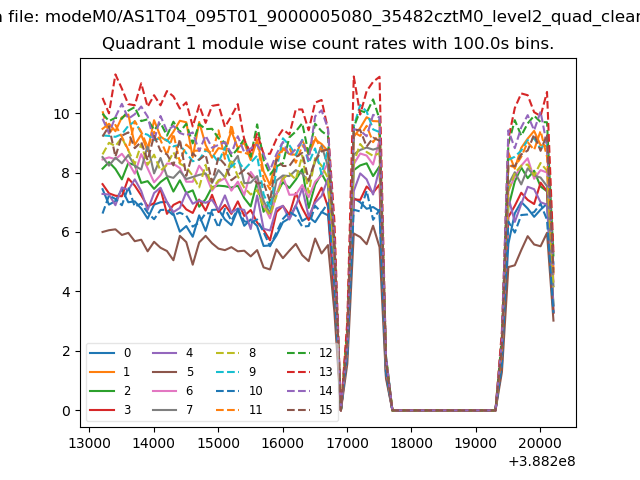
| Module-wise count rates for Quadrant A Data is divided into 100 sec bins |
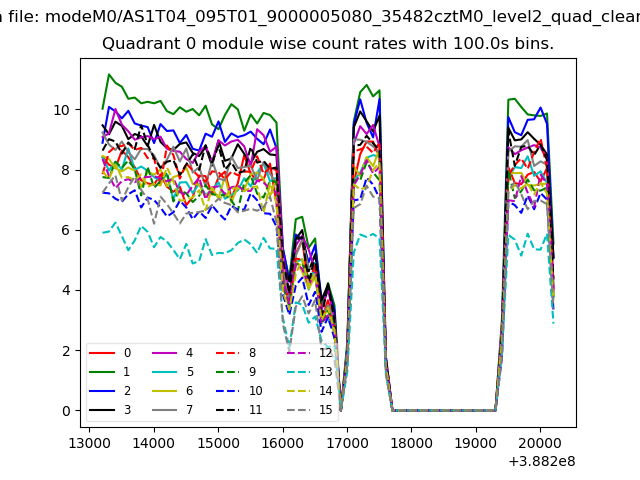 |
 |
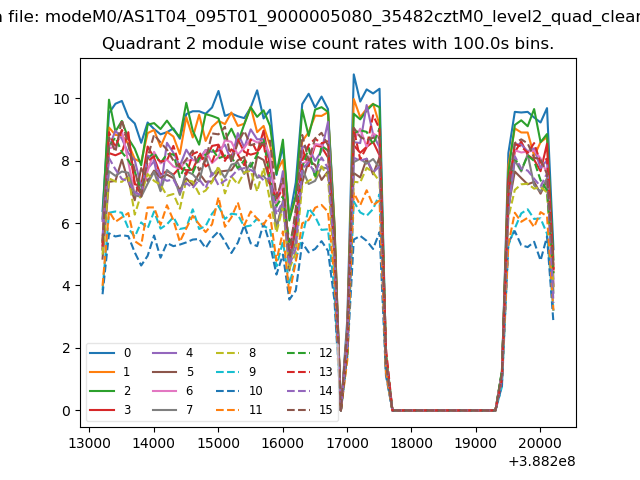
| Module-wise count rates for Quadrant B Data is divided into 100 sec bins |
 |
 |
| Module-wise count rates for Quadrant C Data is divided into 100 sec bins |
 |
 |
| Module-wise count rates for Quadrant D Data is divided into 100 sec bins |
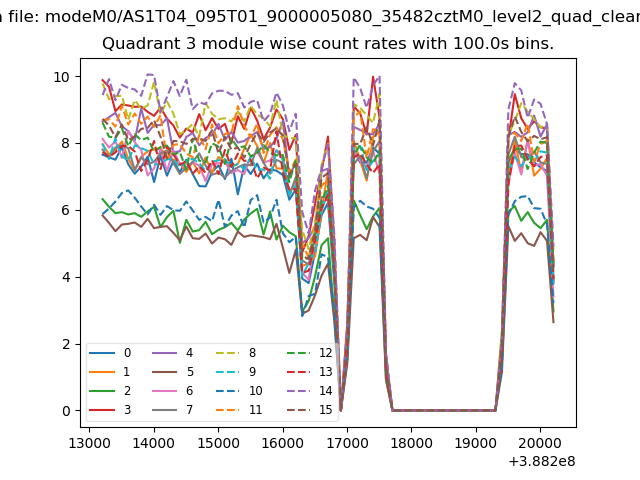 |
 |
| Parameter | Plot |
|---|---|
| CZT HV Monitor | 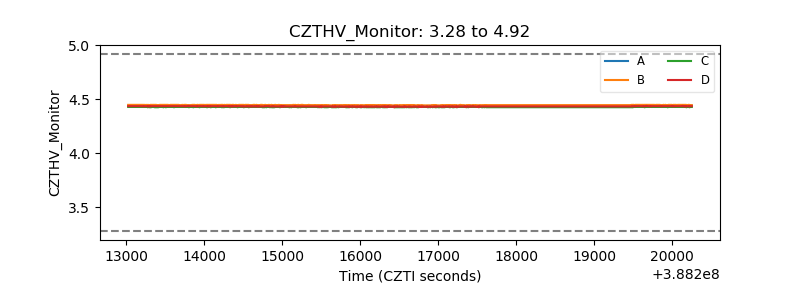 |
| D_VDD | 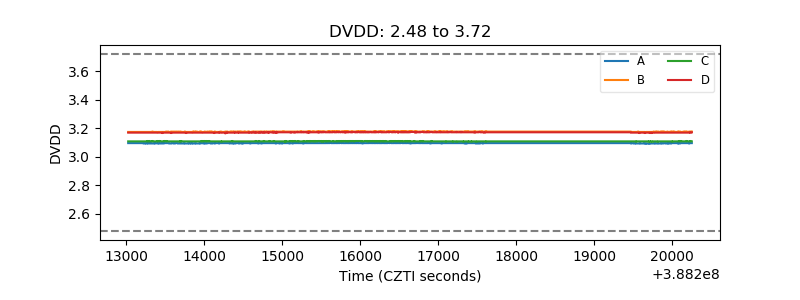 |
| Temperature 1 | 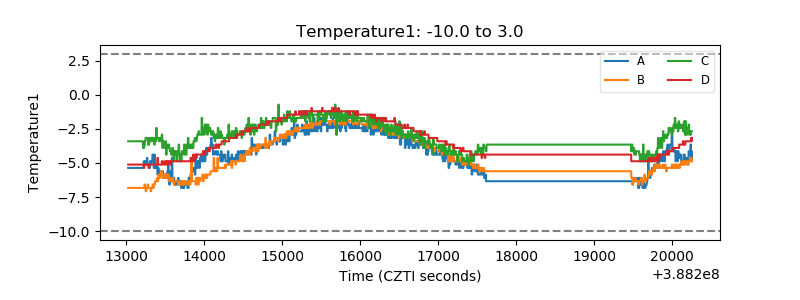 |
| Veto HV Monitor | 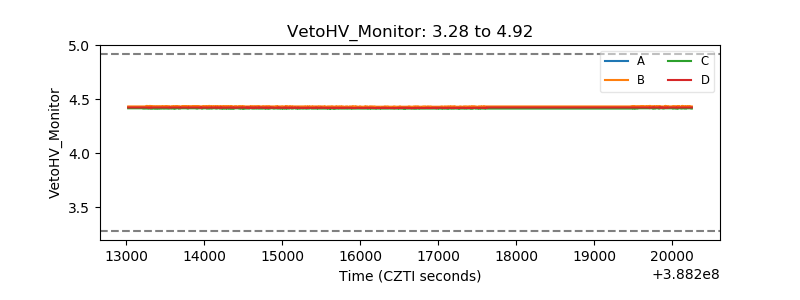 |
| Veto LLD | 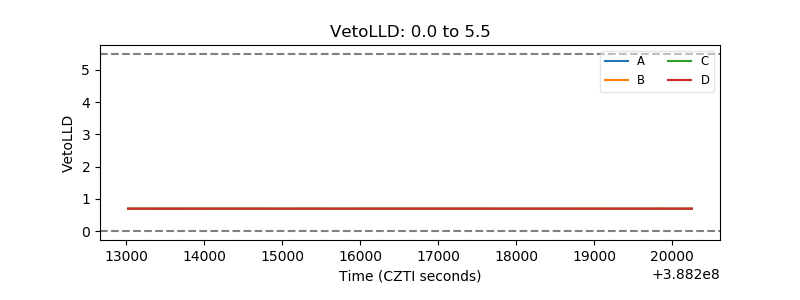 |
| Alpha Counter | 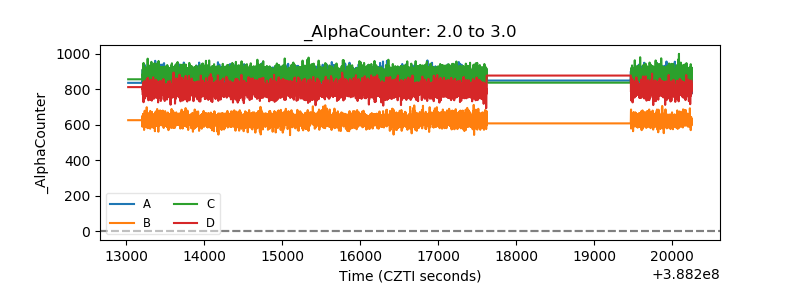 |
| _CPM_Rate | 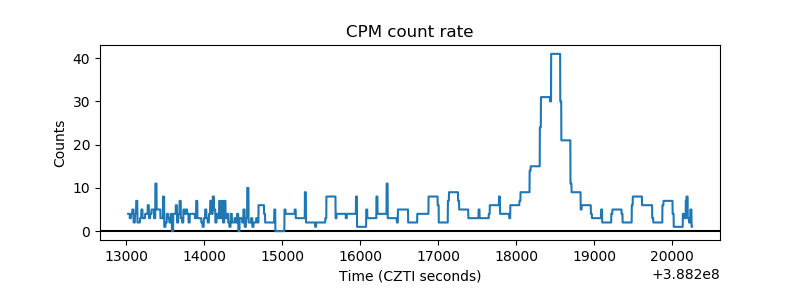 |
| CZT Counter | 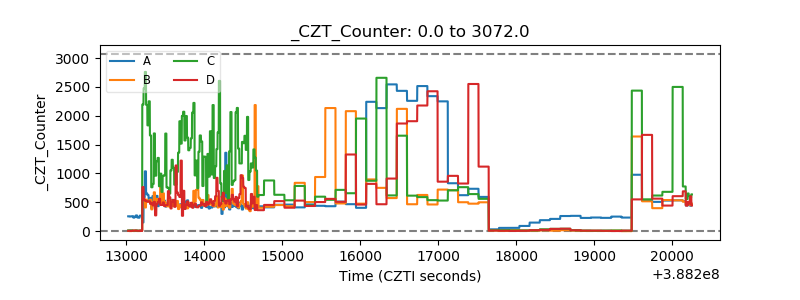 |
| +2.5 Volts monitor | 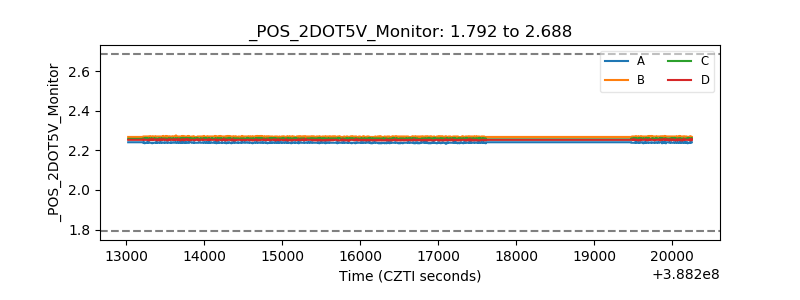 |
| +5 Volts monitor | 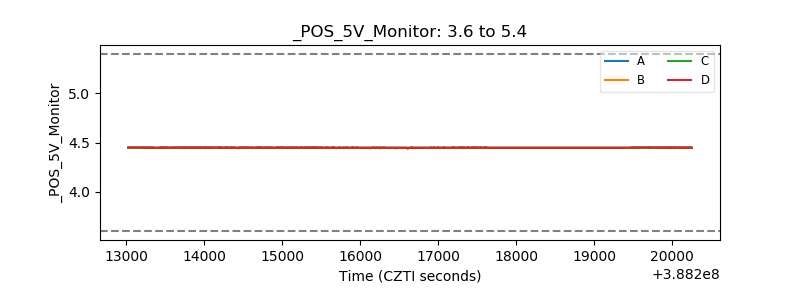 |
| _ROLL_ROT | 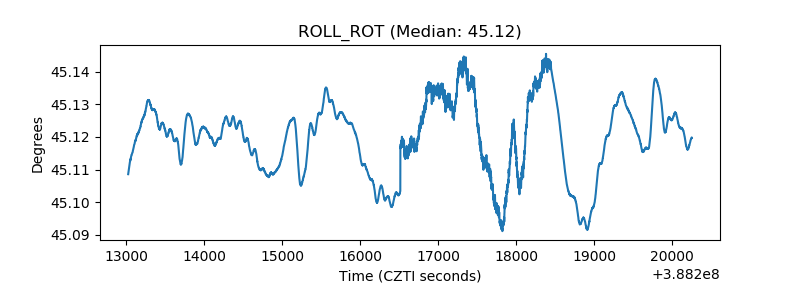 |
| _Roll_DEC | 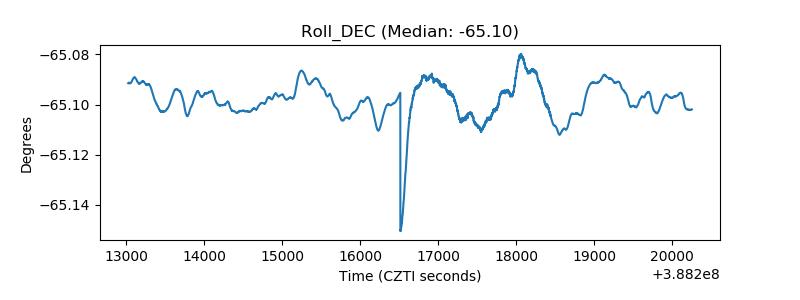 |
| _Roll_RA |  |
| Veto Counter | 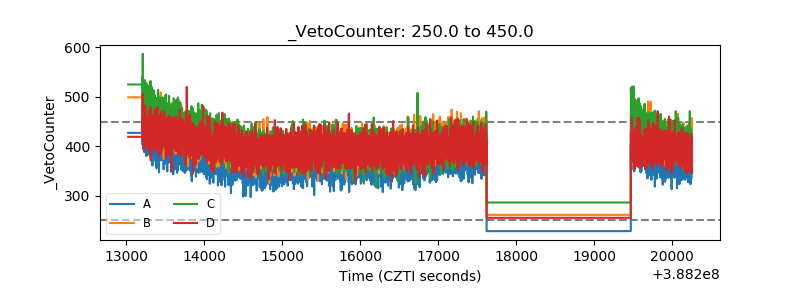 |