| Param | Original file | Final file |
|---|---|---|
| Filename | modeM0/AS1T04_095T01_9000005080_35480cztM0_level2.evt | modeM0/AS1T04_095T01_9000005080_35480cztM0_level2_quad_clean.evt |
| Size (bytes) | 626,857,920 | 90,434,880 |
| Size | 597.8 MB | 86.2 MB |
| Events in quadrant A | 2,774,285 | 704,128 |
| Events in quadrant B | 3,285,532 | 708,421 |
| Events in quadrant C | 10,001,622 | 297,493 |
| Events in quadrant D | 2,591,106 | 683,432 |
| Mode M0 | |||
|---|---|---|---|
| Quadrant | BADHDUFLAG | Total packets | Discarded packets |
| A | 0 | 11107 | 3 |
| B | 0 | 12825 | 2 |
| C | 0 | 33155 | 2 |
| D | 0 | 10704 | 2 |
| Mode M9 | |||
|---|---|---|---|
| Quadrant | BADHDUFLAG | Total packets | Discarded packets |
| A | 0 | 33 | 0 |
| B | 0 | 33 | 0 |
| C | 0 | 33 | 0 |
| D | 0 | 34 | 0 |
| Mode SS | |||
|---|---|---|---|
| Quadrant | BADHDUFLAG | Total packets | Discarded packets |
| A | 0 | 98 | 0 |
| B | 0 | 98 | 0 |
| C | 0 | 98 | 0 |
| D | 0 | 98 | 0 |
| Quadrant | Total seconds | Saturated seconds | Saturation percentage |
|---|---|---|---|
| A | 4904 | 95 | 1.937194% |
| B | 4904 | 213 | 4.343393% |
| C | 4904 | 3455 | 70.452692% |
| D | 4904 | 21 | 0.428222% |
Noise dominated data is calculated using 1-second bins in cleaned event files. If a bin has >2000 counts, and if more than 50% of those come from <1% of pixels, then it is considered to be noise-dominated and hence unusable.
| Quadrant | # 1 sec bins | Bins with >0 counts | Bins with >2000 counts | High rate bins dominated by noise | Noise dominated (total time) | Noise dominated (detector-on time) | Marked lightcurve |
|---|---|---|---|---|---|---|---|
| A | 7056 | 4905 | 99 | 99 | 1.40% | 2.02% | 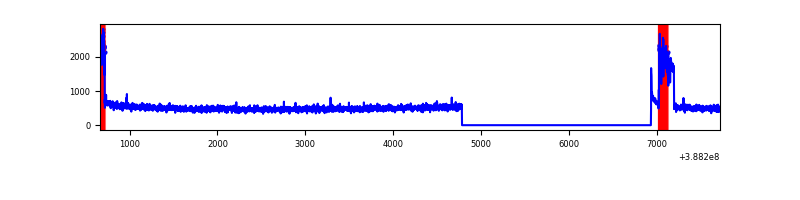 |
| B | 7056 | 4905 | 144 | 144 | 2.04% | 2.94% | 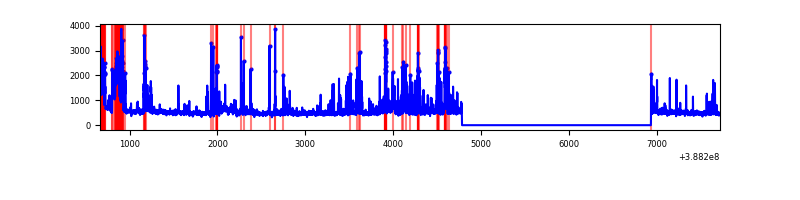 |
| C | 7056 | 4905 | 3027 | 3027 | 42.90% | 61.71% | 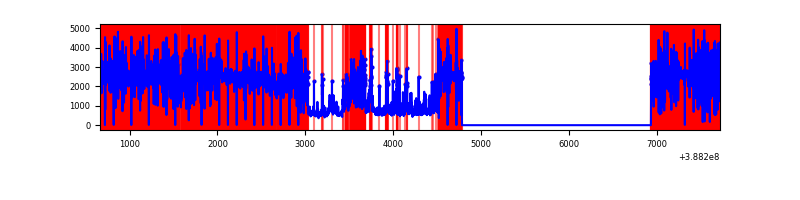 |
| D | 7056 | 4905 | 19 | 19 | 0.27% | 0.39% | 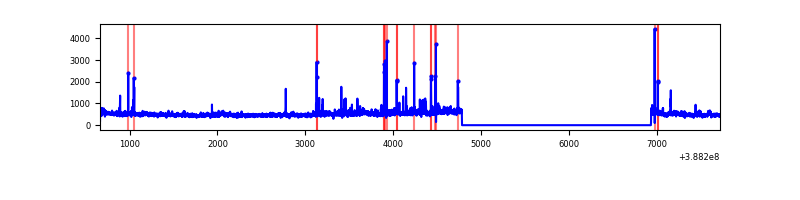 |
Top three noisy pixels from each quadrant. If the there are fewer than three noisy pixels in the level2.evt file, extra rows are filled as -1
| Pixel properties | Quadrant properties | ||||||
|---|---|---|---|---|---|---|---|
| Quadrant | DetID | PixID | Counts | Sigma | Mean | Median | Sigma |
| A | 15 | 169 | 311466 | 2624.18 | 601 | 592 | 118.5 |
| A | 10 | 83 | 122731 | 1031.01 | 601 | 592 | 118.5 |
| A | 13 | 6 | 14549 | 117.82 | 601 | 592 | 118.5 |
| B | 5 | 236 | 500479 | 4499.68 | 593 | 578 | 111.1 |
| B | 5 | 172 | 275235 | 2472.23 | 593 | 578 | 111.1 |
| B | 4 | 232 | 89974 | 804.67 | 593 | 578 | 111.1 |
| C | 4 | 254 | 8360999 | 127526.04 | 284 | 288 | 65.6 |
| C | 0 | 10 | 195485 | 2977.34 | 284 | 288 | 65.6 |
| C | 0 | 207 | 134974 | 2054.37 | 284 | 288 | 65.6 |
| D | 8 | 195 | 61310 | 418.92 | 600 | 586 | 145.0 |
| D | 13 | 249 | 58084 | 396.67 | 600 | 586 | 145.0 |
| D | 2 | 250 | 42065 | 286.16 | 600 | 586 | 145.0 |
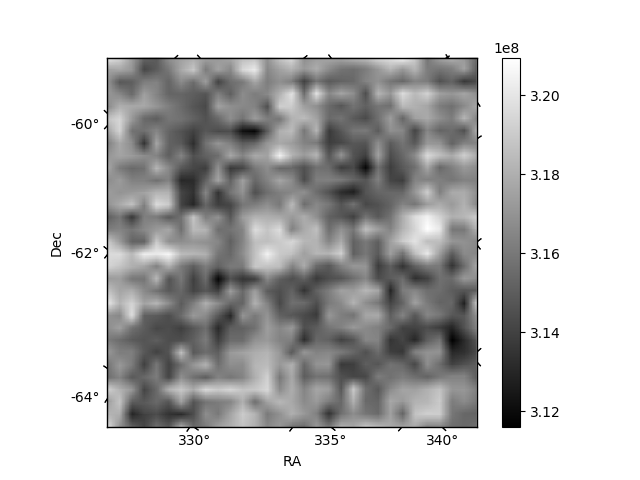
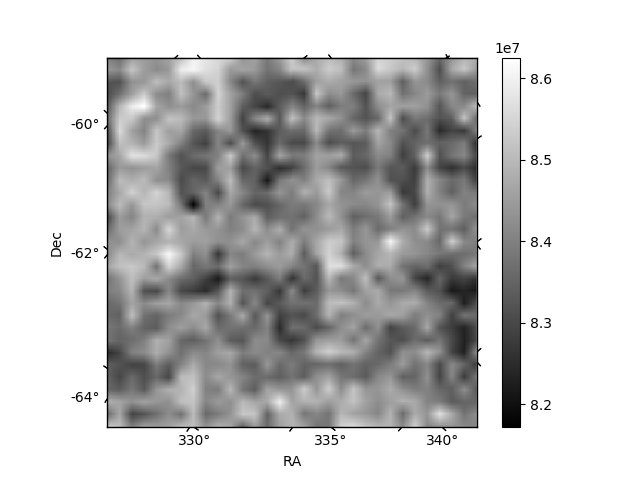
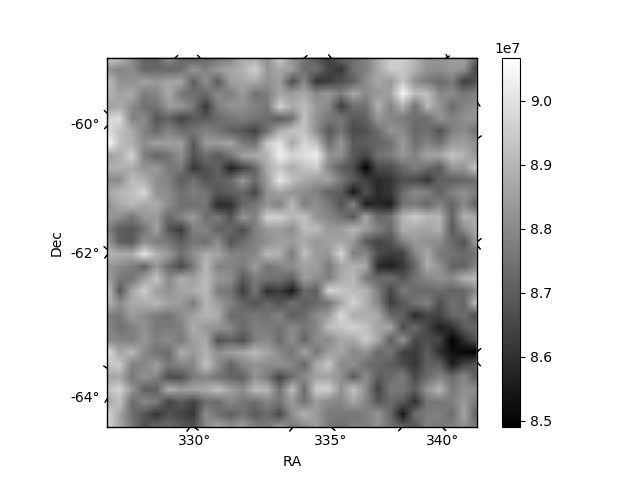
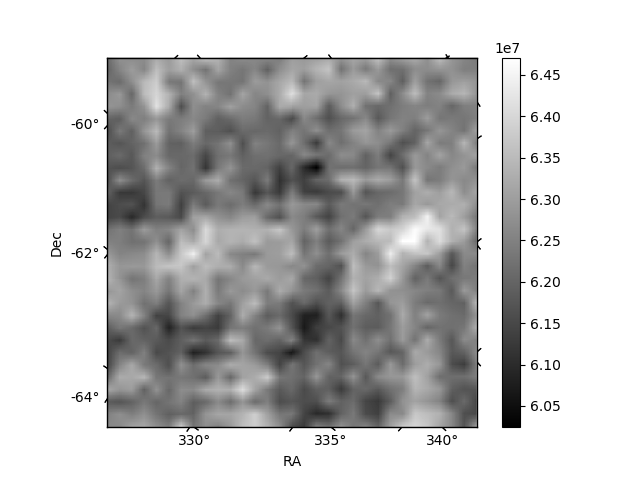
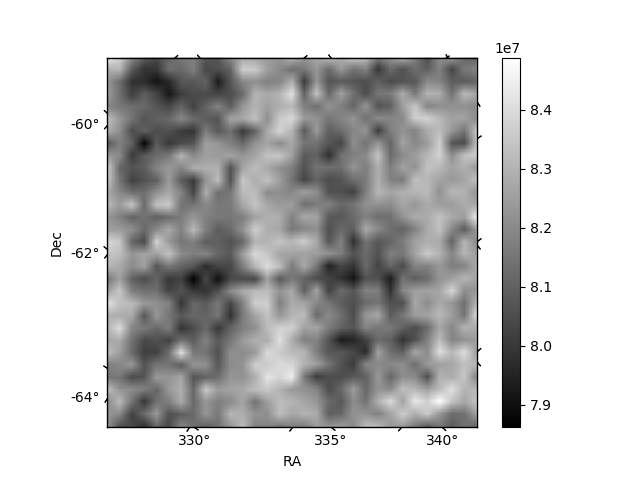
Histogram calculated using DETX and DETY for each event in the final _common_clean file
| Quadrant A | 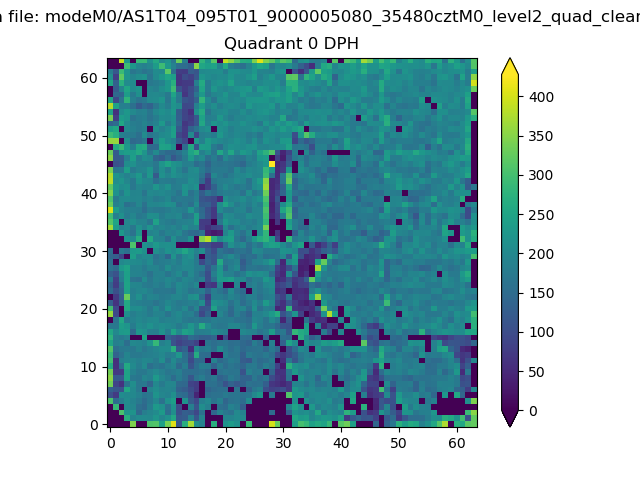 |
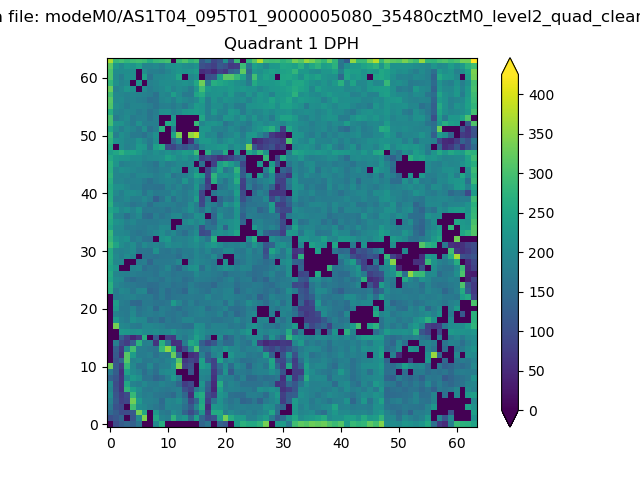 |
Quadrant B |
|---|---|---|---|
| Quadrant D | 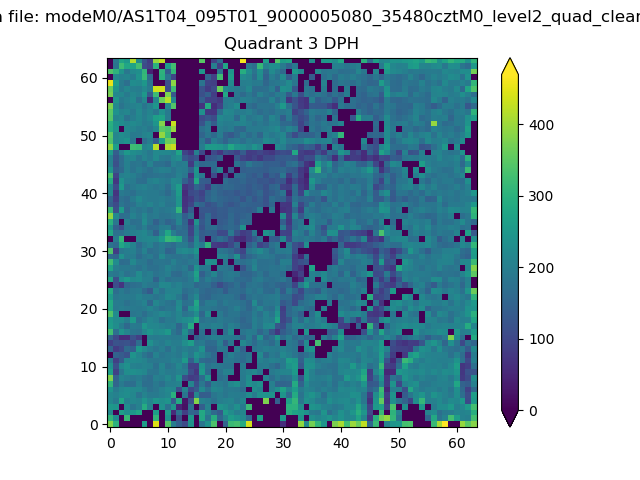 |
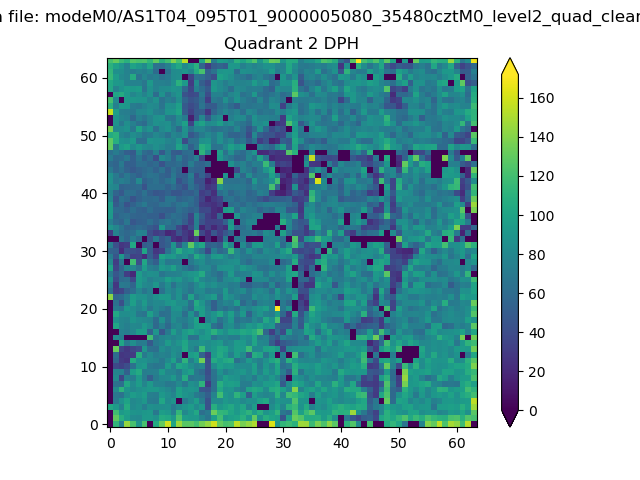 |
Quadrant C |
| Plot type | Count rate plots | Images |
|---|---|---|
| Comparison with Poisson distribution Blue bars denote a histogram of data divided into 1 sec bins. Red curve is a Poisson curve with rate = median count rate of data. |
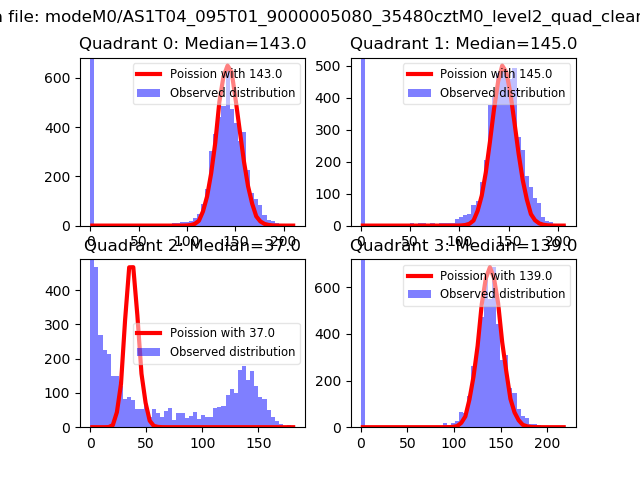 |
 |
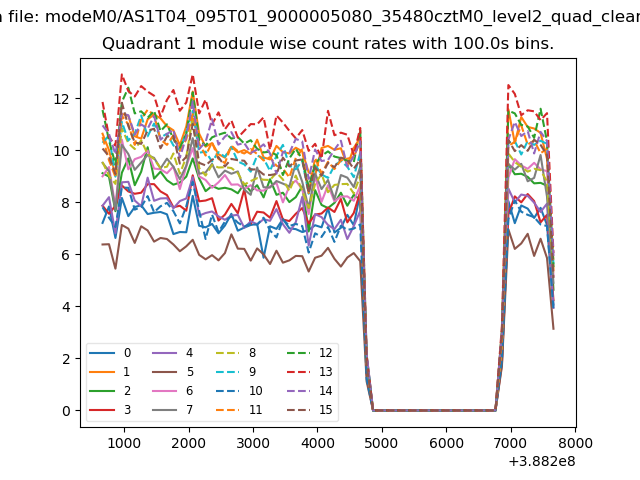
| Quadrant-wise count rates Data is divided into 100 sec bins |
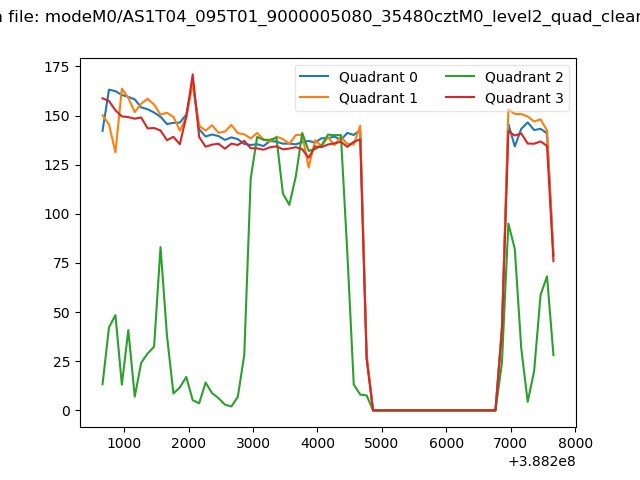 |
|
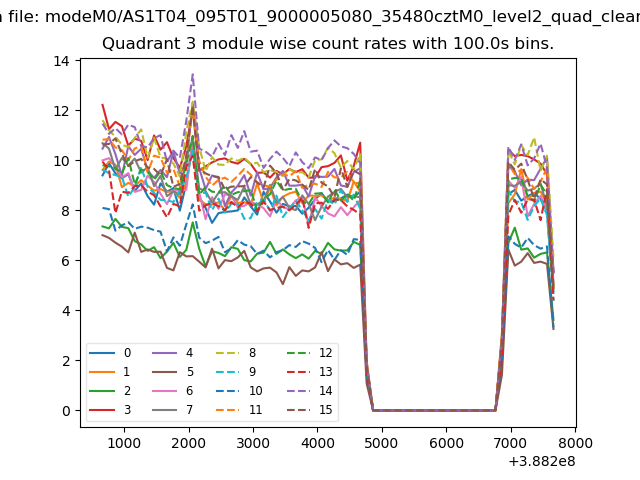
| Module-wise count rates for Quadrant A Data is divided into 100 sec bins |
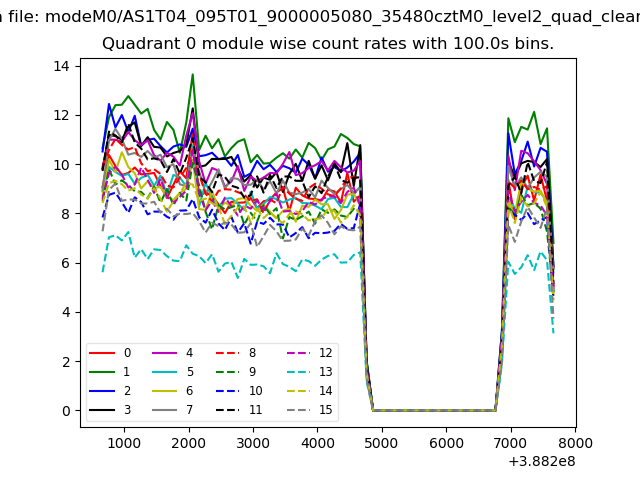 |
 |
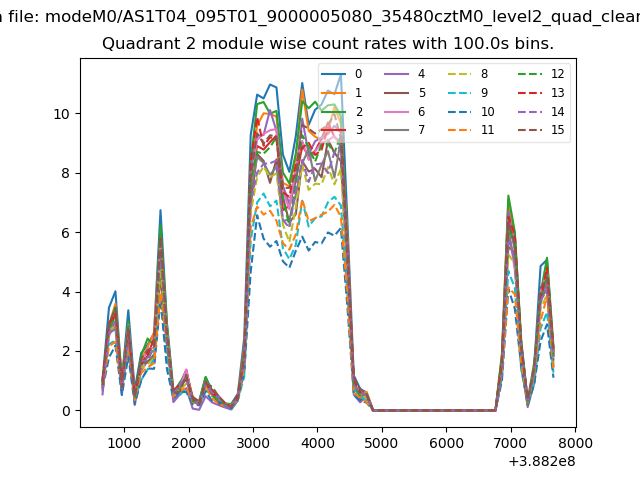
| Module-wise count rates for Quadrant B Data is divided into 100 sec bins |
 |
 |
| Module-wise count rates for Quadrant C Data is divided into 100 sec bins |
 |
 |
| Module-wise count rates for Quadrant D Data is divided into 100 sec bins |
 |
 |
| Parameter | Plot |
|---|---|
| CZT HV Monitor | 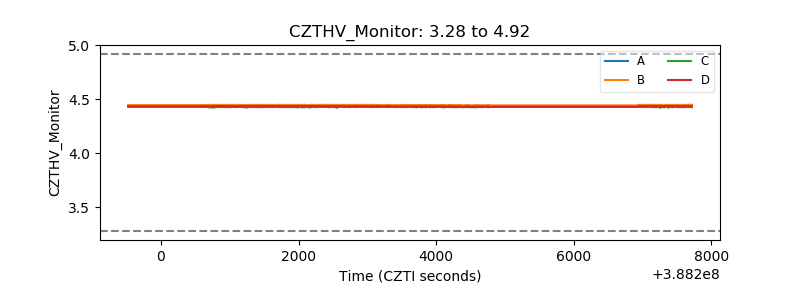 |
| D_VDD | 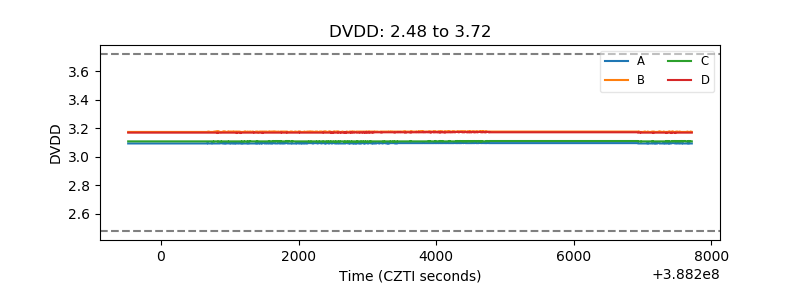 |
| Temperature 1 | 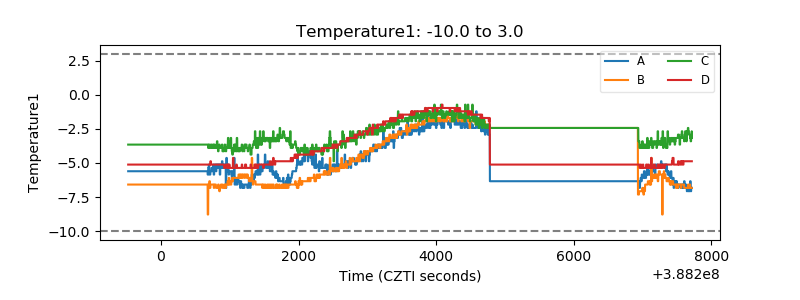 |
| Veto HV Monitor |  |
| Veto LLD | 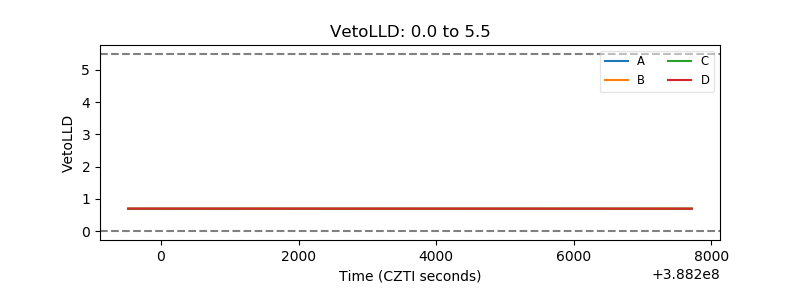 |
| Alpha Counter | 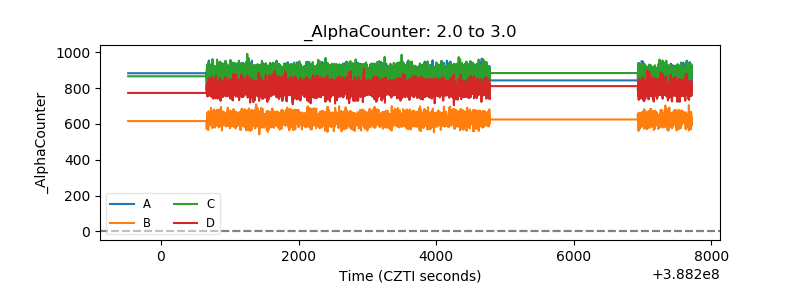 |
| _CPM_Rate | 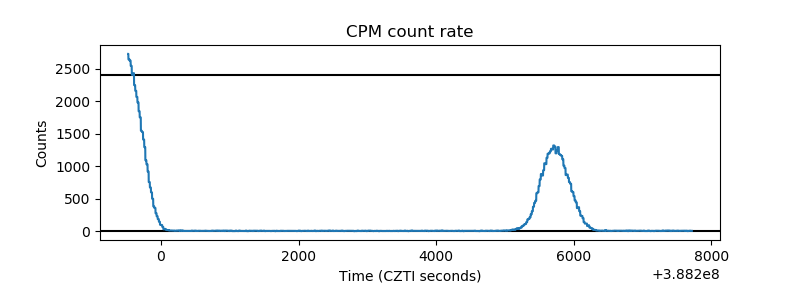 |
| CZT Counter | 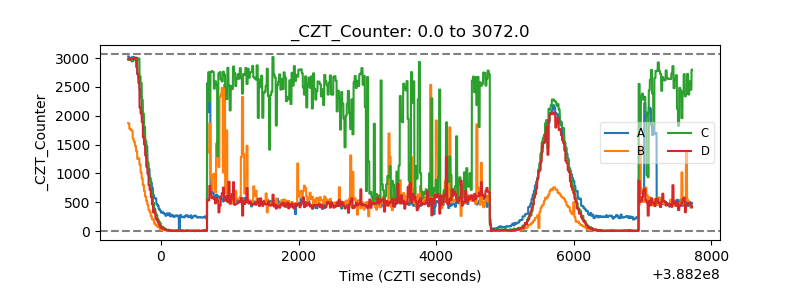 |
| +2.5 Volts monitor | 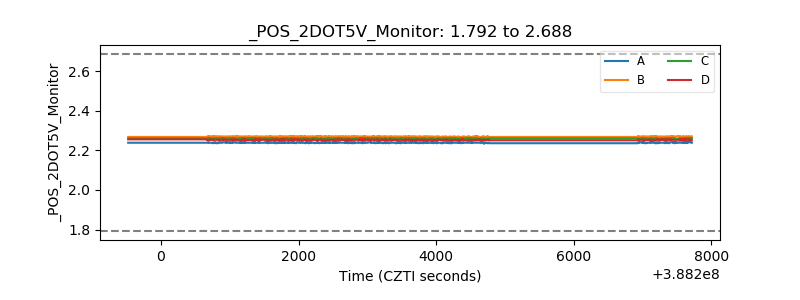 |
| +5 Volts monitor | 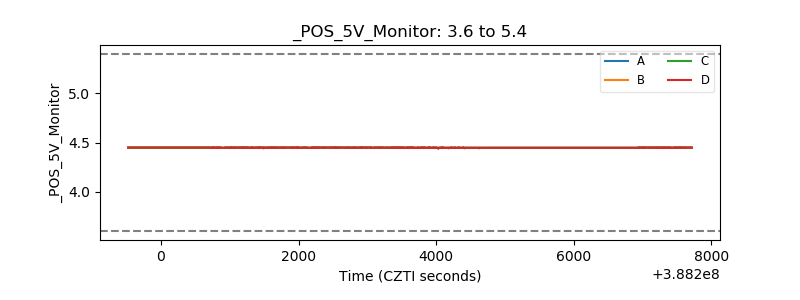 |
| _ROLL_ROT | 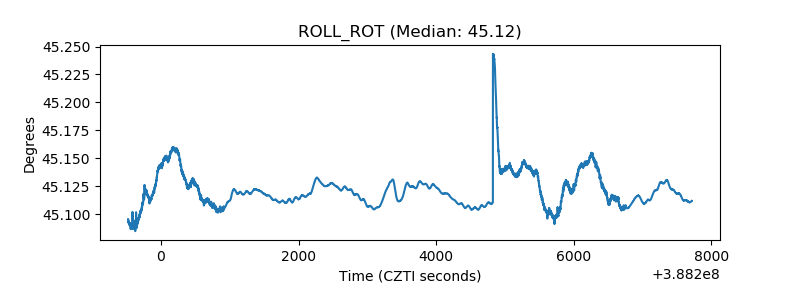 |
| _Roll_DEC | 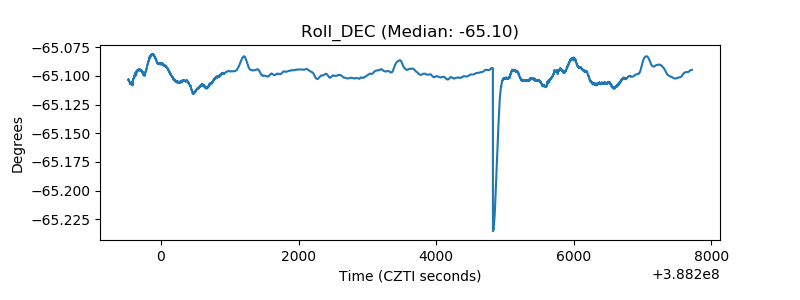 |
| _Roll_RA | 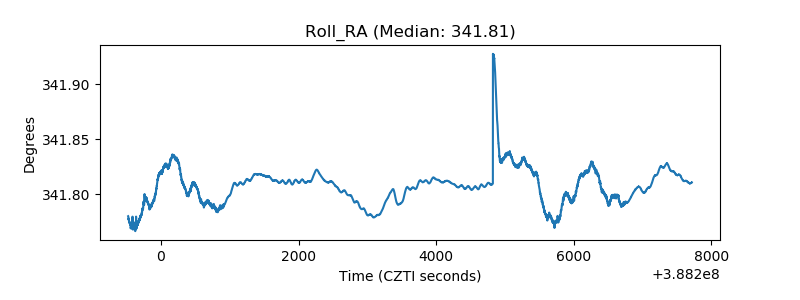 |
| Veto Counter | 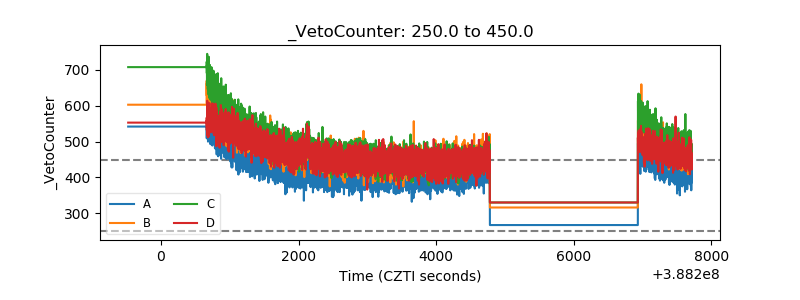 |