| Param | Original file | Final file |
|---|---|---|
| Filename | modeM0/AS1T04_095T01_9000005080_35477cztM0_level2.evt | modeM0/AS1T04_095T01_9000005080_35477cztM0_level2_quad_clean.evt |
| Size (bytes) | 704,416,320 | 95,852,160 |
| Size | 671.8 MB | 91.4 MB |
| Events in quadrant A | 2,631,931 | 744,799 |
| Events in quadrant B | 3,509,987 | 744,211 |
| Events in quadrant C | 11,761,165 | 356,490 |
| Events in quadrant D | 3,077,377 | 690,038 |
| Mode M0 | |||
|---|---|---|---|
| Quadrant | BADHDUFLAG | Total packets | Discarded packets |
| A | 0 | 11057 | 3 |
| B | 0 | 13759 | 2 |
| C | 0 | 38557 | 2 |
| D | 0 | 12510 | 2 |
| Mode M9 | |||
|---|---|---|---|
| Quadrant | BADHDUFLAG | Total packets | Discarded packets |
| A | 0 | 29 | 0 |
| B | 0 | 29 | 0 |
| C | 0 | 29 | 0 |
| D | 0 | 30 | 0 |
| Mode SS | |||
|---|---|---|---|
| Quadrant | BADHDUFLAG | Total packets | Discarded packets |
| A | 0 | 106 | 0 |
| B | 0 | 106 | 0 |
| C | 0 | 106 | 0 |
| D | 0 | 106 | 0 |
| Quadrant | Total seconds | Saturated seconds | Saturation percentage |
|---|---|---|---|
| A | 5219 | 14 | 0.268251% |
| B | 5219 | 229 | 4.387814% |
| C | 5219 | 3892 | 74.573673% |
| D | 5219 | 101 | 1.935237% |
Noise dominated data is calculated using 1-second bins in cleaned event files. If a bin has >2000 counts, and if more than 50% of those come from <1% of pixels, then it is considered to be noise-dominated and hence unusable.
| Quadrant | # 1 sec bins | Bins with >0 counts | Bins with >2000 counts | High rate bins dominated by noise | Noise dominated (total time) | Noise dominated (detector-on time) | Marked lightcurve |
|---|---|---|---|---|---|---|---|
| A | 7102 | 5220 | 3 | 3 | 0.04% | 0.06% | 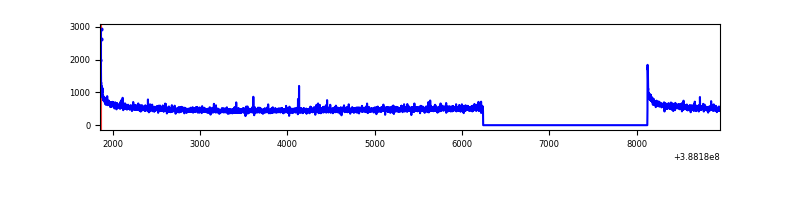 |
| B | 7102 | 5220 | 152 | 152 | 2.14% | 2.91% | 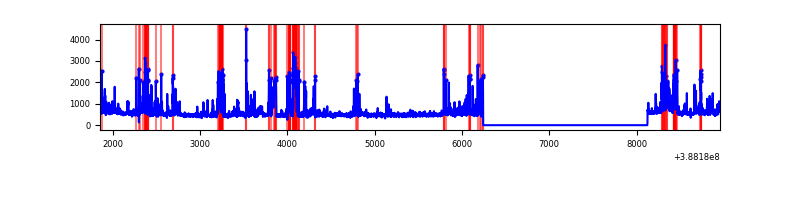 |
| C | 7102 | 5220 | 3348 | 3348 | 47.14% | 64.14% | 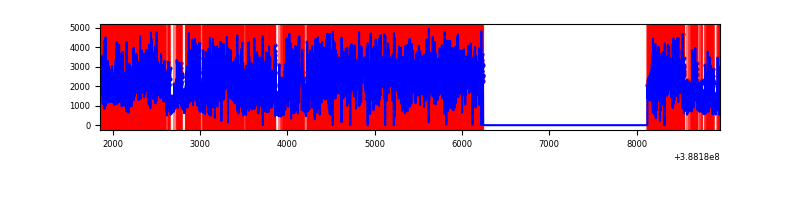 |
| D | 7102 | 5220 | 89 | 89 | 1.25% | 1.70% | 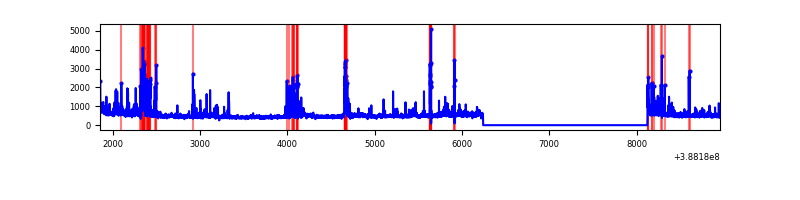 |
Top three noisy pixels from each quadrant. If the there are fewer than three noisy pixels in the level2.evt file, extra rows are filled as -1
| Pixel properties | Quadrant properties | ||||||
|---|---|---|---|---|---|---|---|
| Quadrant | DetID | PixID | Counts | Sigma | Mean | Median | Sigma |
| A | 10 | 83 | 129639 | 1019.09 | 639 | 628 | 126.6 |
| A | 13 | 6 | 10199 | 75.6 | 639 | 628 | 126.6 |
| A | 7 | 16 | 9296 | 68.47 | 639 | 628 | 126.6 |
| B | 5 | 236 | 523610 | 4415.74 | 631 | 614 | 118.4 |
| B | 5 | 200 | 287561 | 2422.74 | 631 | 614 | 118.4 |
| B | 5 | 172 | 138344 | 1162.88 | 631 | 614 | 118.4 |
| C | 4 | 254 | 10036823 | 127438.21 | 346 | 348 | 78.8 |
| C | 0 | 10 | 160581 | 2034.55 | 346 | 348 | 78.8 |
| C | 15 | 214 | 123720 | 1566.51 | 346 | 348 | 78.8 |
| D | 12 | 233 | 136353 | 929.41 | 612 | 597 | 146.1 |
| D | 1 | 52 | 117560 | 800.75 | 612 | 597 | 146.1 |
| D | 2 | 153 | 93970 | 639.25 | 612 | 597 | 146.1 |
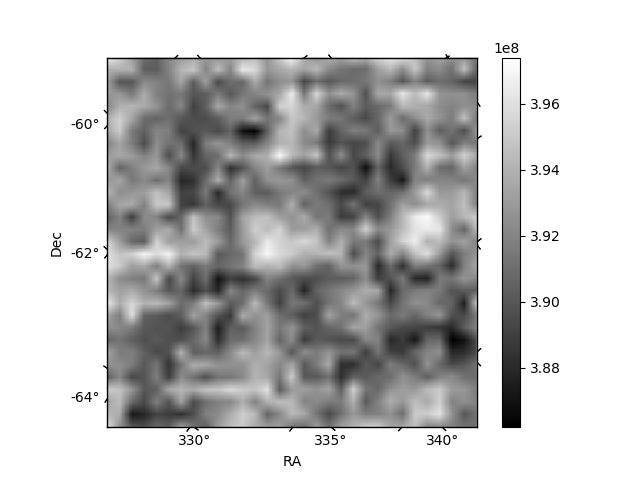
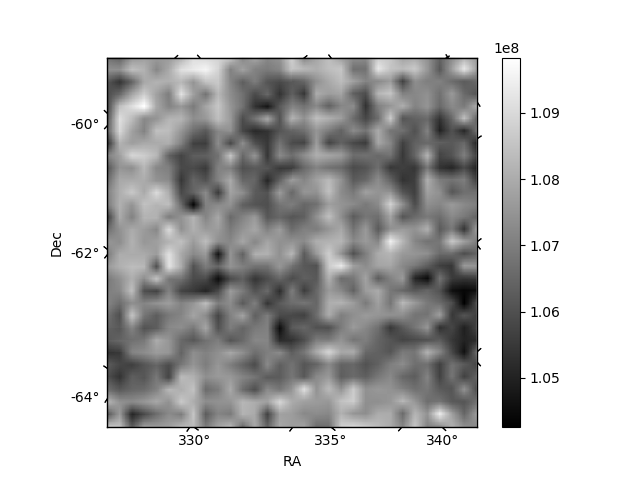
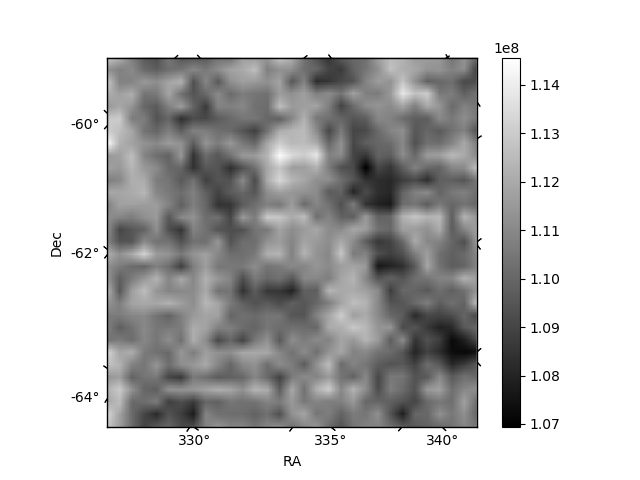
Histogram calculated using DETX and DETY for each event in the final _common_clean file
| Quadrant A | 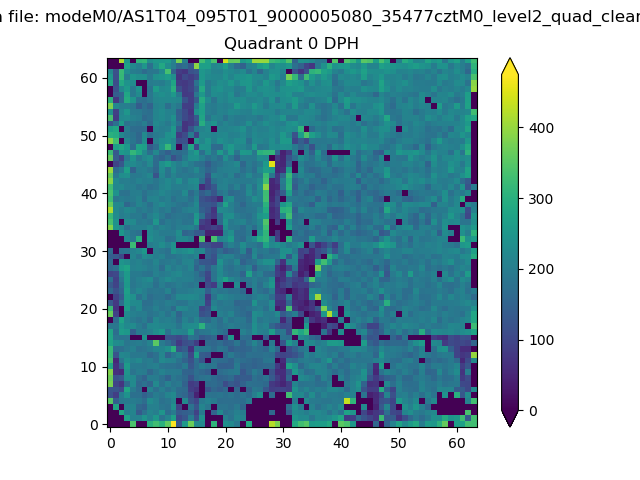 |
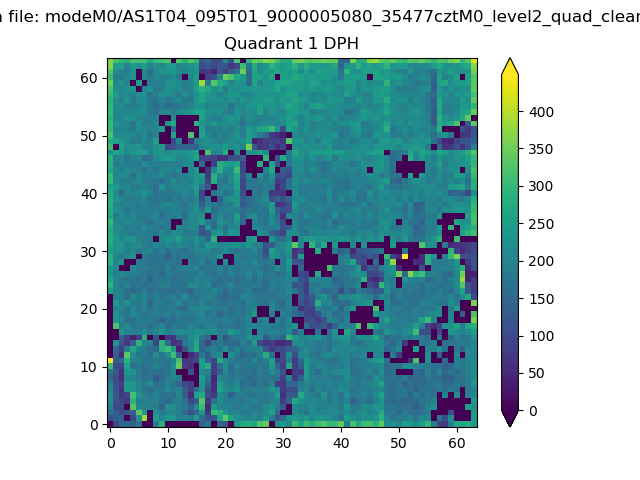 |
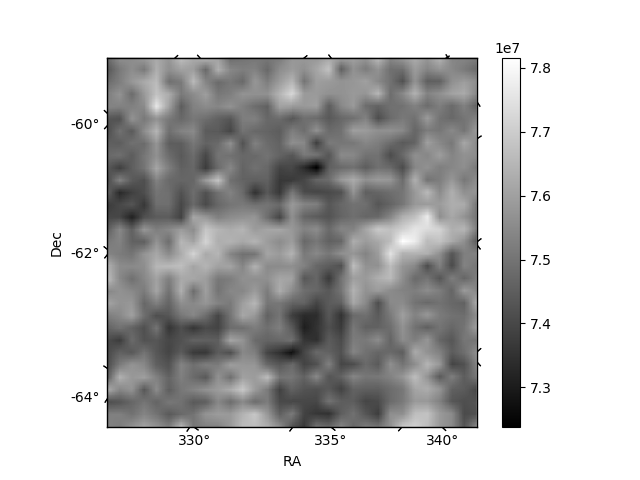
Quadrant B |
|---|---|---|---|
| Quadrant D | 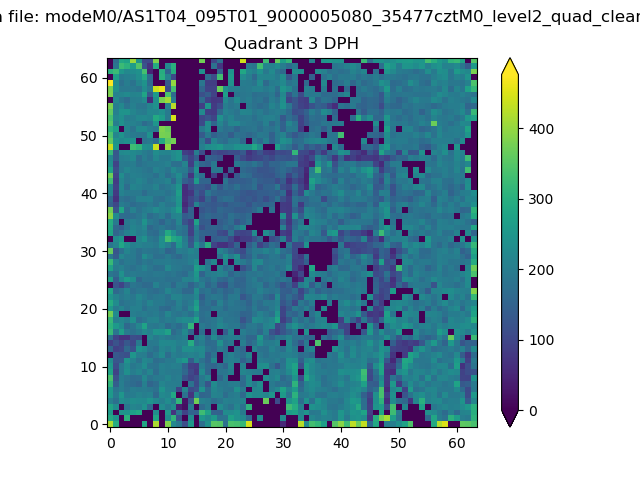 |
 |
Quadrant C |
| Plot type | Count rate plots | Images |
|---|---|---|
| Comparison with Poisson distribution Blue bars denote a histogram of data divided into 1 sec bins. Red curve is a Poisson curve with rate = median count rate of data. |
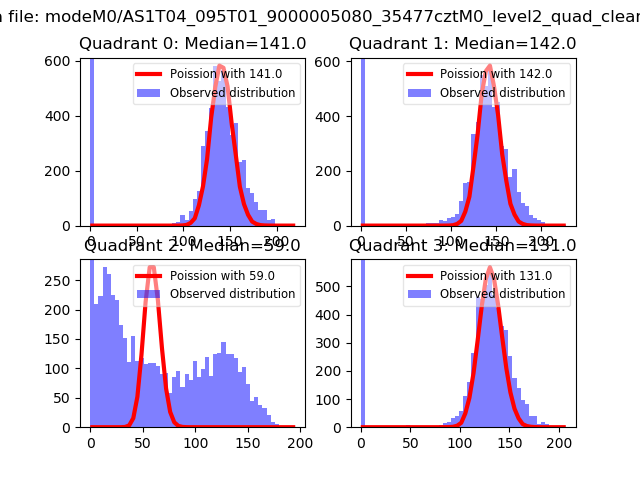 |
 |
| Quadrant-wise count rates Data is divided into 100 sec bins |
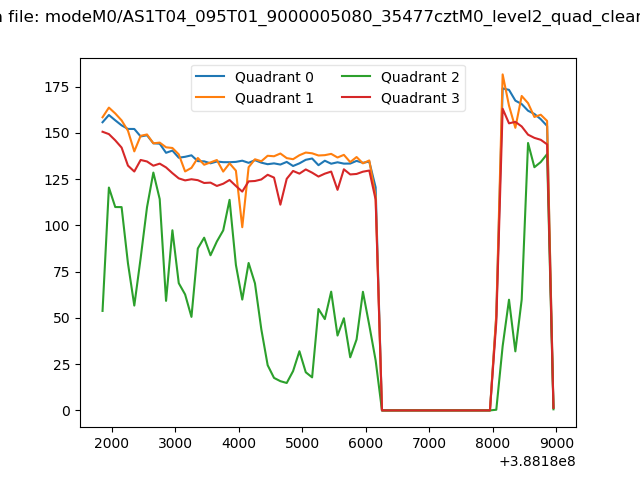 |
|
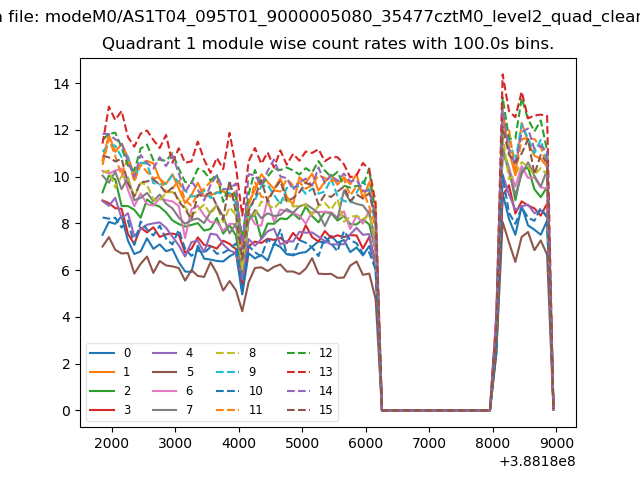
| Module-wise count rates for Quadrant A Data is divided into 100 sec bins |
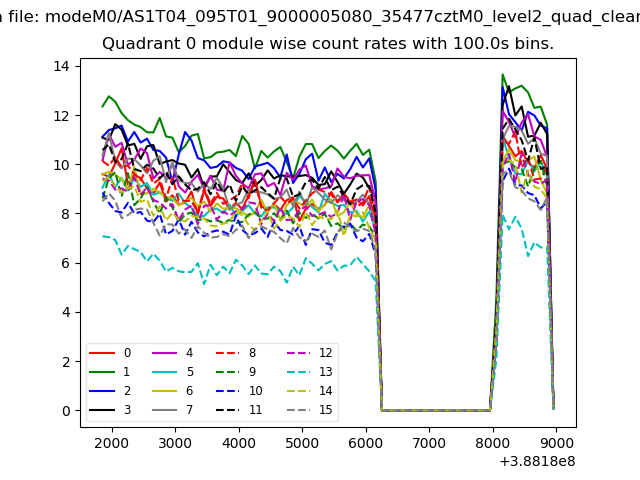 |
 |
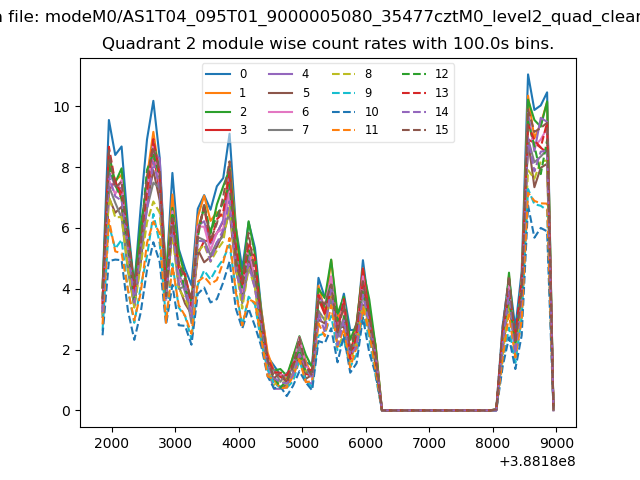
| Module-wise count rates for Quadrant B Data is divided into 100 sec bins |
 |
 |
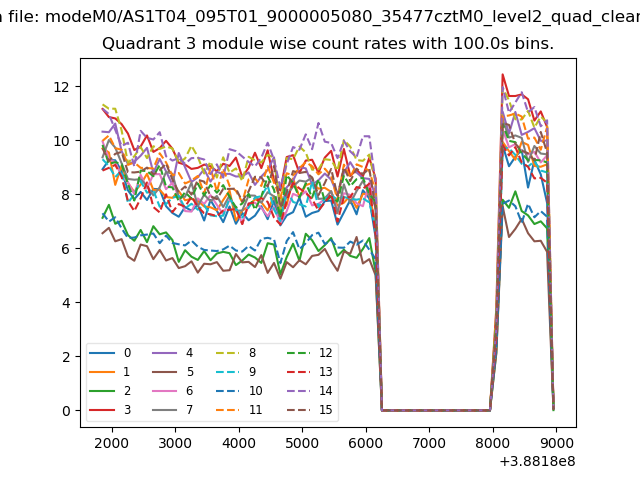
| Module-wise count rates for Quadrant C Data is divided into 100 sec bins |
 |
 |
| Module-wise count rates for Quadrant D Data is divided into 100 sec bins |
 |
 |
| Parameter | Plot |
|---|---|
| CZT HV Monitor | 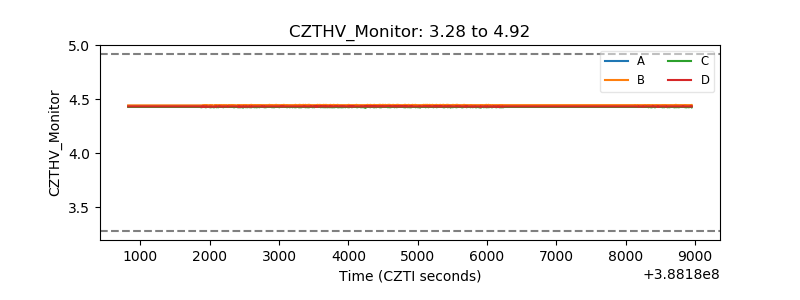 |
| D_VDD | 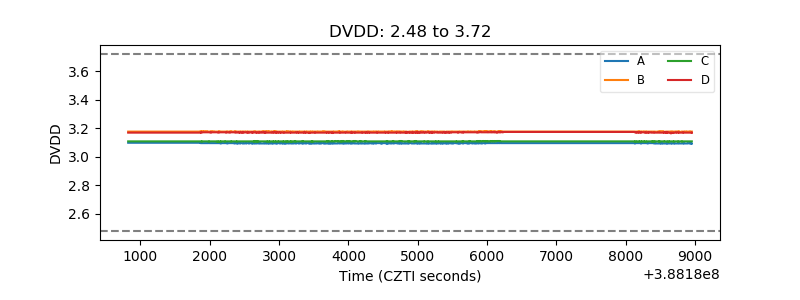 |
| Temperature 1 | 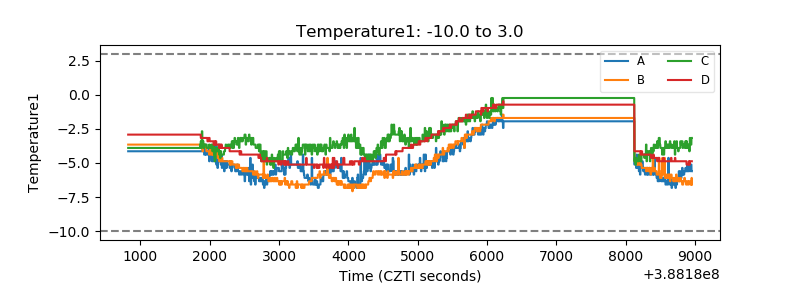 |
| Veto HV Monitor | 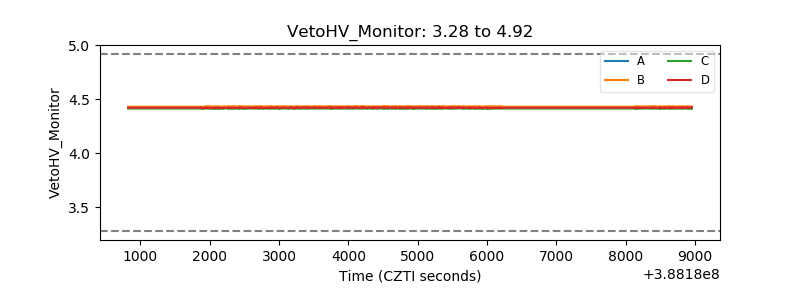 |
| Veto LLD | 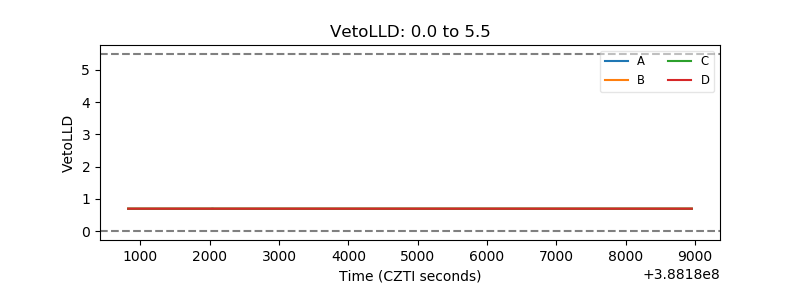 |
| Alpha Counter | 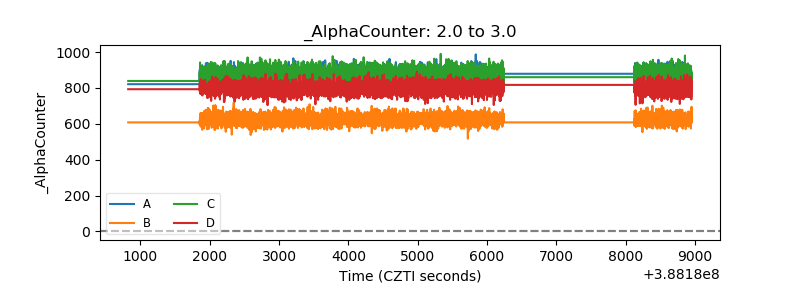 |
| _CPM_Rate |  |
| CZT Counter | 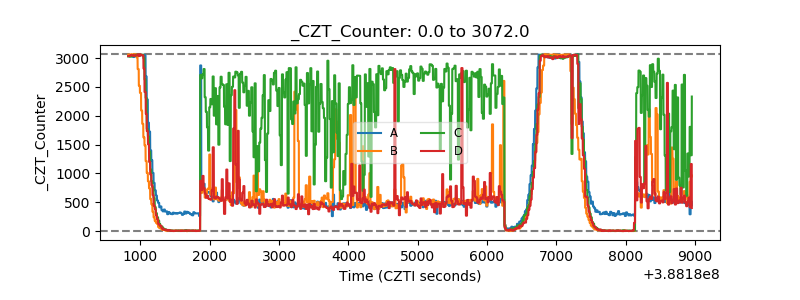 |
| +2.5 Volts monitor | 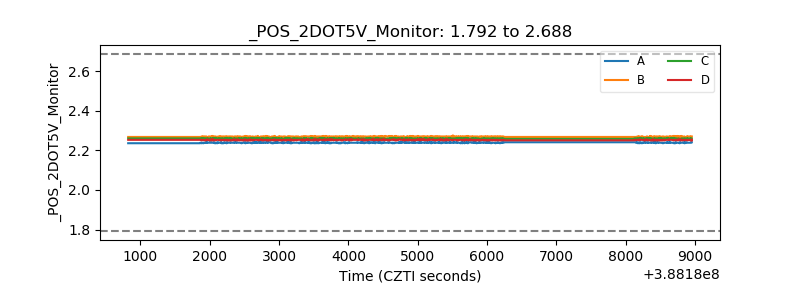 |
| +5 Volts monitor | 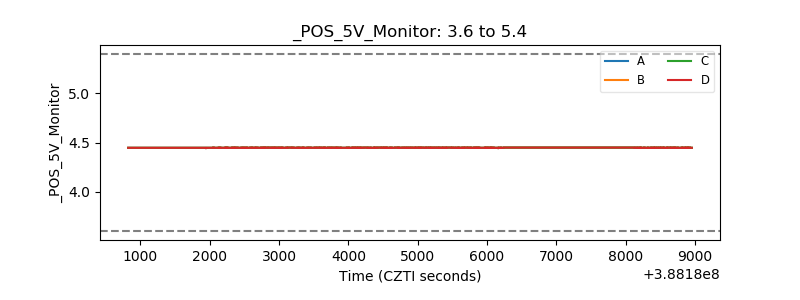 |
| _ROLL_ROT | 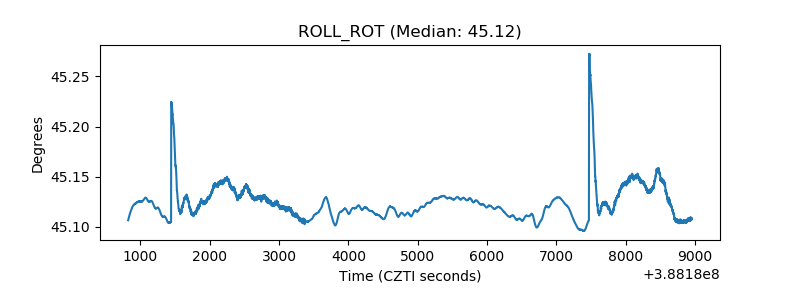 |
| _Roll_DEC | 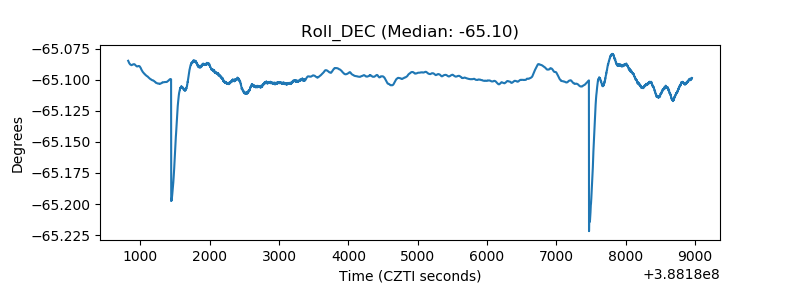 |
| _Roll_RA | 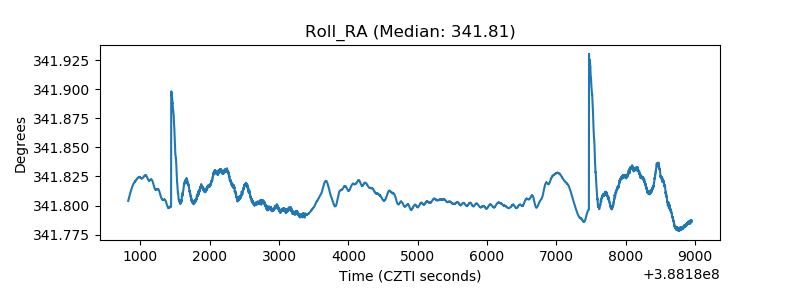 |
| Veto Counter | 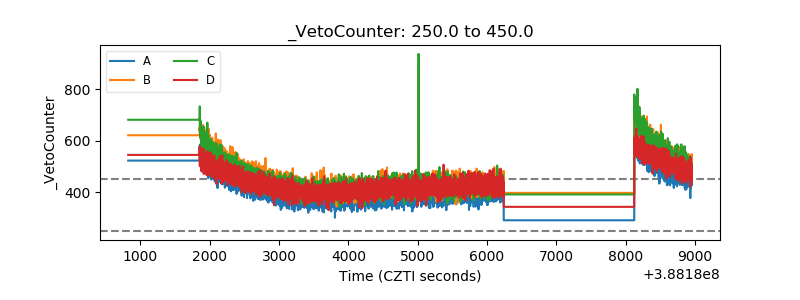 |