| Param | Original file | Final file |
|---|---|---|
| Filename | modeM0/AS1T04_095T01_9000005080cztM0_level2_bc.evt | modeM0/AS1T04_095T01_9000005080cztM0_level2_quad_clean.evt |
| Size (bytes) | 4,575,438,720 | 1,262,854,080 |
| Size | 4.3 GB | 1.2 GB |
| Events in quadrant A | 23,713,588 | 8,866,056 |
| Events in quadrant B | 24,884,104 | 9,020,416 |
| Events in quadrant C | 60,667,583 | 6,871,502 |
| Events in quadrant D | 24,425,617 | 8,565,674 |
| Mode M0 | |||
|---|---|---|---|
| Quadrant | BADHDUFLAG | Total packets | Discarded packets |
| A | 0 | 180580 | 0 |
| B | 0 | 184886 | 0 |
| C | 0 | 340639 | 0 |
| D | 0 | 175782 | 0 |
| Mode M9 | |||
|---|---|---|---|
| Quadrant | BADHDUFLAG | Total packets | Discarded packets |
| A | 0 | 263 | 0 |
| B | 0 | 263 | 0 |
| C | 0 | 263 | 0 |
| D | 0 | 263 | 0 |
| Mode SS | |||
|---|---|---|---|
| Quadrant | BADHDUFLAG | Total packets | Discarded packets |
| A | 0 | 1468 | 0 |
| B | 0 | 1468 | 0 |
| C | 0 | 1468 | 0 |
| D | 0 | 1468 | 0 |
| Quadrant | Total seconds | Saturated seconds | Saturation percentage |
|---|---|---|---|
| A | 71701 | 4470 | 6.234223% |
| B | 71701 | 3149 | 4.391849% |
| C | 71701 | 24274 | 33.854479% |
| D | 71701 | 1932 | 2.694523% |
Noise dominated data is calculated using 1-second bins in cleaned event files. If a bin has >2000 counts, and if more than 50% of those come from <1% of pixels, then it is considered to be noise-dominated and hence unusable.
| Quadrant | # 1 sec bins | Bins with >0 counts | Bins with >2000 counts | High rate bins dominated by noise | Noise dominated (total time) | Noise dominated (detector-on time) | Marked lightcurve |
|---|---|---|---|---|---|---|---|
| A | 98221 | 71717 | 149 | 149 | 0.15% | 0.21% | 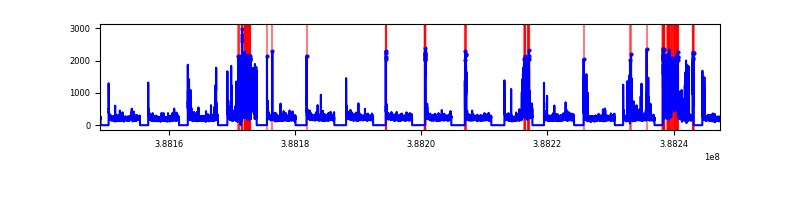 |
| B | 98221 | 71701 | 247 | 247 | 0.25% | 0.34% | 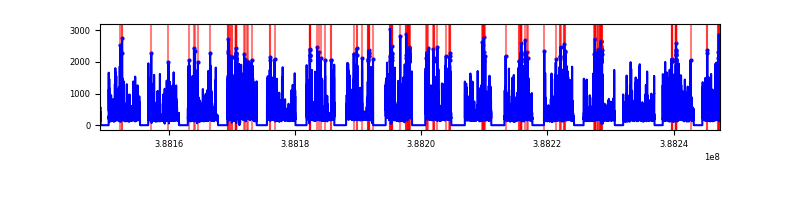 |
| C | 98221 | 71693 | 5445 | 5445 | 5.54% | 7.59% | 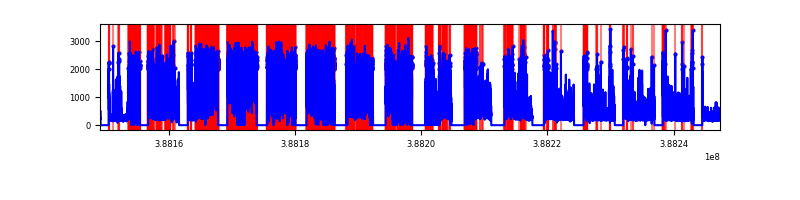 |
| D | 98221 | 71701 | 232 | 232 | 0.24% | 0.32% | 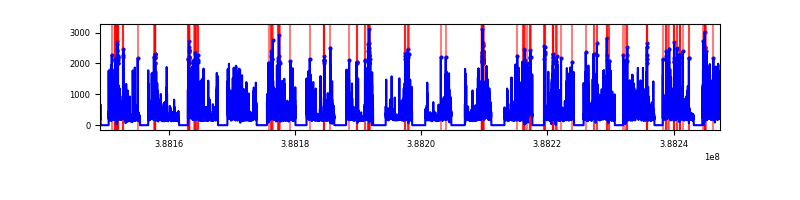 |
Top three noisy pixels from each quadrant. If the there are fewer than three noisy pixels in the level2.evt file, extra rows are filled as -1
| Pixel properties | Quadrant properties | ||||||
|---|---|---|---|---|---|---|---|
| Quadrant | DetID | PixID | Counts | Sigma | Mean | Median | Sigma |
| A | 15 | 169 | 8083444 | 10069.16 | 3629 | 3584 | 802.4 |
| A | 10 | 83 | 1326389 | 1648.49 | 3629 | 3584 | 802.4 |
| A | 13 | 6 | 131759 | 159.73 | 3629 | 3584 | 802.4 |
| B | 5 | 236 | 4783668 | 6581.3 | 3677 | 3602 | 726.3 |
| B | 5 | 172 | 2509196 | 3449.76 | 3677 | 3602 | 726.3 |
| B | 5 | 200 | 1456432 | 2000.29 | 3677 | 3602 | 726.3 |
| C | 4 | 254 | 42299196 | 63149.74 | 2864 | 2839 | 669.8 |
| C | 0 | 207 | 2497957 | 3725.29 | 2864 | 2839 | 669.8 |
| C | 15 | 214 | 2248676 | 3353.1 | 2864 | 2839 | 669.8 |
| D | 8 | 195 | 1869498 | 2174.01 | 3637 | 3532 | 858.3 |
| D | 13 | 249 | 1449718 | 1684.93 | 3637 | 3532 | 858.3 |
| D | 10 | 118 | 1153605 | 1339.93 | 3637 | 3532 | 858.3 |
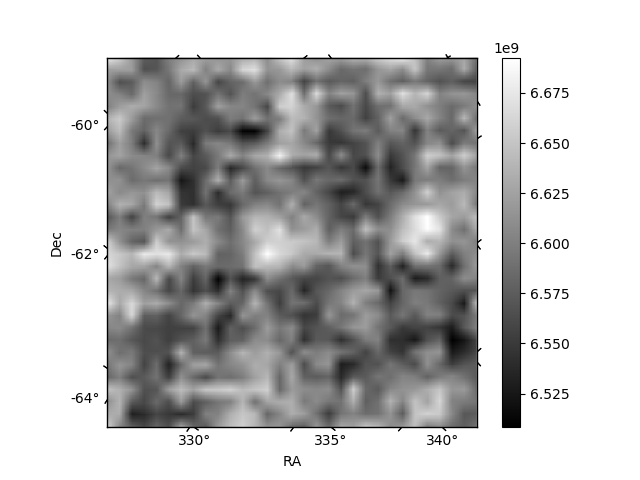
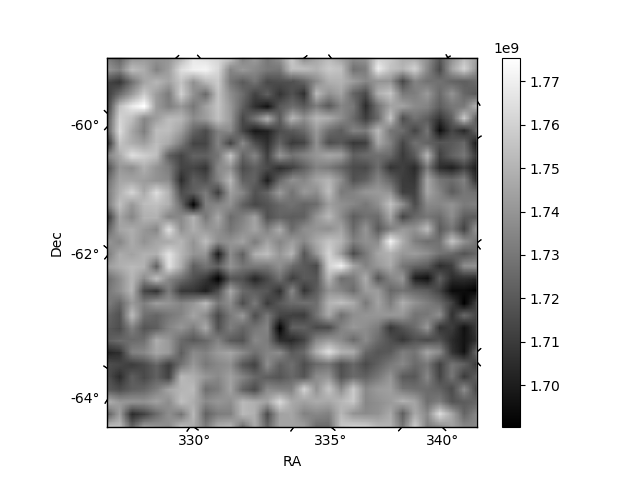
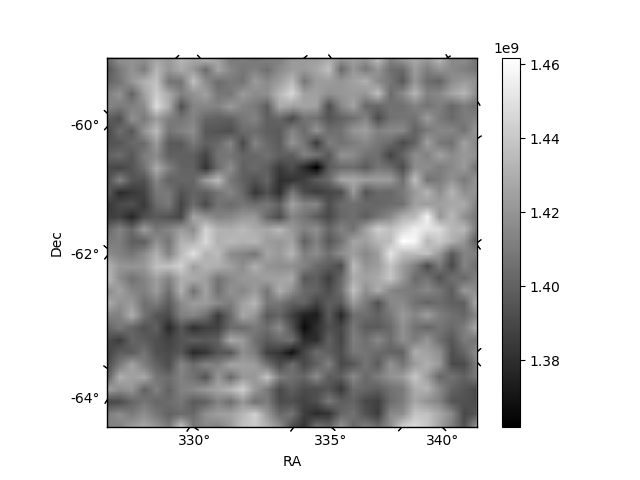
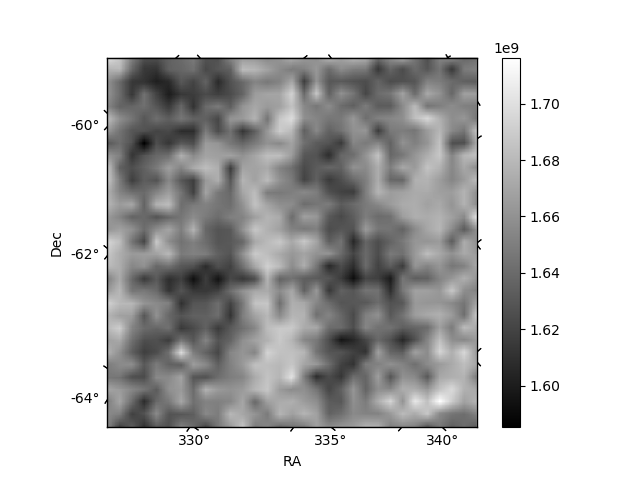
Histogram calculated using DETX and DETY for each event in the final _common_clean file
| Quadrant A | 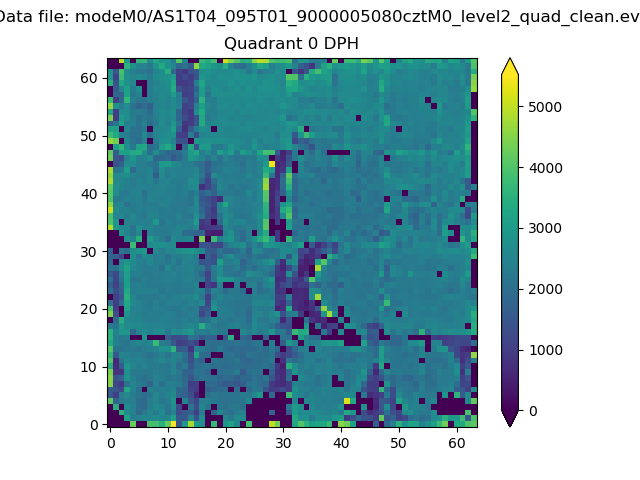 |
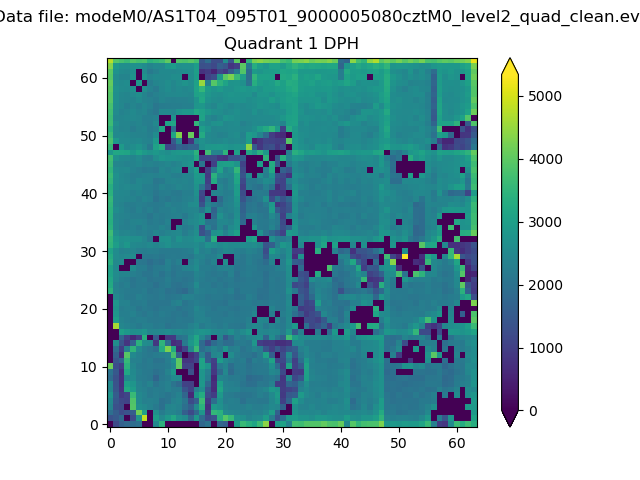 |
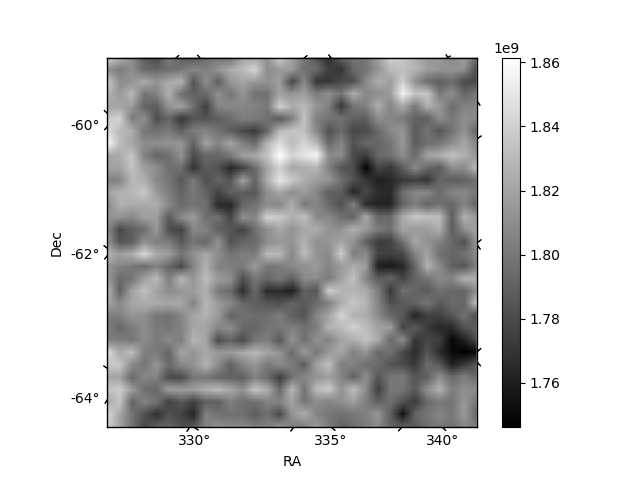
Quadrant B |
|---|---|---|---|
| Quadrant D | 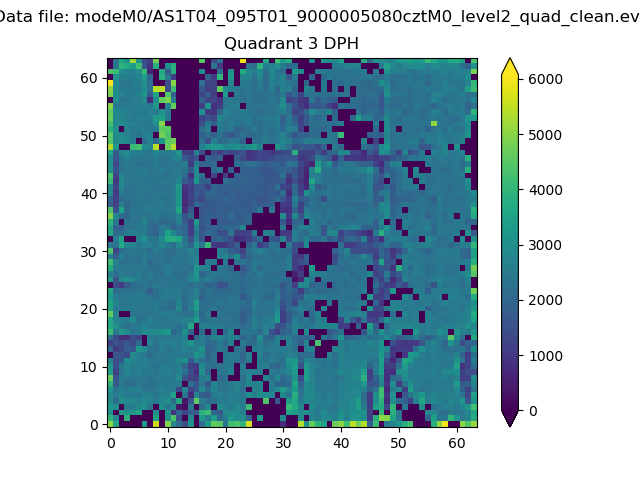 |
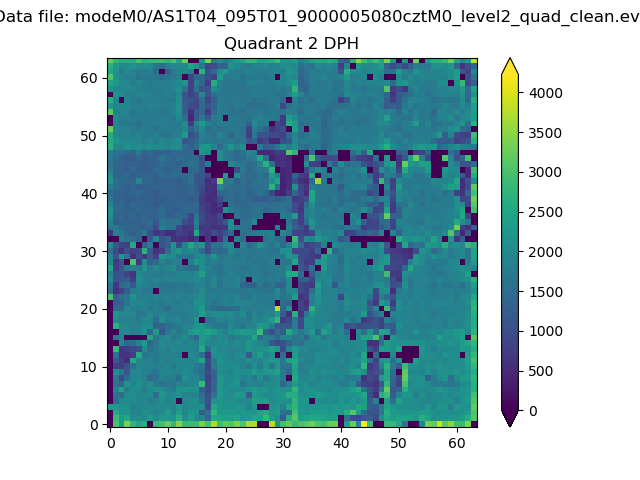 |
Quadrant C |
| Plot type | Count rate plots | Images |
|---|---|---|
| Comparison with Poisson distribution Blue bars denote a histogram of data divided into 1 sec bins. Red curve is a Poisson curve with rate = median count rate of data. |
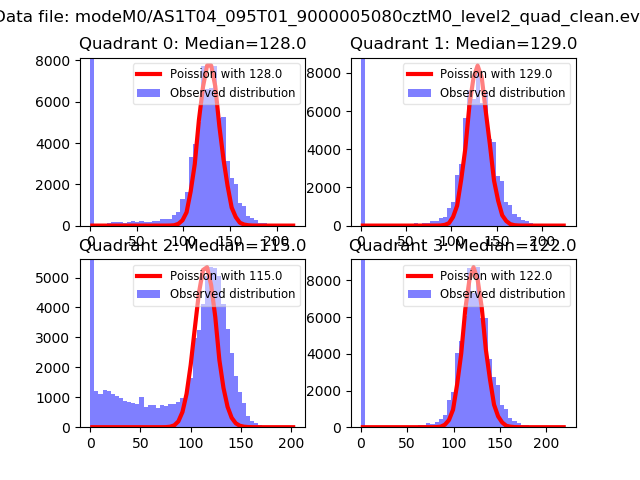 |
 |
| Quadrant-wise count rates Data is divided into 100 sec bins |
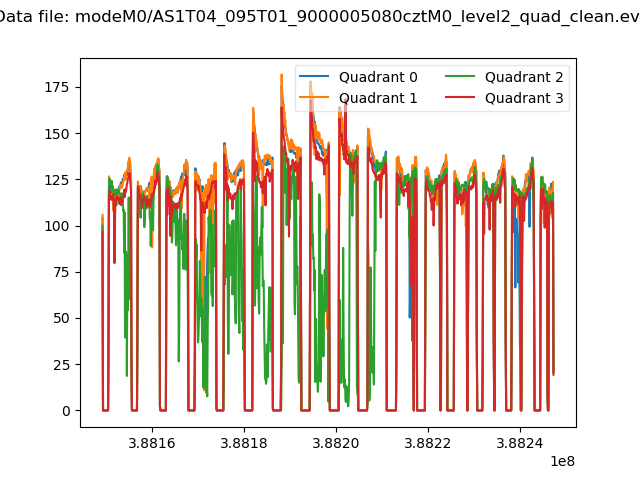 |
|
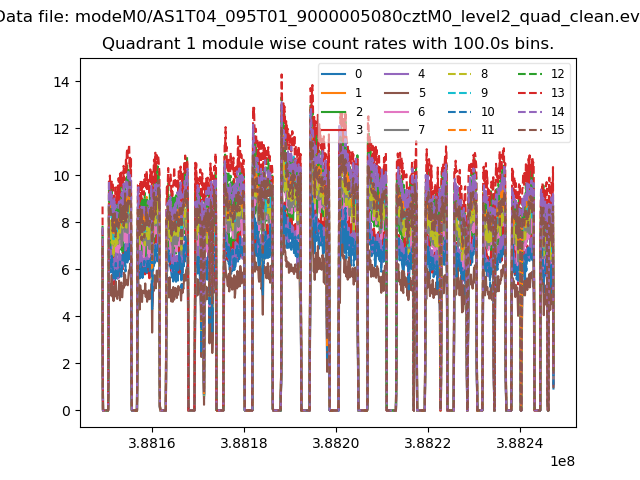
| Module-wise count rates for Quadrant A Data is divided into 100 sec bins |
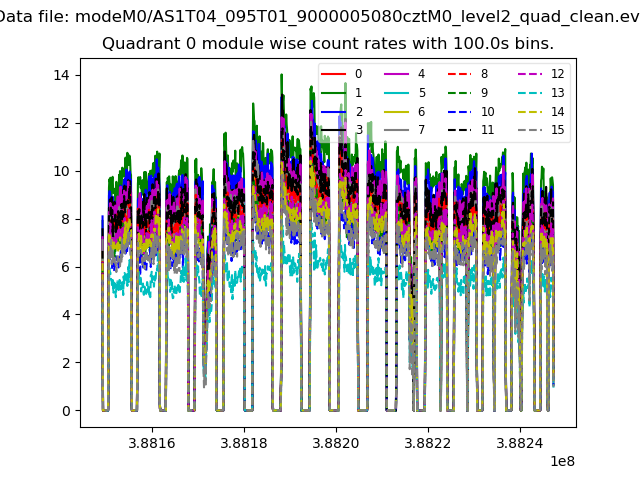 |
 |
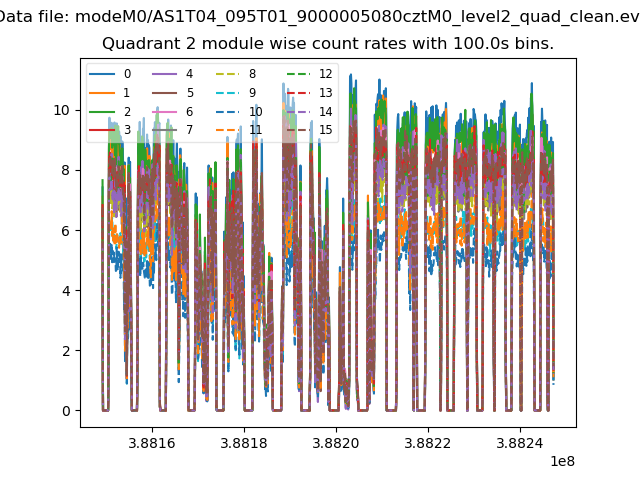
| Module-wise count rates for Quadrant B Data is divided into 100 sec bins |
 |
 |
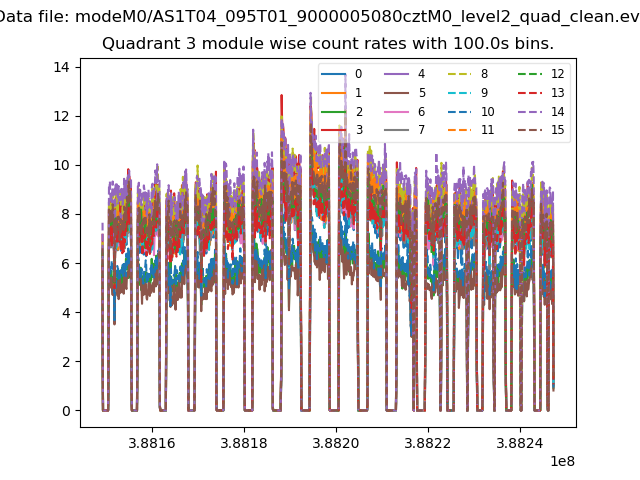
| Module-wise count rates for Quadrant C Data is divided into 100 sec bins |
 |
 |
| Module-wise count rates for Quadrant D Data is divided into 100 sec bins |
 |
 |
| Parameter | Plot |
|---|---|
| CZT HV Monitor | 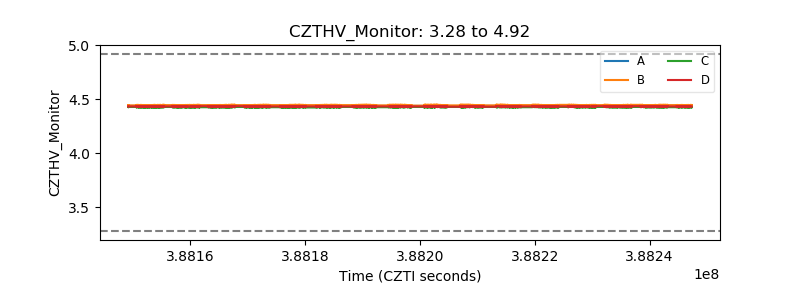 |
| D_VDD | 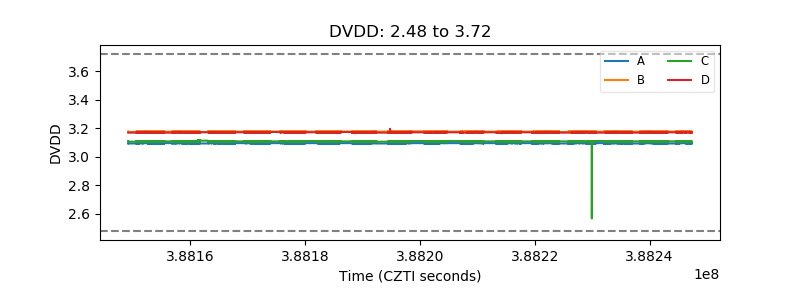 |
| Temperature 1 | 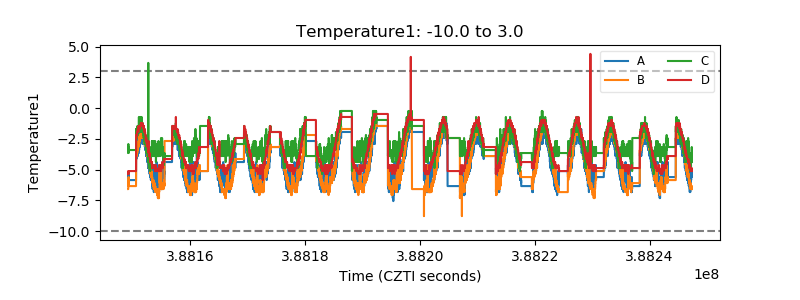 |
| Veto HV Monitor | 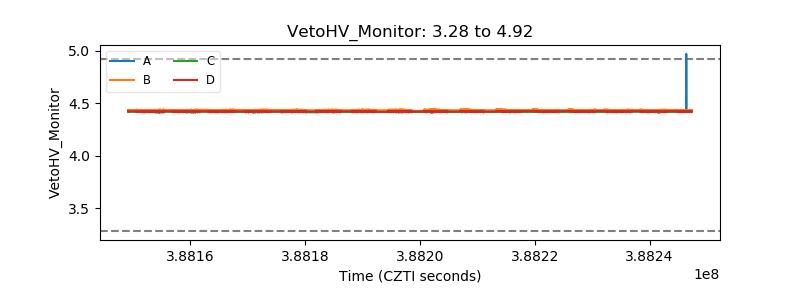 |
| Veto LLD | 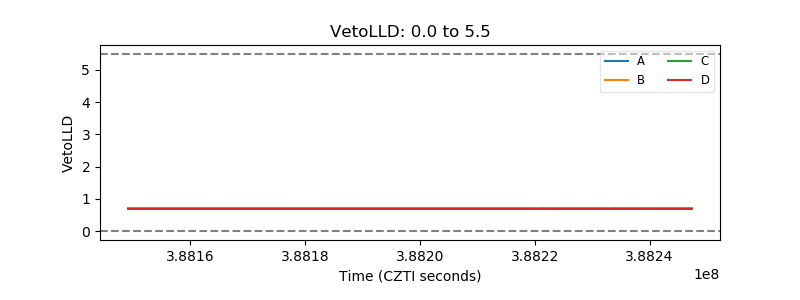 |
| Alpha Counter | 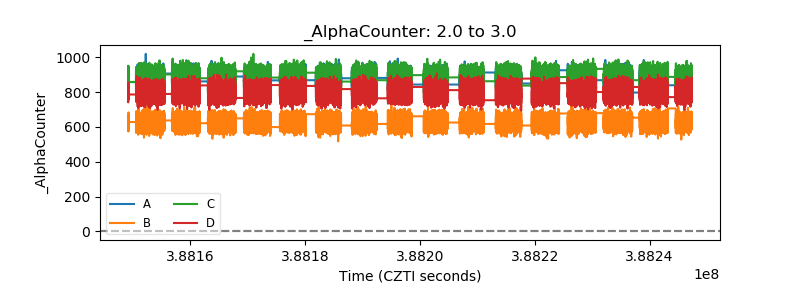 |
| _CPM_Rate | 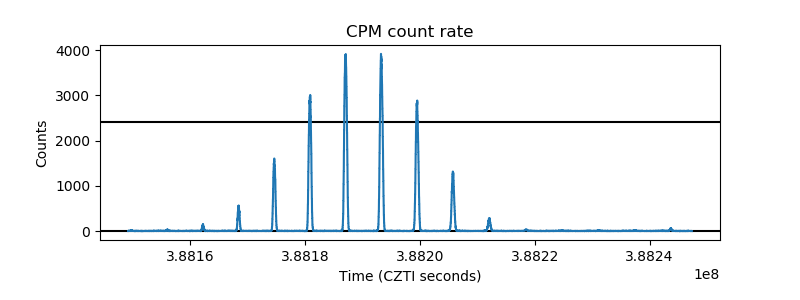 |
| CZT Counter | 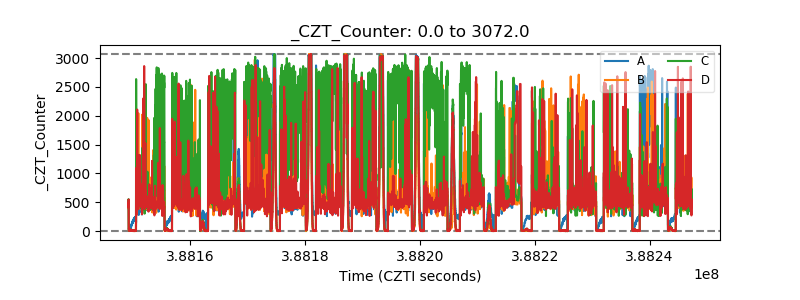 |
| +2.5 Volts monitor | 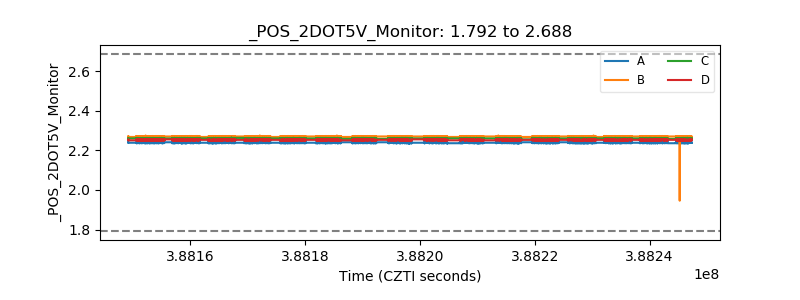 |
| +5 Volts monitor | 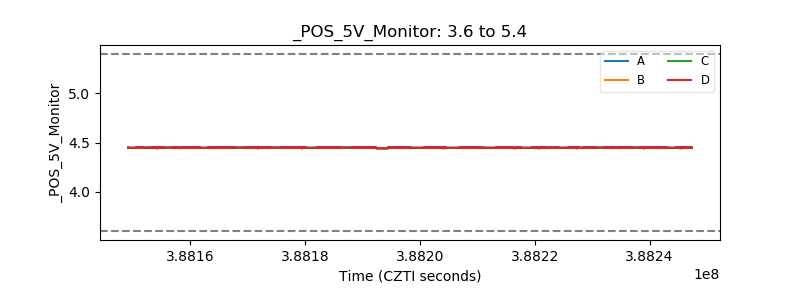 |
| _ROLL_ROT | 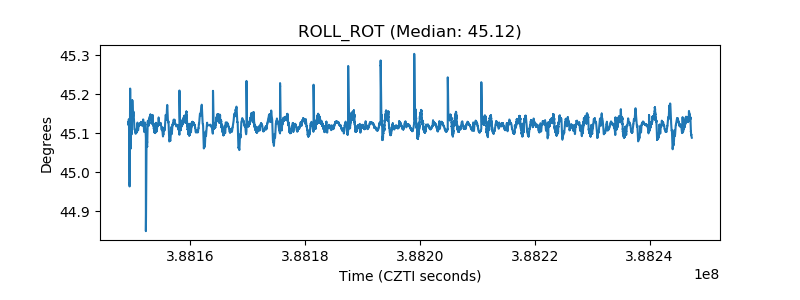 |
| _Roll_DEC | 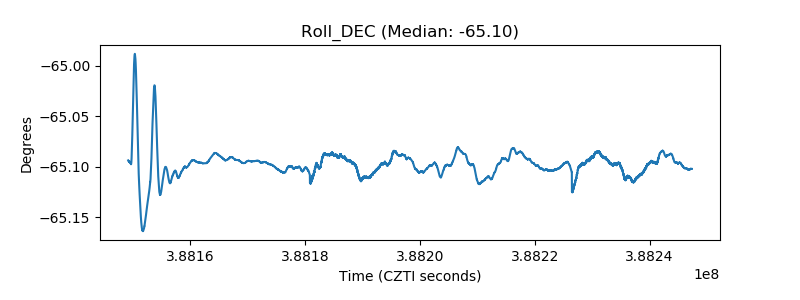 |
| _Roll_RA | 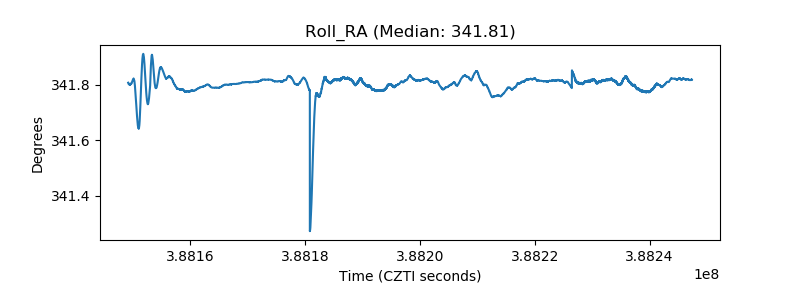 |
| Veto Counter | 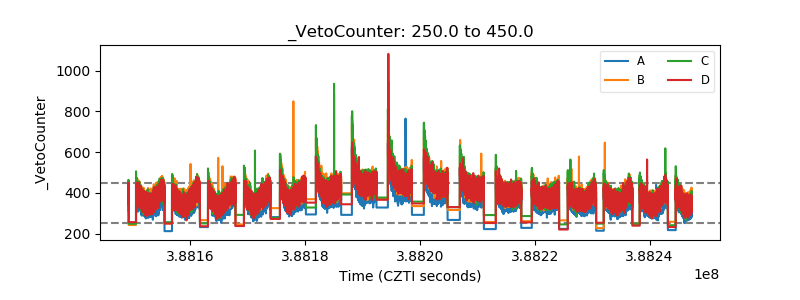 |