| Param | Original file | Final file |
|---|---|---|
| Filename | modeM0/AS1A11_095T06_9000005078_35470cztM0_level2.evt | modeM0/AS1A11_095T06_9000005078_35470cztM0_level2_quad_clean.evt |
| Size (bytes) | 323,424,000 | 67,268,160 |
| Size | 308.4 MB | 64.2 MB |
| Events in quadrant A | 2,154,476 | 434,932 |
| Events in quadrant B | 2,173,329 | 441,613 |
| Events in quadrant C | 2,802,488 | 427,416 |
| Events in quadrant D | 2,353,324 | 411,938 |
| Mode M9 | |||
|---|---|---|---|
| Quadrant | BADHDUFLAG | Total packets | Discarded packets |
| A | 0 | 14 | 0 |
| B | 0 | 14 | 0 |
| C | 0 | 14 | 0 |
| D | 0 | 14 | 0 |
| Mode M0 | |||
|---|---|---|---|
| Quadrant | BADHDUFLAG | Total packets | Discarded packets |
| A | 0 | 9260 | 1 |
| B | 0 | 9401 | 1 |
| C | 0 | 11019 | 1 |
| D | 0 | 9914 | 1 |
| Mode SS | |||
|---|---|---|---|
| Quadrant | BADHDUFLAG | Total packets | Discarded packets |
| A | 0 | 94 | 0 |
| B | 0 | 94 | 0 |
| C | 0 | 94 | 0 |
| D | 0 | 94 | 0 |
| Quadrant | Total seconds | Saturated seconds | Saturation percentage |
|---|---|---|---|
| A | 4563 | 3 | 0.065746% |
| B | 4563 | 26 | 0.569801% |
| C | 4563 | 88 | 1.928556% |
| D | 4563 | 31 | 0.679378% |
Noise dominated data is calculated using 1-second bins in cleaned event files. If a bin has >2000 counts, and if more than 50% of those come from <1% of pixels, then it is considered to be noise-dominated and hence unusable.
| Quadrant | # 1 sec bins | Bins with >0 counts | Bins with >2000 counts | High rate bins dominated by noise | Noise dominated (total time) | Noise dominated (detector-on time) | Marked lightcurve |
|---|---|---|---|---|---|---|---|
| A | 5967 | 4564 | 0 | 0 | 0.00% | 0.00% | 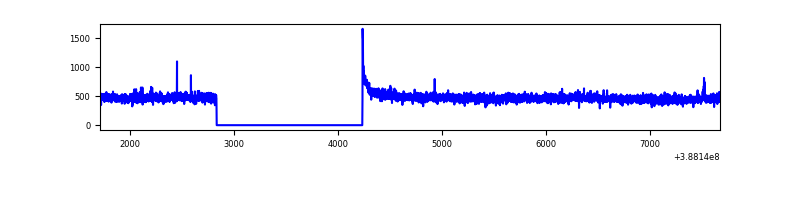 |
| B | 5967 | 4564 | 15 | 15 | 0.25% | 0.33% | 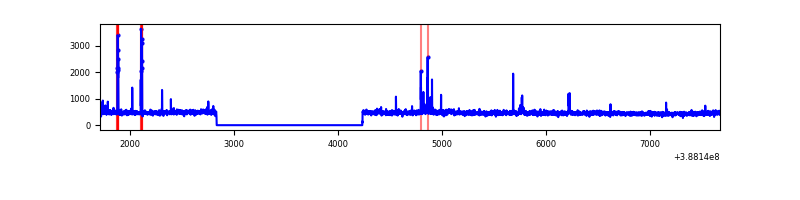 |
| C | 5967 | 4564 | 63 | 63 | 1.06% | 1.38% | 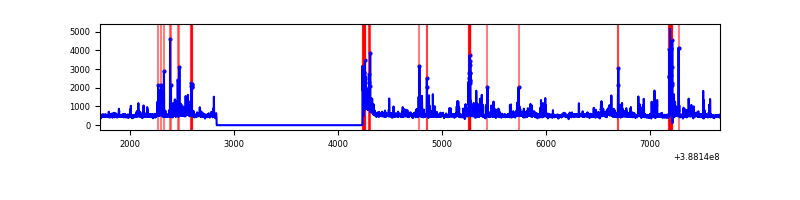 |
| D | 5967 | 4564 | 23 | 23 | 0.39% | 0.50% | 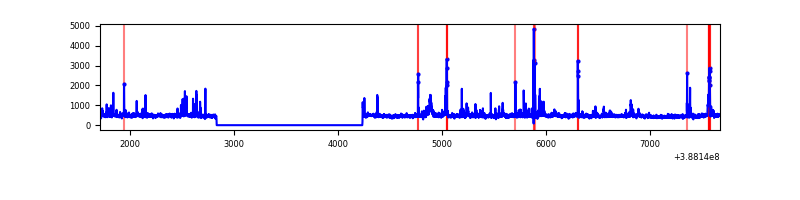 |
Top three noisy pixels from each quadrant. If the there are fewer than three noisy pixels in the level2.evt file, extra rows are filled as -1
| Pixel properties | Quadrant properties | ||||||
|---|---|---|---|---|---|---|---|
| Quadrant | DetID | PixID | Counts | Sigma | Mean | Median | Sigma |
| A | 10 | 83 | 79959 | 724.15 | 532 | 520 | 109.7 |
| A | 13 | 6 | 9844 | 85.0 | 532 | 520 | 109.7 |
| A | 13 | 254 | 6204 | 51.81 | 532 | 520 | 109.7 |
| B | 5 | 172 | 73519 | 711.44 | 526 | 511 | 102.6 |
| B | 5 | 236 | 29470 | 282.19 | 526 | 511 | 102.6 |
| B | 12 | 111 | 12855 | 120.29 | 526 | 511 | 102.6 |
| C | 0 | 207 | 353681 | 2936.08 | 513 | 516 | 120.3 |
| C | 0 | 10 | 250819 | 2080.93 | 513 | 516 | 120.3 |
| C | 15 | 214 | 184974 | 1533.52 | 513 | 516 | 120.3 |
| D | 13 | 249 | 79592 | 619.64 | 517 | 502 | 127.6 |
| D | 8 | 195 | 54242 | 421.03 | 517 | 502 | 127.6 |
| D | 12 | 6 | 42055 | 325.55 | 517 | 502 | 127.6 |
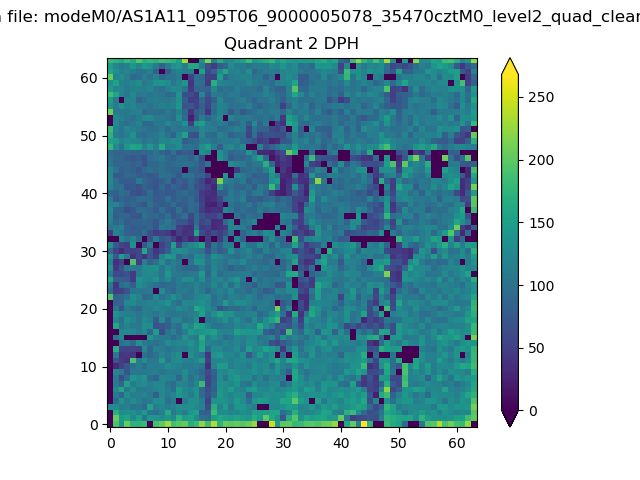
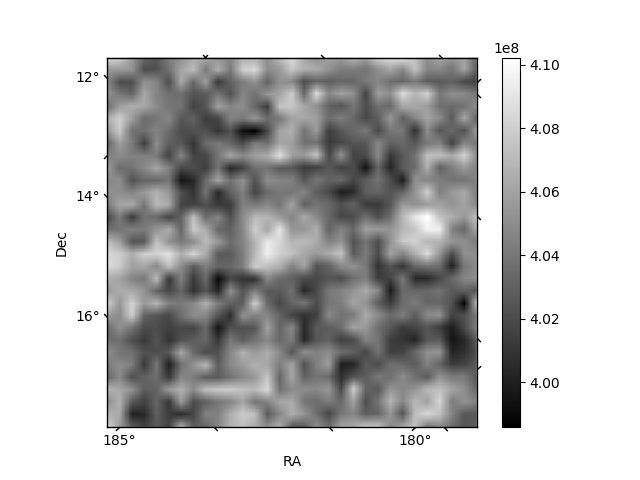
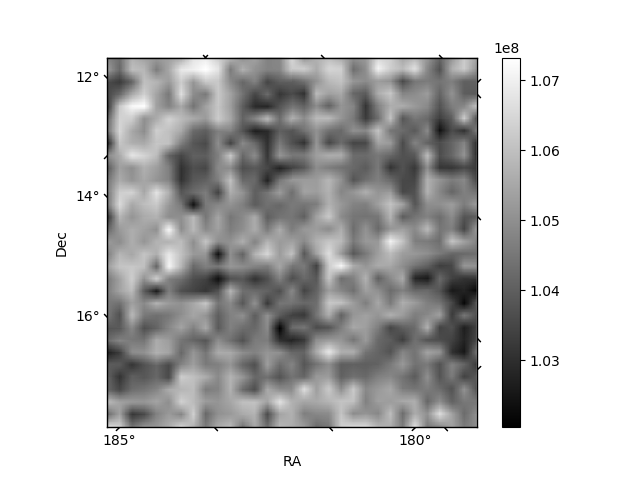
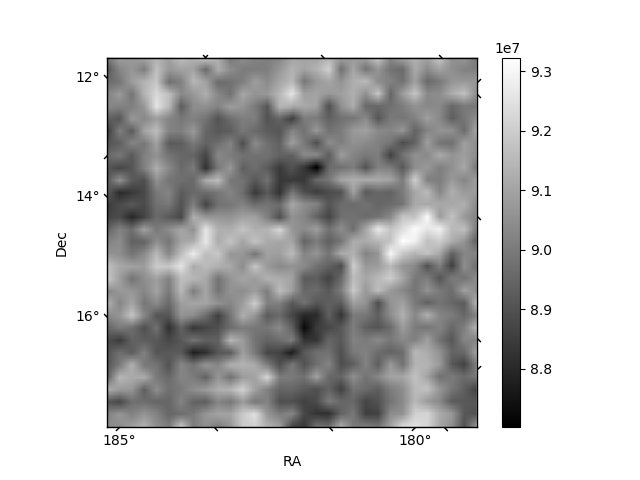
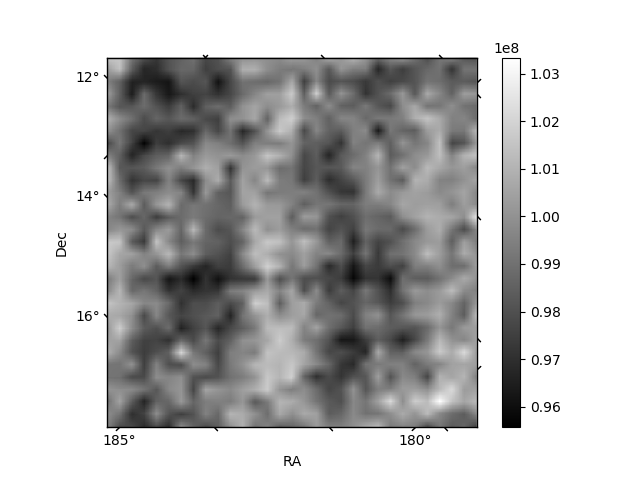
Histogram calculated using DETX and DETY for each event in the final _common_clean file
| Quadrant A | 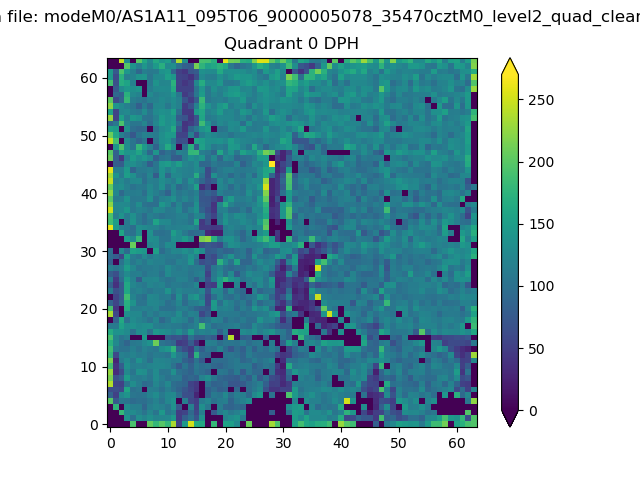 |
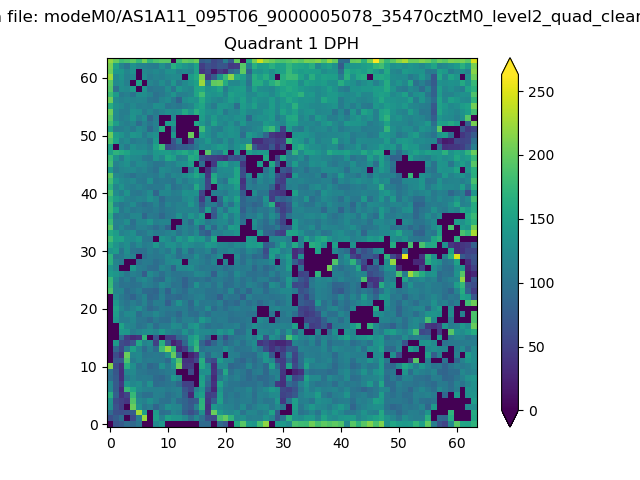 |
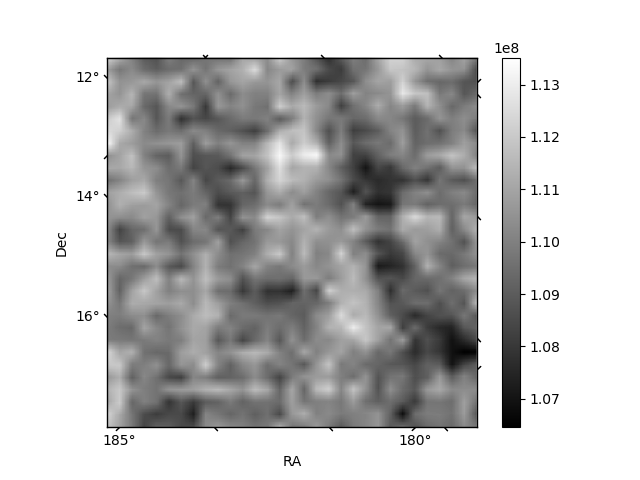
Quadrant B |
|---|---|---|---|
| Quadrant D | 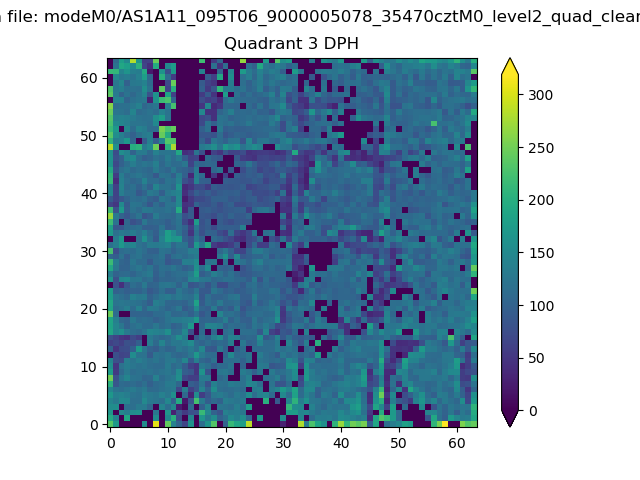 |
 |
Quadrant C |
| Plot type | Count rate plots | Images |
|---|---|---|
| Comparison with Poisson distribution Blue bars denote a histogram of data divided into 1 sec bins. Red curve is a Poisson curve with rate = median count rate of data. |
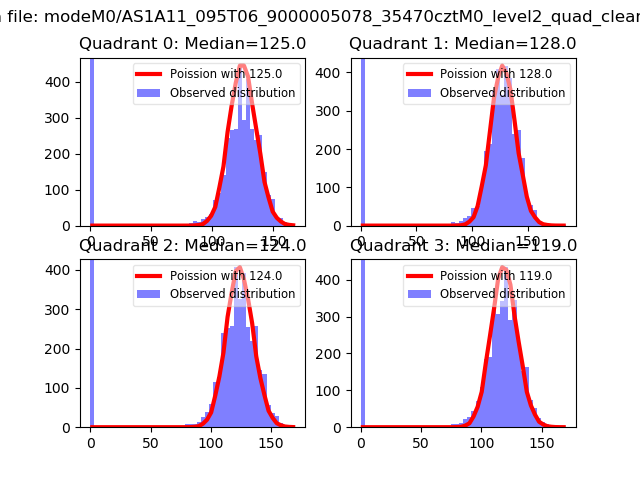 |
 |
| Quadrant-wise count rates Data is divided into 100 sec bins |
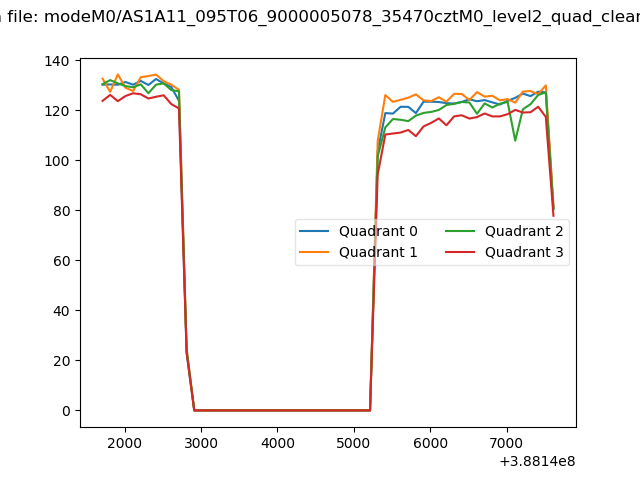 |
|
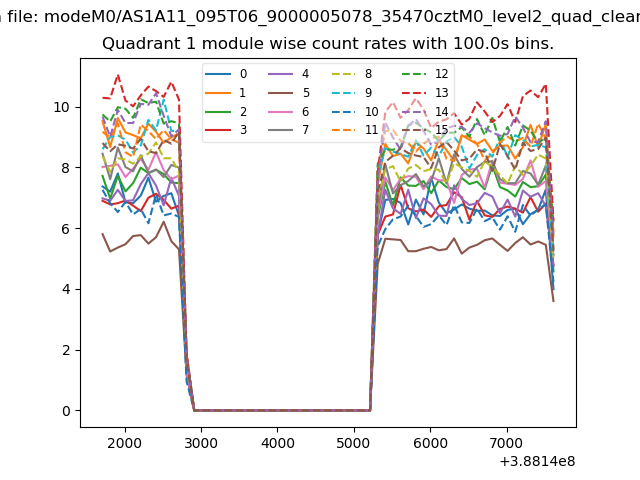
| Module-wise count rates for Quadrant A Data is divided into 100 sec bins |
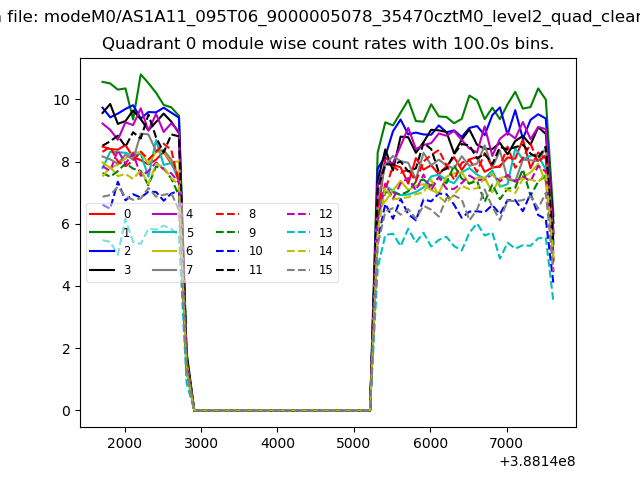 |
 |
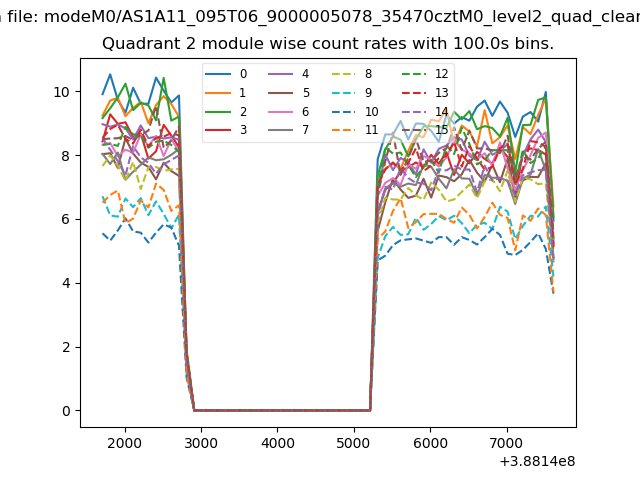
| Module-wise count rates for Quadrant B Data is divided into 100 sec bins |
 |
 |
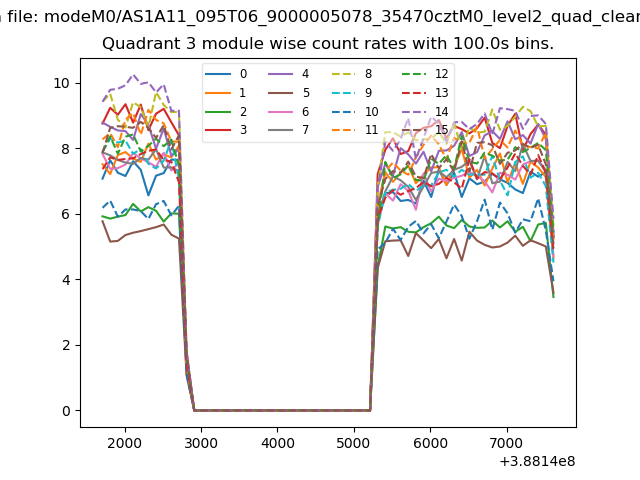
| Module-wise count rates for Quadrant C Data is divided into 100 sec bins |
 |
 |
| Module-wise count rates for Quadrant D Data is divided into 100 sec bins |
 |
 |
| Parameter | Plot |
|---|---|
| CZT HV Monitor | 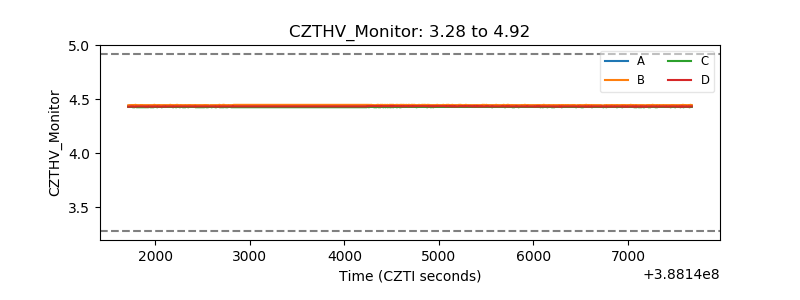 |
| D_VDD | 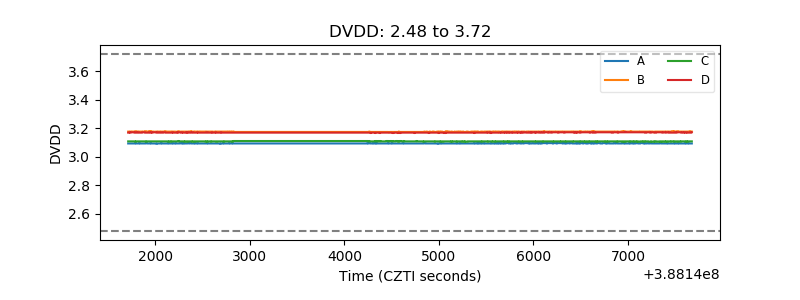 |
| Temperature 1 | 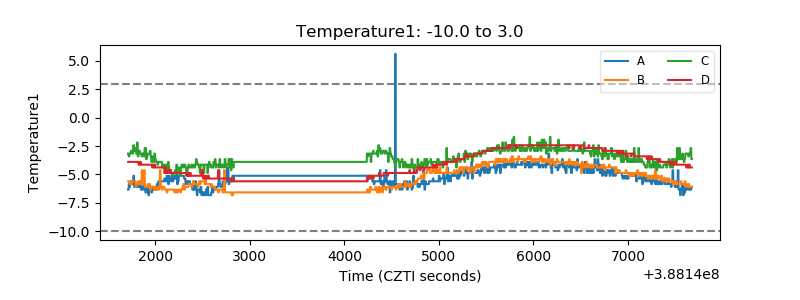 |
| Veto HV Monitor | 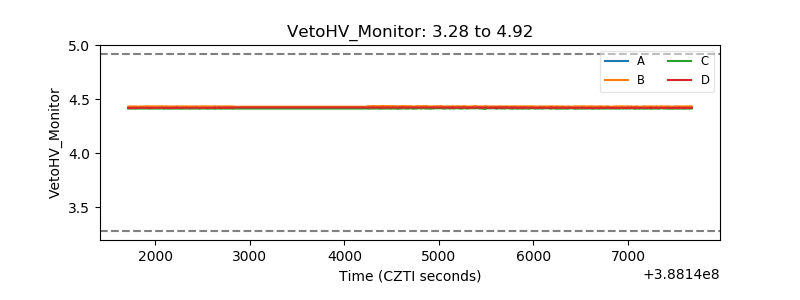 |
| Veto LLD | 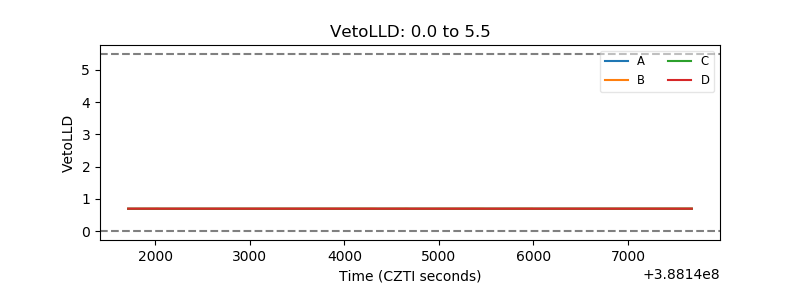 |
| Alpha Counter | 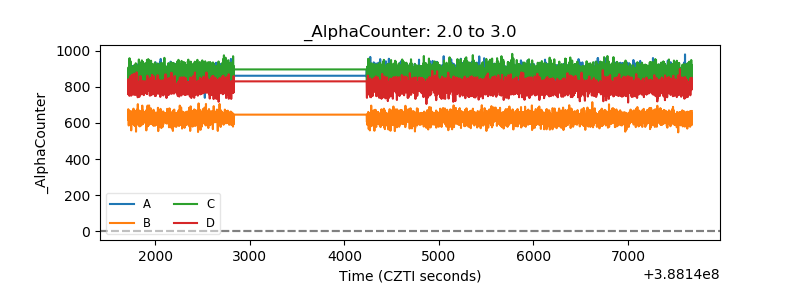 |
| _CPM_Rate | 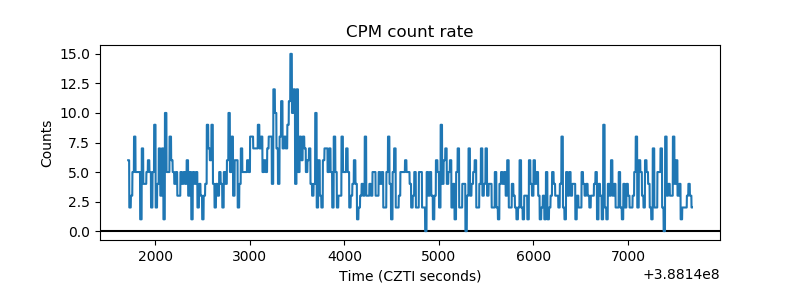 |
| CZT Counter | 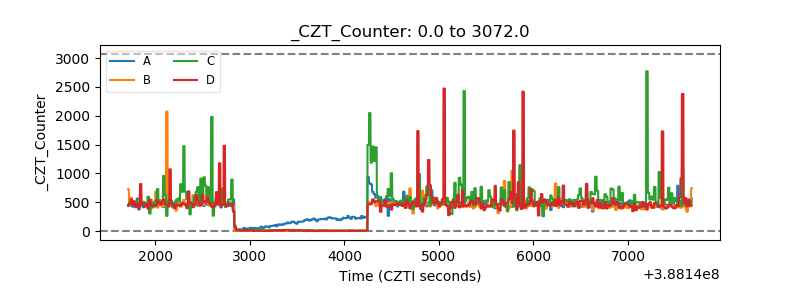 |
| +2.5 Volts monitor | 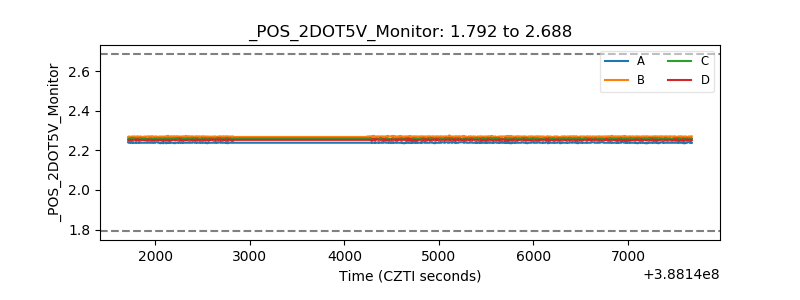 |
| +5 Volts monitor | 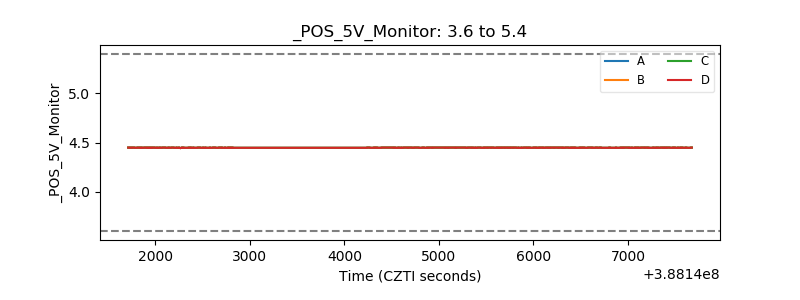 |
| _ROLL_ROT | 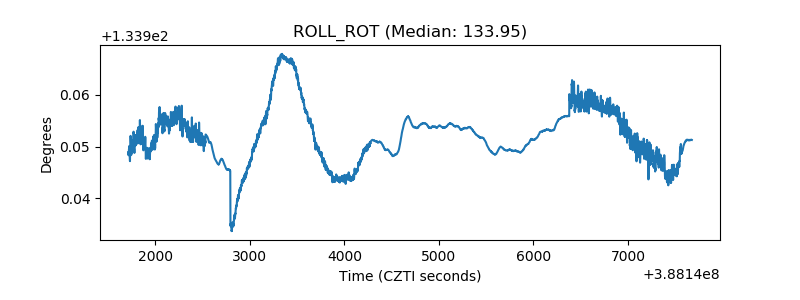 |
| _Roll_DEC | 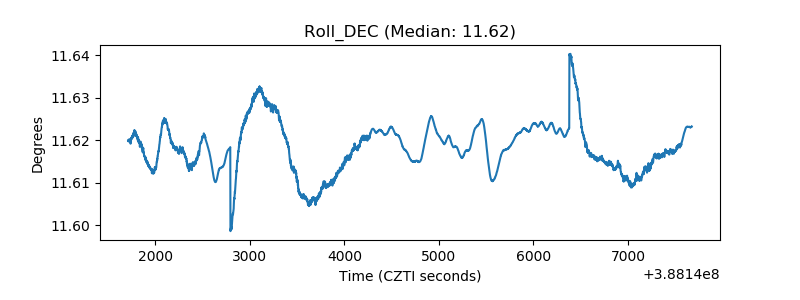 |
| _Roll_RA | 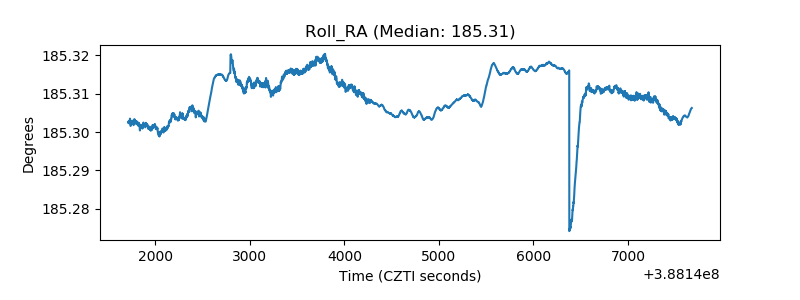 |
| Veto Counter | 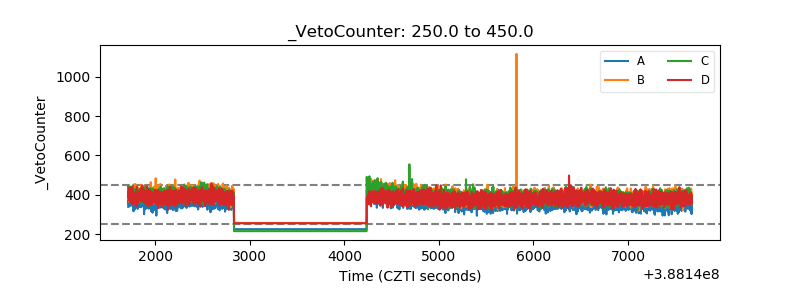 |