| Param | Original file | Final file |
|---|---|---|
| Filename | modeM0/AS1A11_095T06_9000005078_35468cztM0_level2.evt | modeM0/AS1A11_095T06_9000005078_35468cztM0_level2_quad_clean.evt |
| Size (bytes) | 405,673,920 | 60,050,880 |
| Size | 386.9 MB | 57.3 MB |
| Events in quadrant A | 2,702,618 | 363,170 |
| Events in quadrant B | 2,708,239 | 368,940 |
| Events in quadrant C | 3,144,510 | 358,777 |
| Events in quadrant D | 3,353,084 | 338,863 |
| Mode M9 | |||
|---|---|---|---|
| Quadrant | BADHDUFLAG | Total packets | Discarded packets |
| A | 0 | 36 | 0 |
| B | 0 | 36 | 0 |
| C | 0 | 36 | 0 |
| D | 0 | 36 | 0 |
| Mode M0 | |||
|---|---|---|---|
| Quadrant | BADHDUFLAG | Total packets | Discarded packets |
| A | 0 | 11335 | 3 |
| B | 0 | 11506 | 2 |
| C | 0 | 12447 | 2 |
| D | 0 | 13598 | 2 |
| Mode SS | |||
|---|---|---|---|
| Quadrant | BADHDUFLAG | Total packets | Discarded packets |
| A | 0 | 116 | 0 |
| B | 0 | 116 | 0 |
| C | 0 | 116 | 0 |
| D | 0 | 116 | 0 |
| Quadrant | Total seconds | Saturated seconds | Saturation percentage |
|---|---|---|---|
| A | 5547 | 8 | 0.144222% |
| B | 5547 | 20 | 0.360555% |
| C | 5547 | 70 | 1.261943% |
| D | 5547 | 164 | 2.956553% |
Noise dominated data is calculated using 1-second bins in cleaned event files. If a bin has >2000 counts, and if more than 50% of those come from <1% of pixels, then it is considered to be noise-dominated and hence unusable.
| Quadrant | # 1 sec bins | Bins with >0 counts | Bins with >2000 counts | High rate bins dominated by noise | Noise dominated (total time) | Noise dominated (detector-on time) | Marked lightcurve |
|---|---|---|---|---|---|---|---|
| A | 9192 | 5549 | 0 | 0 | 0.00% | 0.00% | 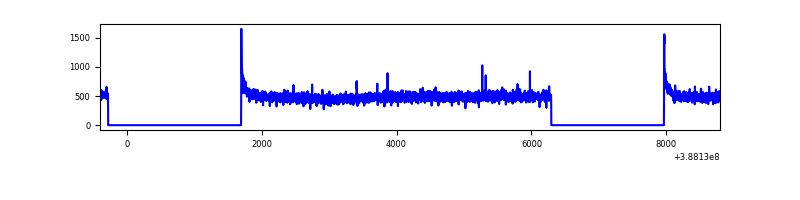 |
| B | 9192 | 5549 | 4 | 4 | 0.04% | 0.07% | 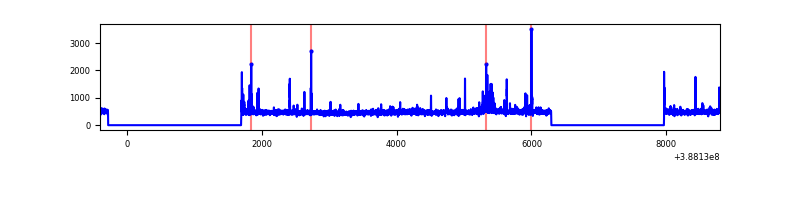 |
| C | 9192 | 5549 | 46 | 46 | 0.50% | 0.83% | 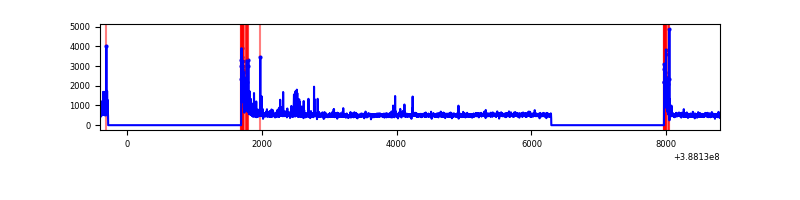 |
| D | 9192 | 5549 | 154 | 154 | 1.68% | 2.78% | 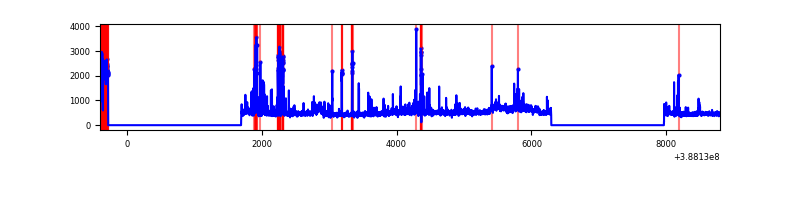 |
Top three noisy pixels from each quadrant. If the there are fewer than three noisy pixels in the level2.evt file, extra rows are filled as -1
| Pixel properties | Quadrant properties | ||||||
|---|---|---|---|---|---|---|---|
| Quadrant | DetID | PixID | Counts | Sigma | Mean | Median | Sigma |
| A | 10 | 83 | 127136 | 945.94 | 658 | 645 | 133.7 |
| A | 13 | 6 | 14545 | 103.95 | 658 | 645 | 133.7 |
| A | 15 | 169 | 10724 | 75.37 | 658 | 645 | 133.7 |
| B | 5 | 172 | 67585 | 529.2 | 653 | 635 | 126.5 |
| B | 4 | 232 | 39865 | 310.09 | 653 | 635 | 126.5 |
| B | 5 | 236 | 21983 | 168.74 | 653 | 635 | 126.5 |
| C | 0 | 10 | 288584 | 1917.13 | 638 | 643 | 150.2 |
| C | 15 | 214 | 231650 | 1538.06 | 638 | 643 | 150.2 |
| C | 0 | 207 | 124972 | 827.79 | 638 | 643 | 150.2 |
| D | 7 | 38 | 301435 | 1943.14 | 631 | 612 | 154.8 |
| D | 7 | 80 | 153817 | 989.61 | 631 | 612 | 154.8 |
| D | 8 | 195 | 141130 | 907.66 | 631 | 612 | 154.8 |
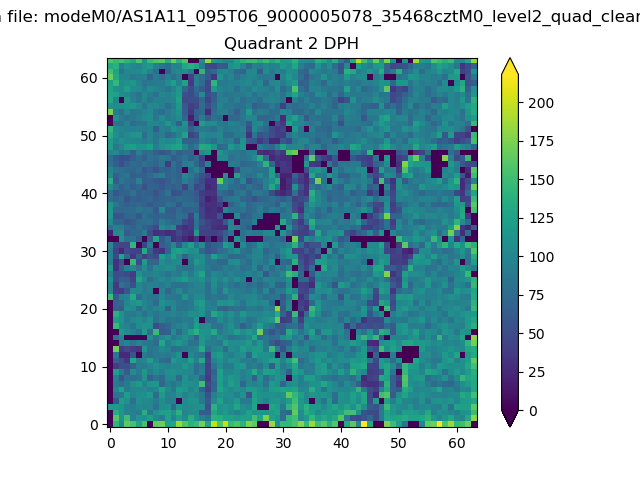
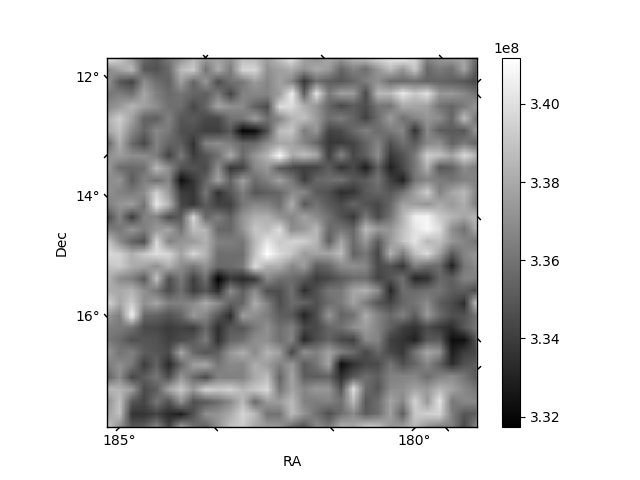
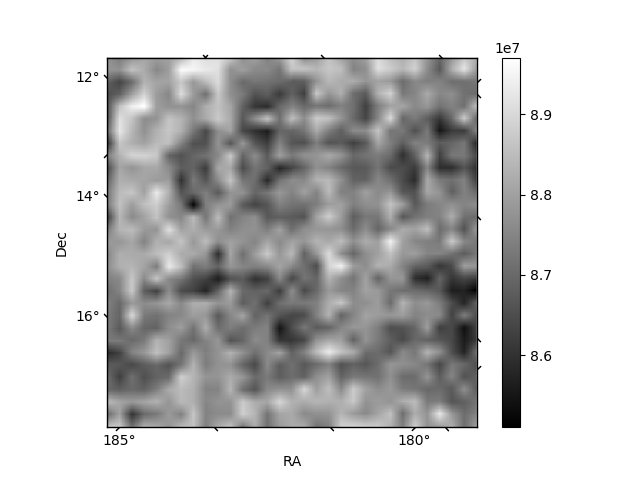
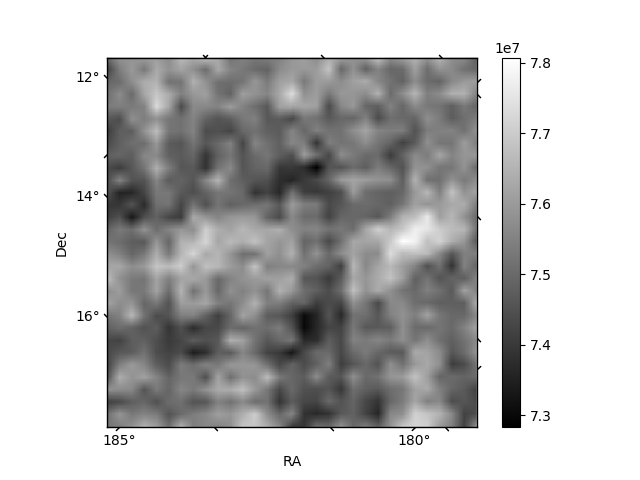
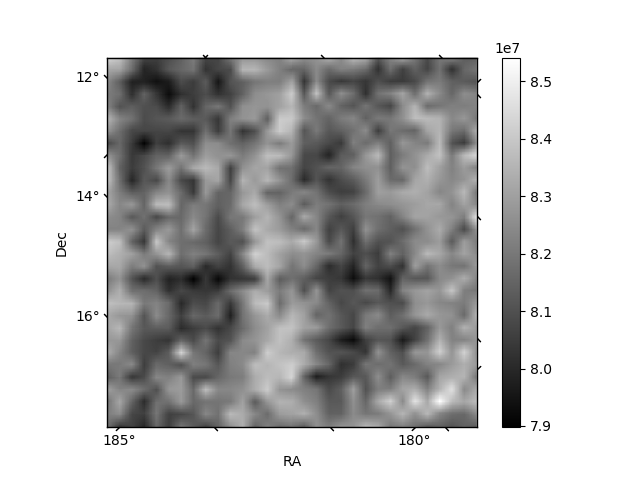
Histogram calculated using DETX and DETY for each event in the final _common_clean file
| Quadrant A | 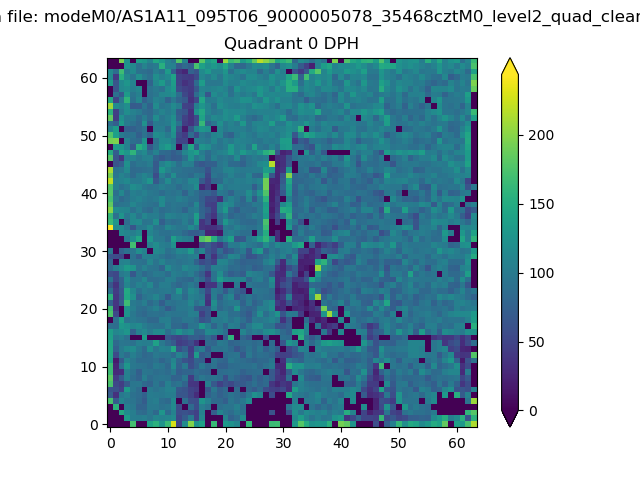 |
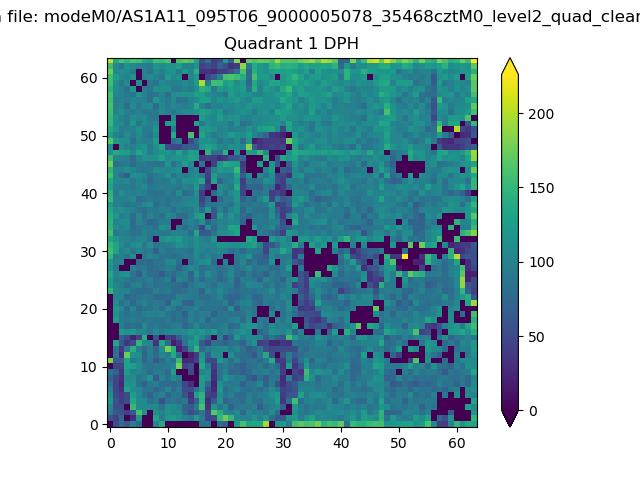 |
Quadrant B |
|---|---|---|---|
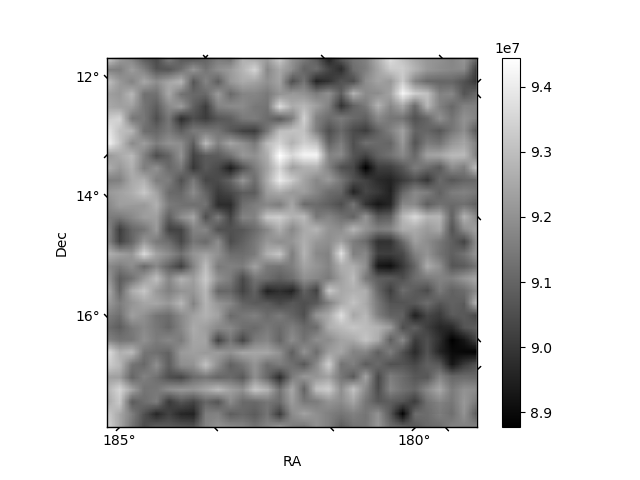
| Quadrant D | 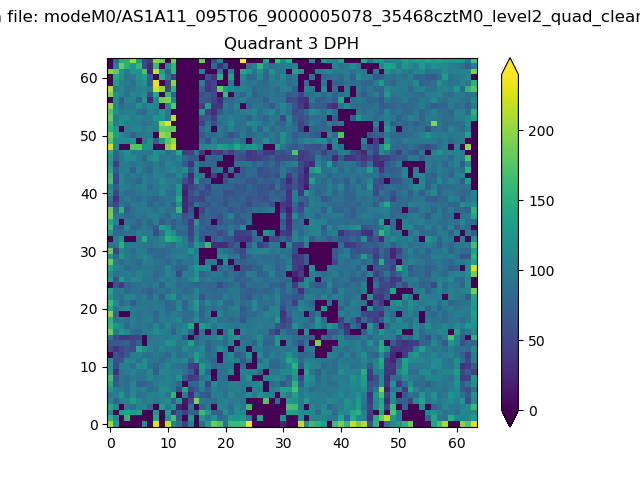 |
 |
Quadrant C |
| Plot type | Count rate plots | Images |
|---|---|---|
| Comparison with Poisson distribution Blue bars denote a histogram of data divided into 1 sec bins. Red curve is a Poisson curve with rate = median count rate of data. |
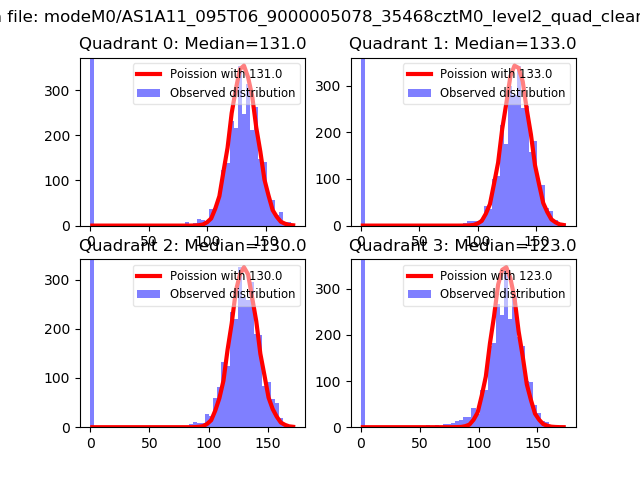 |
 |
| Quadrant-wise count rates Data is divided into 100 sec bins |
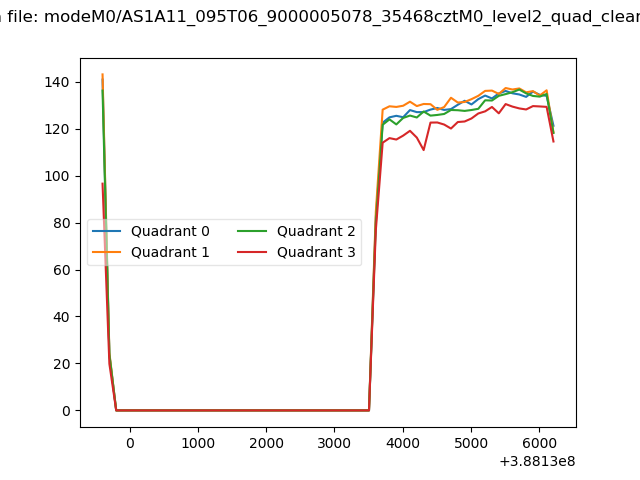 |
|
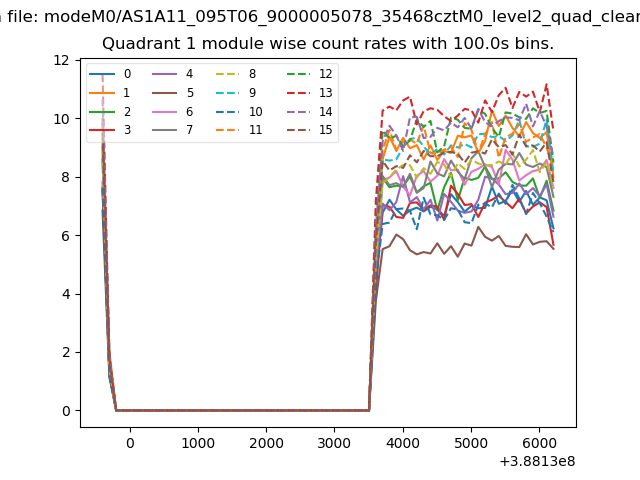
| Module-wise count rates for Quadrant A Data is divided into 100 sec bins |
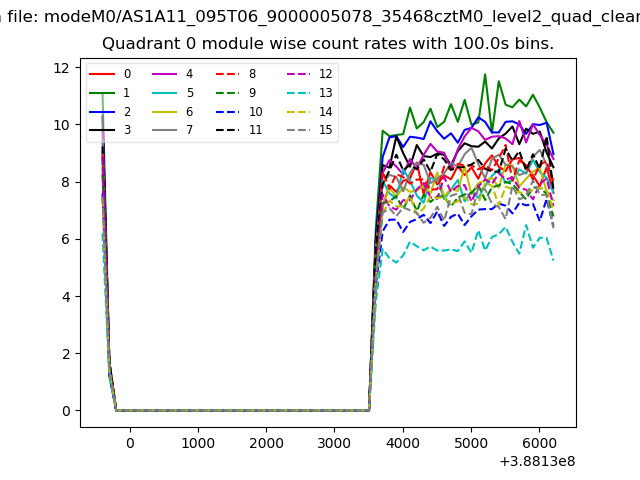 |
 |
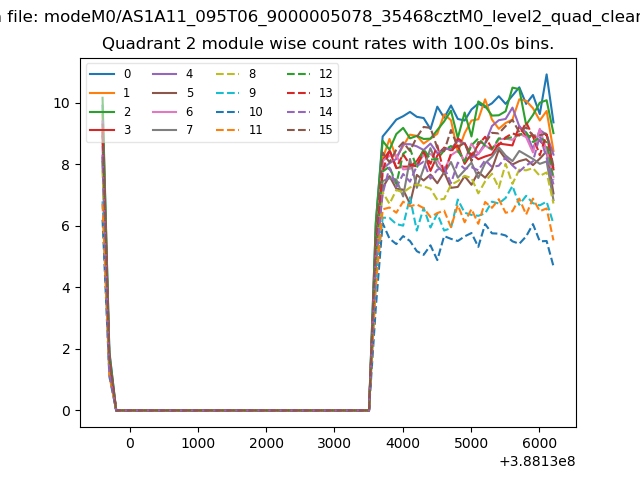
| Module-wise count rates for Quadrant B Data is divided into 100 sec bins |
 |
 |
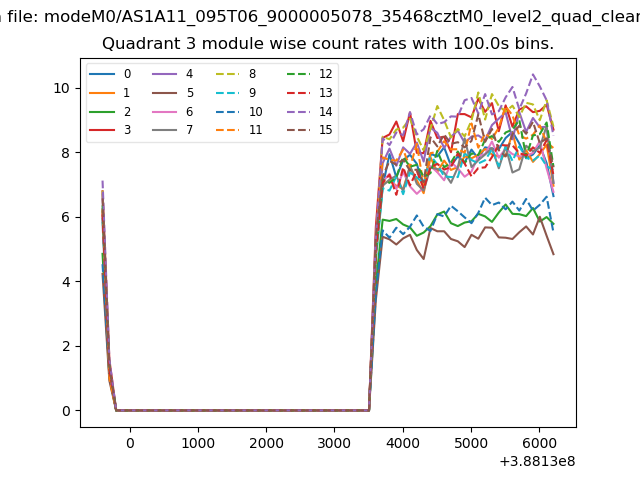
| Module-wise count rates for Quadrant C Data is divided into 100 sec bins |
 |
 |
| Module-wise count rates for Quadrant D Data is divided into 100 sec bins |
 |
 |
| Parameter | Plot |
|---|---|
| CZT HV Monitor | 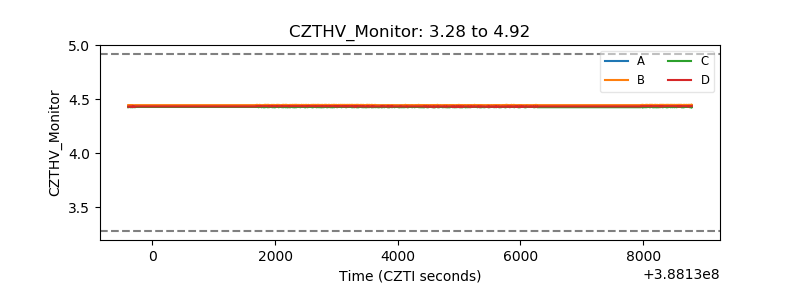 |
| D_VDD | 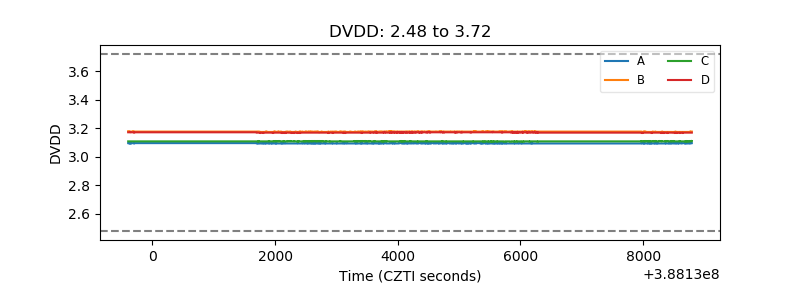 |
| Temperature 1 | 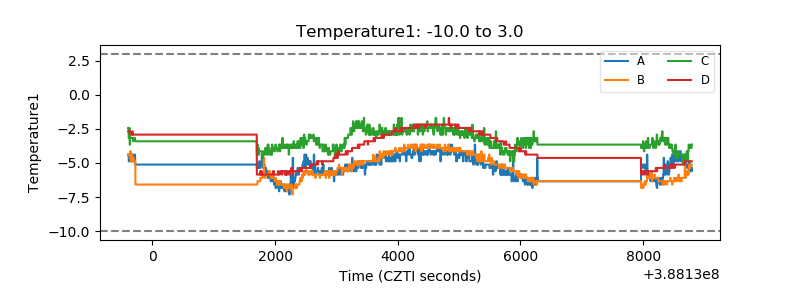 |
| Veto HV Monitor | 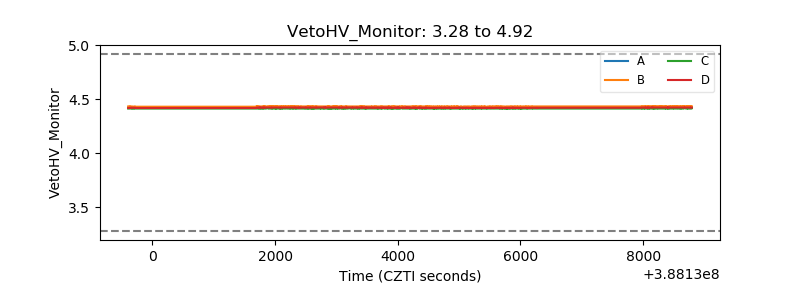 |
| Veto LLD | 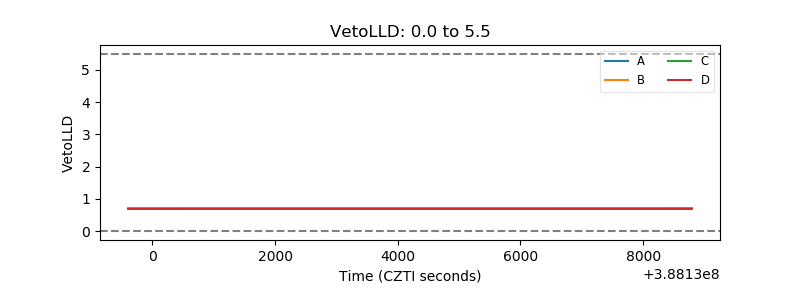 |
| Alpha Counter | 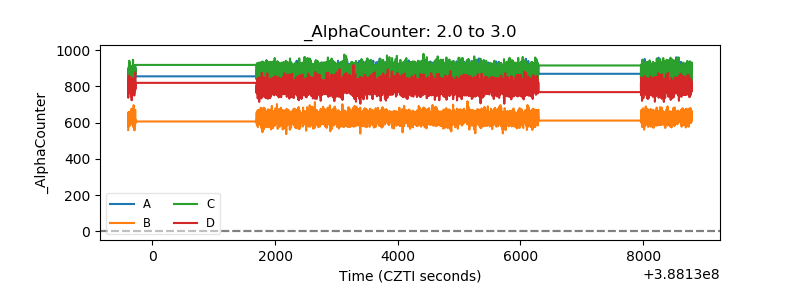 |
| _CPM_Rate | 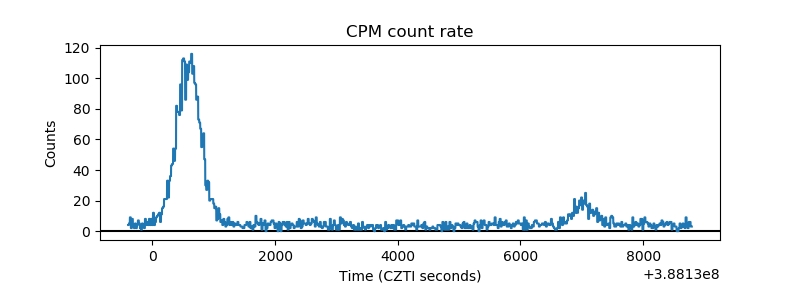 |
| CZT Counter | 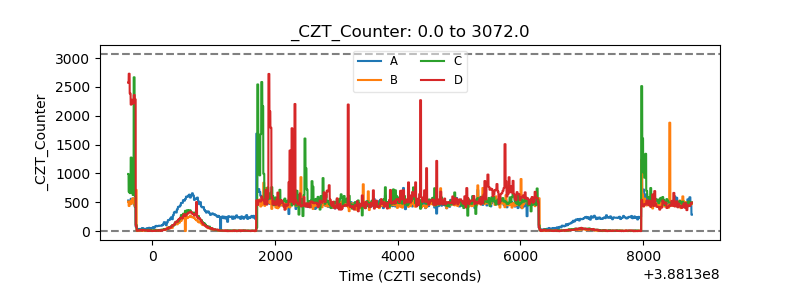 |
| +2.5 Volts monitor | 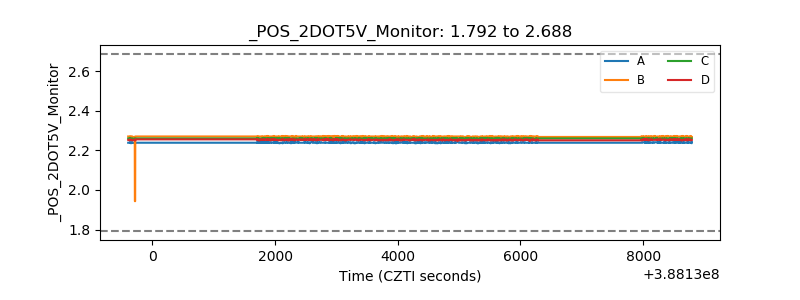 |
| +5 Volts monitor | 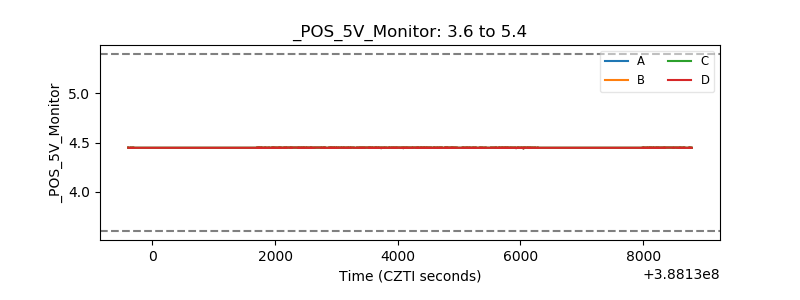 |
| _ROLL_ROT | 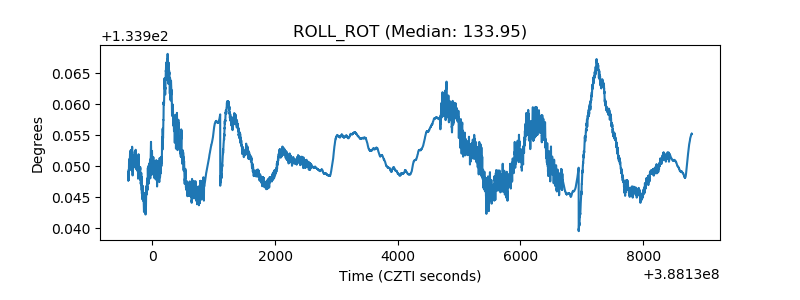 |
| _Roll_DEC | 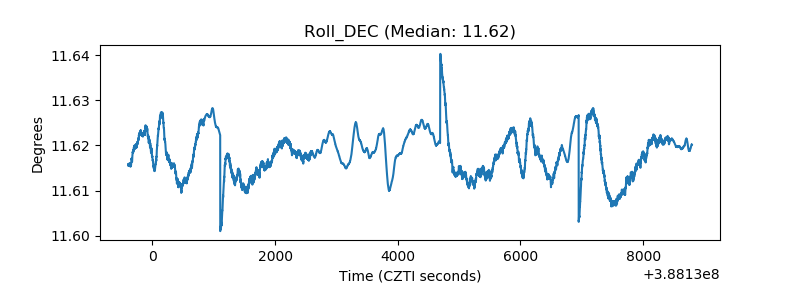 |
| _Roll_RA | 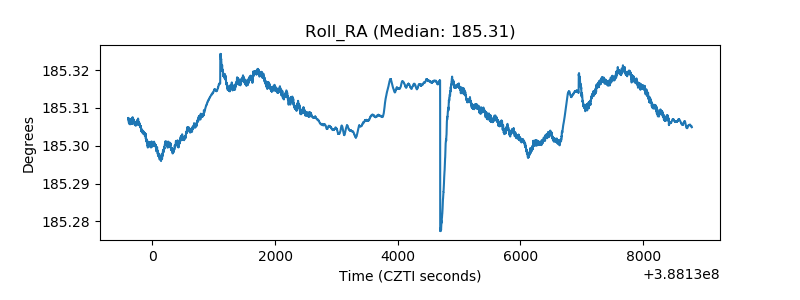 |
| Veto Counter | 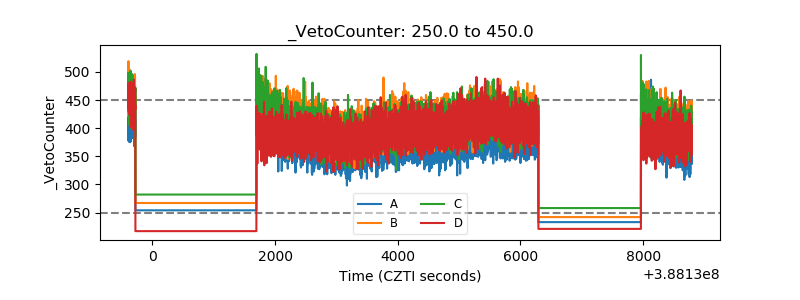 |