| Param | Original file | Final file |
|---|---|---|
| Filename | modeM0/AS1A11_095T06_9000005078_35464cztM0_level2.evt | modeM0/AS1A11_095T06_9000005078_35464cztM0_level2_quad_clean.evt |
| Size (bytes) | 401,037,120 | 63,898,560 |
| Size | 382.5 MB | 60.9 MB |
| Events in quadrant A | 2,533,247 | 405,671 |
| Events in quadrant B | 2,657,462 | 421,021 |
| Events in quadrant C | 2,965,496 | 397,012 |
| Events in quadrant D | 3,652,743 | 363,630 |
| Mode M9 | |||
|---|---|---|---|
| Quadrant | BADHDUFLAG | Total packets | Discarded packets |
| A | 0 | 35 | 0 |
| B | 0 | 35 | 0 |
| C | 0 | 35 | 0 |
| D | 0 | 36 | 0 |
| Mode M0 | |||
|---|---|---|---|
| Quadrant | BADHDUFLAG | Total packets | Discarded packets |
| A | 0 | 10437 | 3 |
| B | 0 | 10731 | 2 |
| C | 0 | 11717 | 2 |
| D | 0 | 13931 | 2 |
| Mode SS | |||
|---|---|---|---|
| Quadrant | BADHDUFLAG | Total packets | Discarded packets |
| A | 0 | 102 | 0 |
| B | 0 | 102 | 0 |
| C | 0 | 102 | 0 |
| D | 0 | 102 | 0 |
| Quadrant | Total seconds | Saturated seconds | Saturation percentage |
|---|---|---|---|
| A | 4947 | 7 | 0.141500% |
| B | 4947 | 47 | 0.950071% |
| C | 4947 | 74 | 1.495856% |
| D | 4947 | 298 | 6.023853% |
Noise dominated data is calculated using 1-second bins in cleaned event files. If a bin has >2000 counts, and if more than 50% of those come from <1% of pixels, then it is considered to be noise-dominated and hence unusable.
| Quadrant | # 1 sec bins | Bins with >0 counts | Bins with >2000 counts | High rate bins dominated by noise | Noise dominated (total time) | Noise dominated (detector-on time) | Marked lightcurve |
|---|---|---|---|---|---|---|---|
| A | 6978 | 4948 | 0 | 0 | 0.00% | 0.00% | 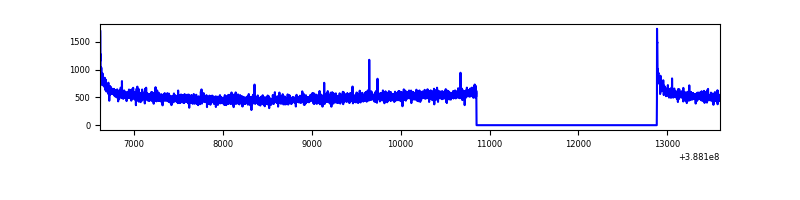 |
| B | 6978 | 4948 | 25 | 25 | 0.36% | 0.51% | 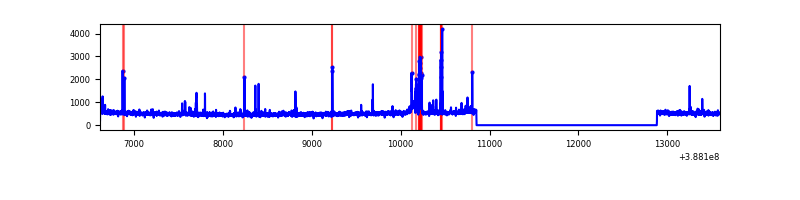 |
| C | 6978 | 4948 | 53 | 53 | 0.76% | 1.07% | 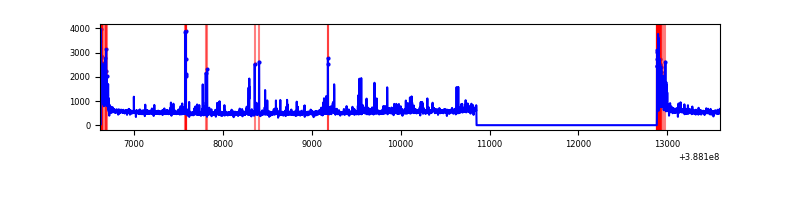 |
| D | 6978 | 4948 | 318 | 318 | 4.56% | 6.43% | 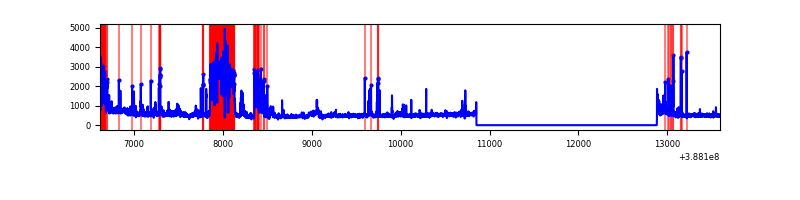 |
Top three noisy pixels from each quadrant. If the there are fewer than three noisy pixels in the level2.evt file, extra rows are filled as -1
| Pixel properties | Quadrant properties | ||||||
|---|---|---|---|---|---|---|---|
| Quadrant | DetID | PixID | Counts | Sigma | Mean | Median | Sigma |
| A | 10 | 83 | 119436 | 949.67 | 622 | 611 | 125.1 |
| A | 13 | 6 | 8638 | 64.15 | 622 | 611 | 125.1 |
| A | 13 | 254 | 7655 | 56.3 | 622 | 611 | 125.1 |
| B | 5 | 172 | 181551 | 1515.74 | 623 | 608 | 119.4 |
| B | 12 | 111 | 14584 | 117.08 | 623 | 608 | 119.4 |
| B | 4 | 232 | 13500 | 108.0 | 623 | 608 | 119.4 |
| C | 0 | 10 | 236092 | 1695.5 | 600 | 607 | 138.9 |
| C | 15 | 214 | 206647 | 1483.49 | 600 | 607 | 138.9 |
| C | 0 | 207 | 154865 | 1110.66 | 600 | 607 | 138.9 |
| D | 13 | 249 | 912110 | 6416.34 | 580 | 566 | 142.1 |
| D | 1 | 52 | 180348 | 1265.48 | 580 | 566 | 142.1 |
| D | 7 | 80 | 133028 | 932.4 | 580 | 566 | 142.1 |
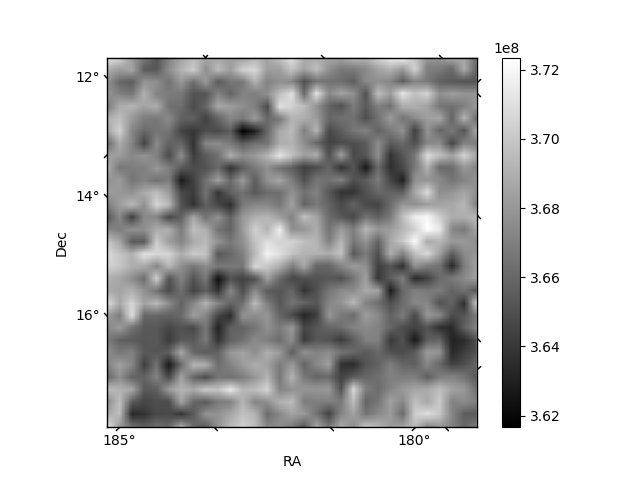
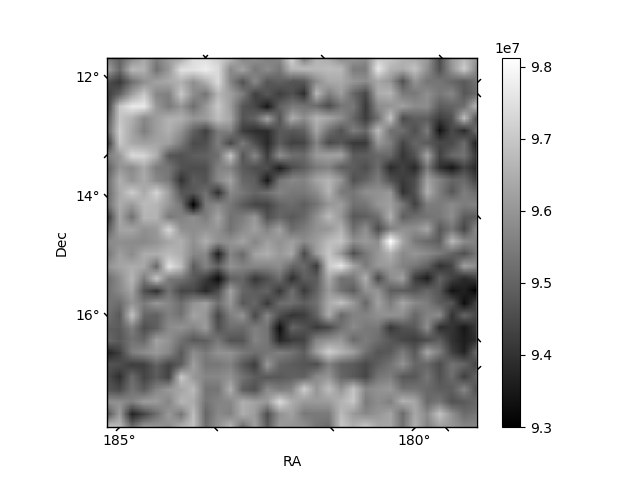
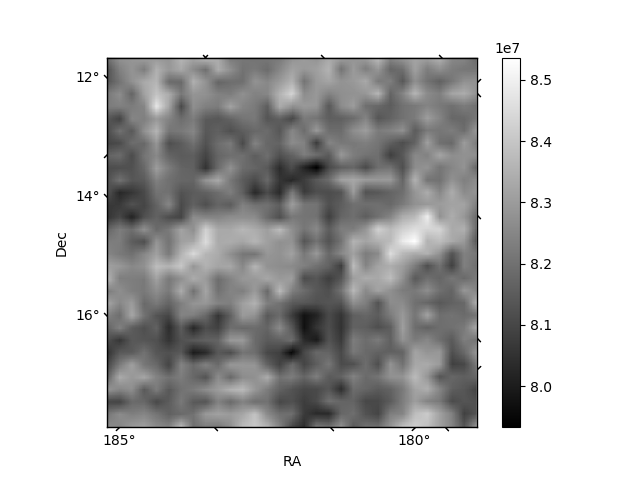
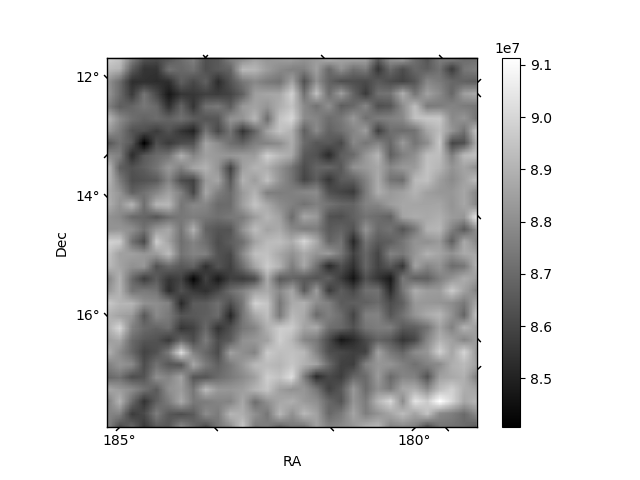
Histogram calculated using DETX and DETY for each event in the final _common_clean file
| Quadrant A | 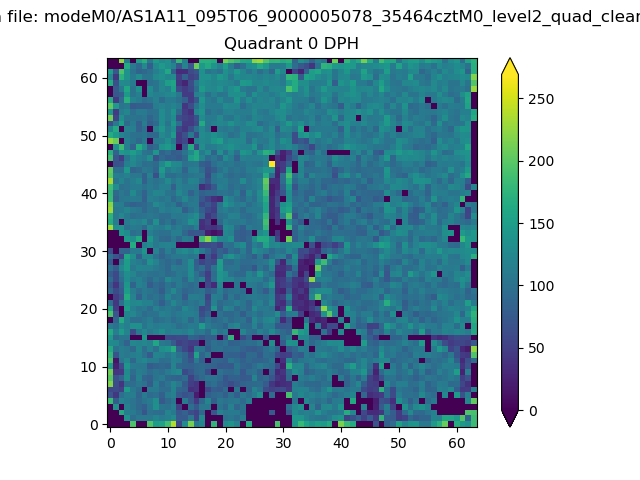 |
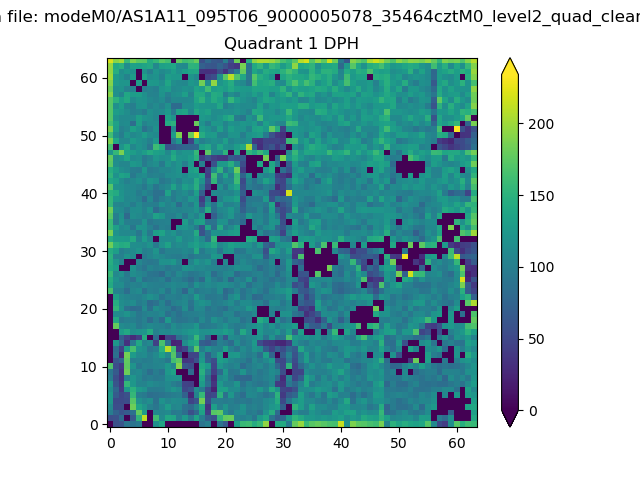 |
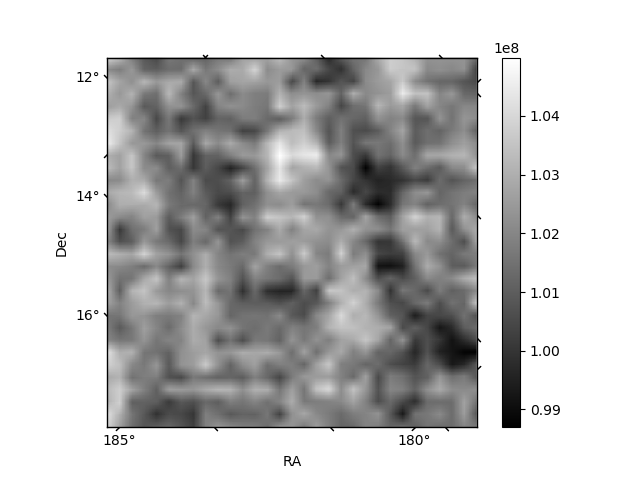
Quadrant B |
|---|---|---|---|
| Quadrant D | 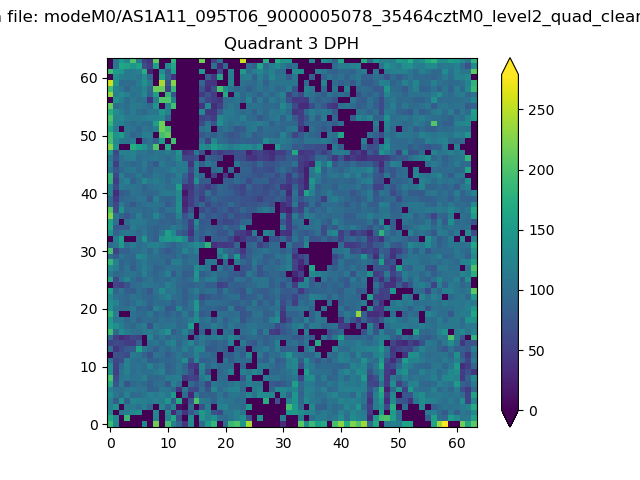 |
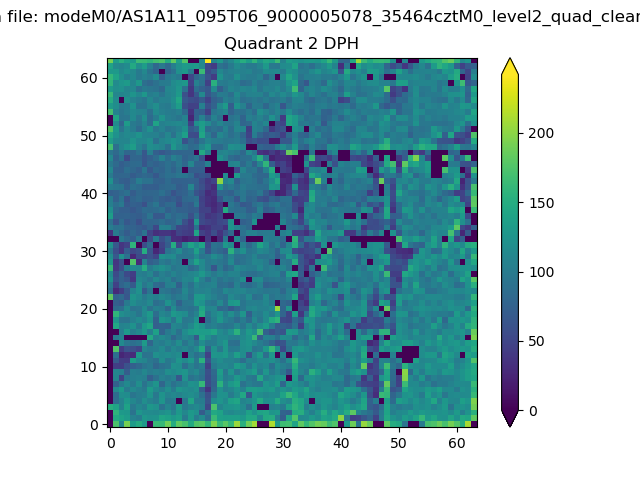 |
Quadrant C |
| Plot type | Count rate plots | Images |
|---|---|---|
| Comparison with Poisson distribution Blue bars denote a histogram of data divided into 1 sec bins. Red curve is a Poisson curve with rate = median count rate of data. |
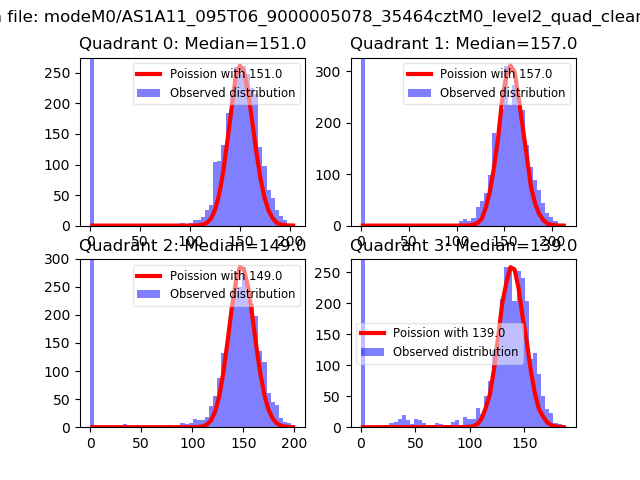 |
 |
| Quadrant-wise count rates Data is divided into 100 sec bins |
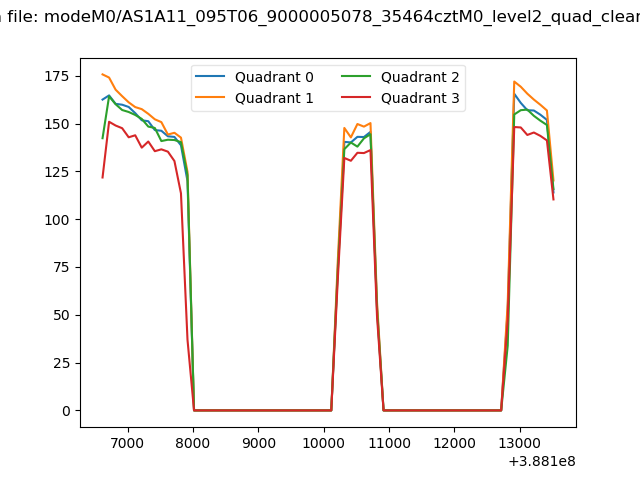 |
|
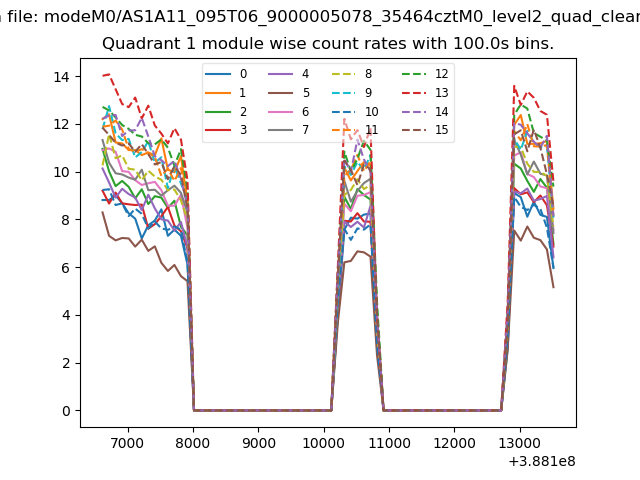
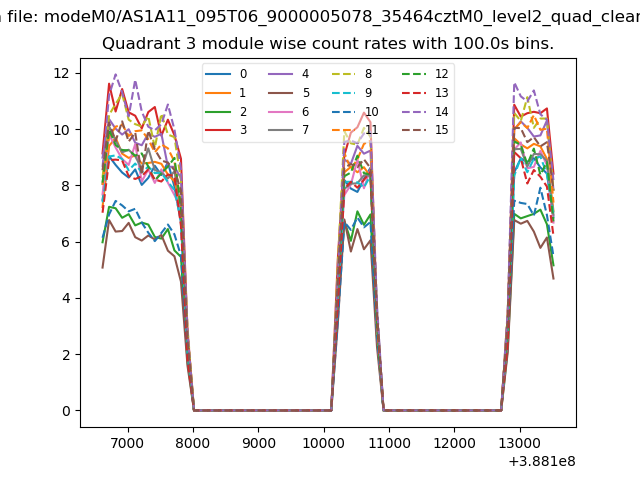
| Module-wise count rates for Quadrant A Data is divided into 100 sec bins |
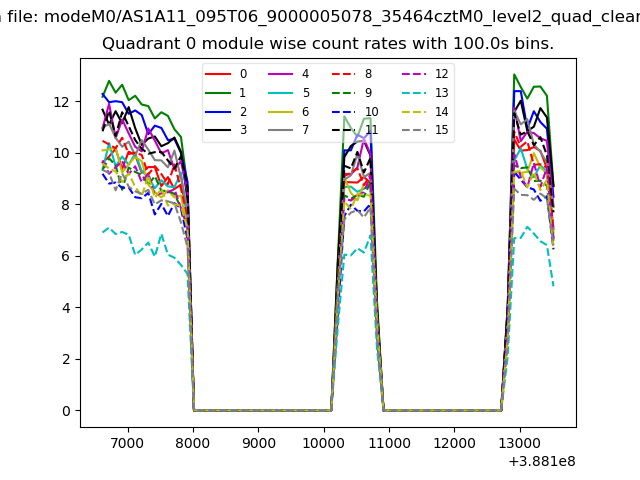 |
 |
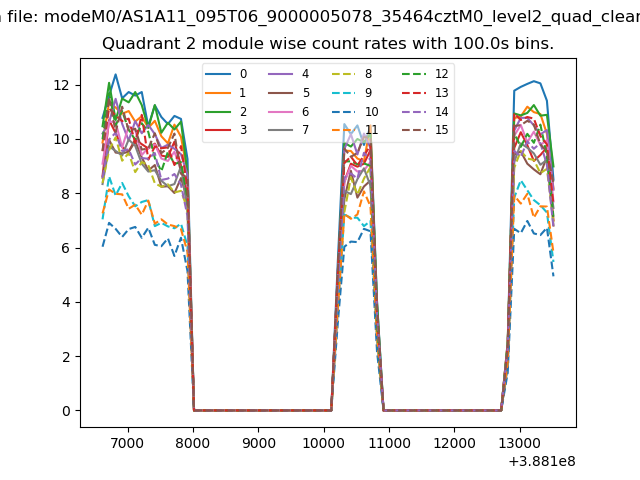
| Module-wise count rates for Quadrant B Data is divided into 100 sec bins |
 |
 |
| Module-wise count rates for Quadrant C Data is divided into 100 sec bins |
 |
 |
| Module-wise count rates for Quadrant D Data is divided into 100 sec bins |
 |
 |
| Parameter | Plot |
|---|---|
| CZT HV Monitor | 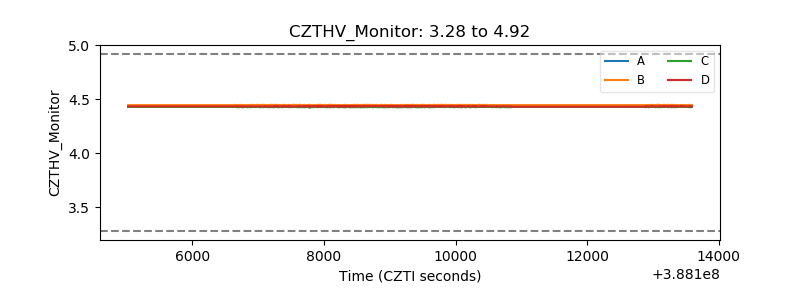 |
| D_VDD | 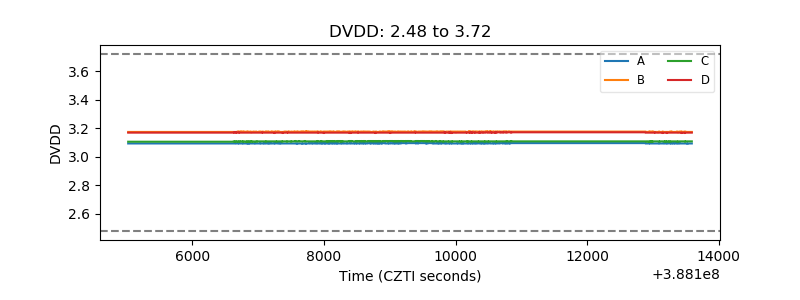 |
| Temperature 1 | 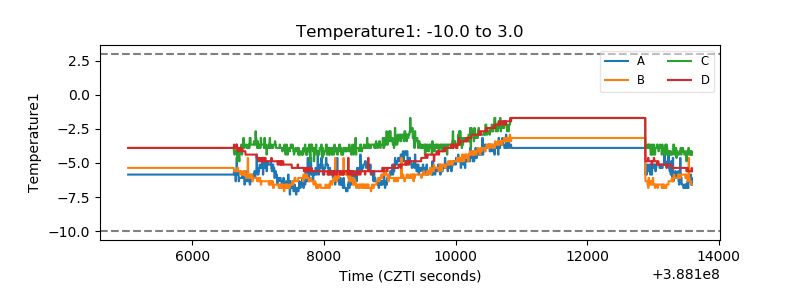 |
| Veto HV Monitor | 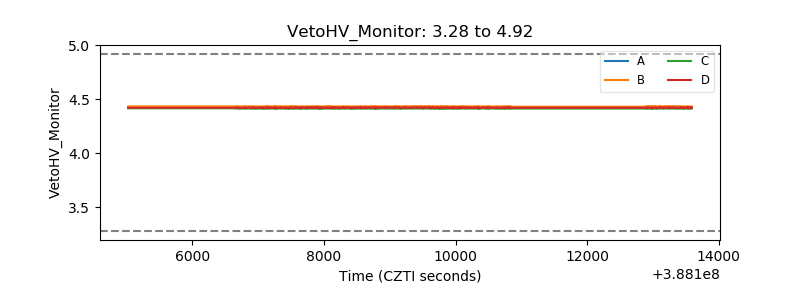 |
| Veto LLD | 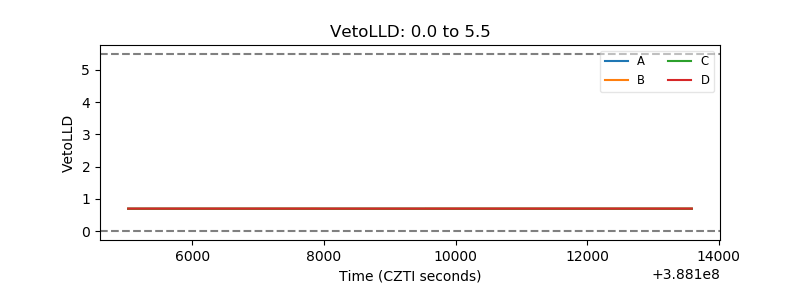 |
| Alpha Counter | 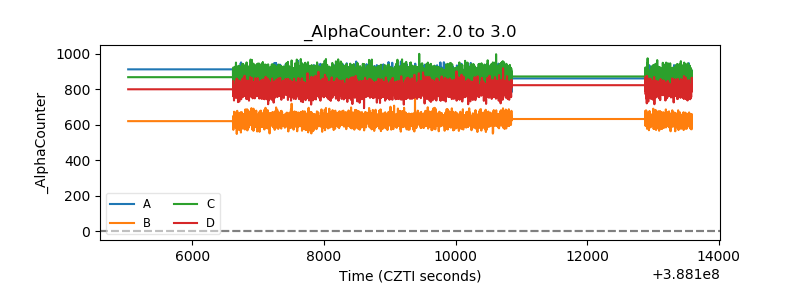 |
| _CPM_Rate | 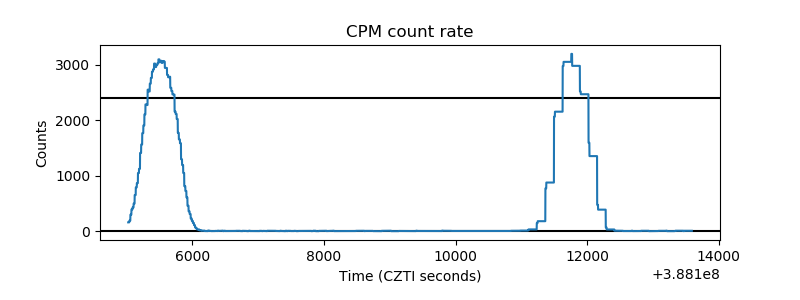 |
| CZT Counter | 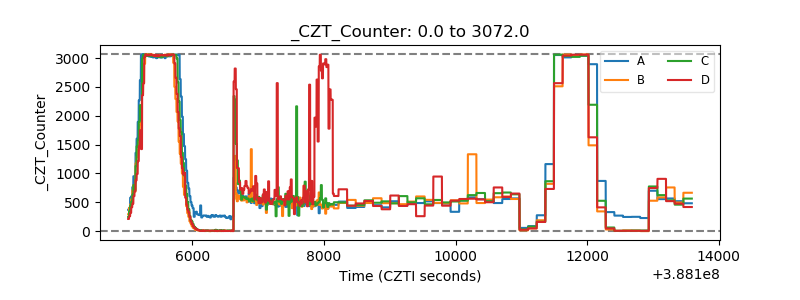 |
| +2.5 Volts monitor | 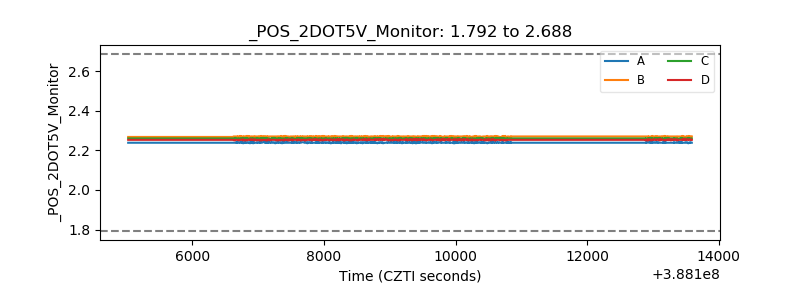 |
| +5 Volts monitor | 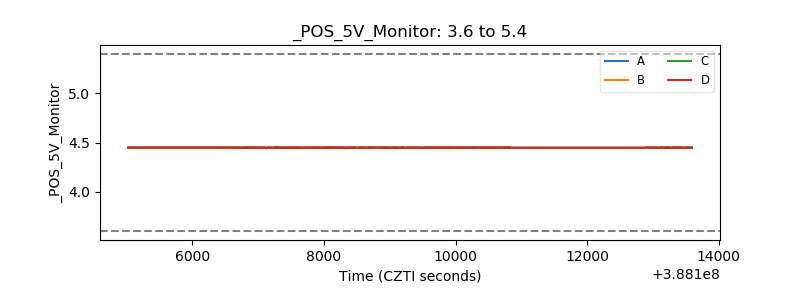 |
| _ROLL_ROT | 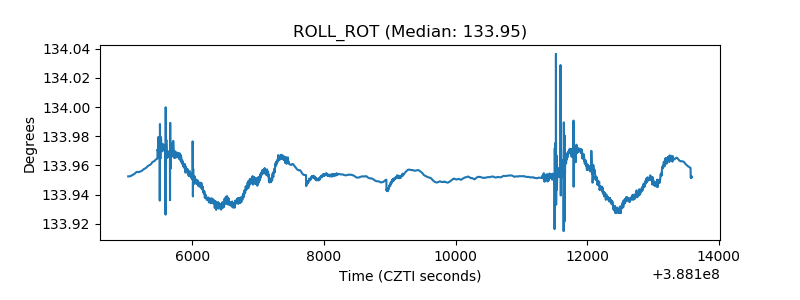 |
| _Roll_DEC | 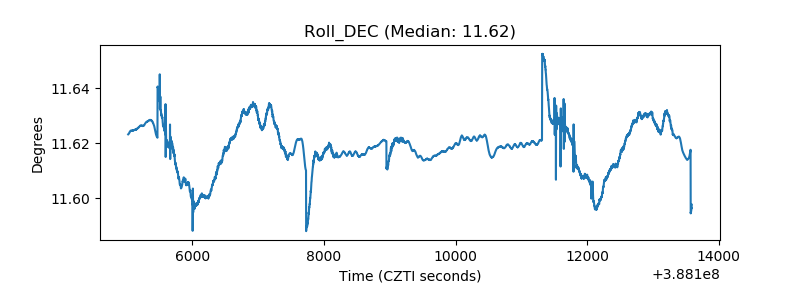 |
| _Roll_RA | 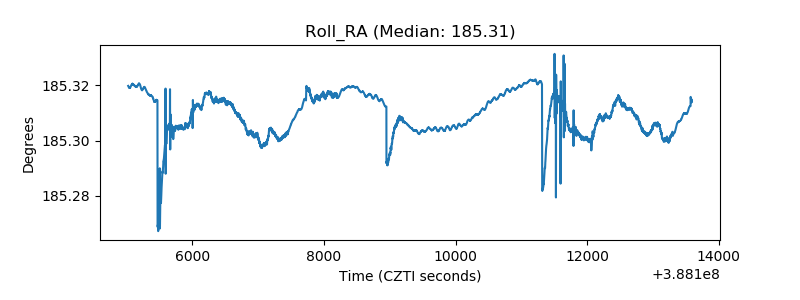 |
| Veto Counter | 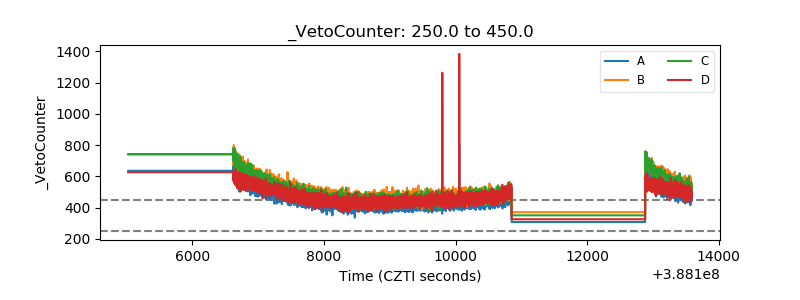 |