| Param | Original file | Final file |
|---|---|---|
| Filename | modeM0/AS1A11_095T06_9000005078_35463cztM0_level2.evt | modeM0/AS1A11_095T06_9000005078_35463cztM0_level2_quad_clean.evt |
| Size (bytes) | 438,301,440 | 64,607,040 |
| Size | 418.0 MB | 61.6 MB |
| Events in quadrant A | 3,752,442 | 403,934 |
| Events in quadrant B | 2,776,543 | 420,789 |
| Events in quadrant C | 2,987,365 | 398,523 |
| Events in quadrant D | 3,414,821 | 378,515 |
| Mode M9 | |||
|---|---|---|---|
| Quadrant | BADHDUFLAG | Total packets | Discarded packets |
| A | 0 | 27 | 0 |
| B | 0 | 27 | 0 |
| C | 0 | 27 | 0 |
| D | 0 | 28 | 0 |
| Mode M0 | |||
|---|---|---|---|
| Quadrant | BADHDUFLAG | Total packets | Discarded packets |
| A | 0 | 14508 | 3 |
| B | 0 | 11266 | 2 |
| C | 0 | 11817 | 2 |
| D | 0 | 13444 | 2 |
| Mode SS | |||
|---|---|---|---|
| Quadrant | BADHDUFLAG | Total packets | Discarded packets |
| A | 0 | 104 | 0 |
| B | 0 | 104 | 0 |
| C | 0 | 104 | 0 |
| D | 0 | 104 | 0 |
| Quadrant | Total seconds | Saturated seconds | Saturation percentage |
|---|---|---|---|
| A | 5051 | 13 | 0.257375% |
| B | 5051 | 66 | 1.306672% |
| C | 5051 | 116 | 2.296575% |
| D | 5051 | 118 | 2.336171% |
Noise dominated data is calculated using 1-second bins in cleaned event files. If a bin has >2000 counts, and if more than 50% of those come from <1% of pixels, then it is considered to be noise-dominated and hence unusable.
| Quadrant | # 1 sec bins | Bins with >0 counts | Bins with >2000 counts | High rate bins dominated by noise | Noise dominated (total time) | Noise dominated (detector-on time) | Marked lightcurve |
|---|---|---|---|---|---|---|---|
| A | 6994 | 5052 | 0 | 0 | 0.00% | 0.00% | 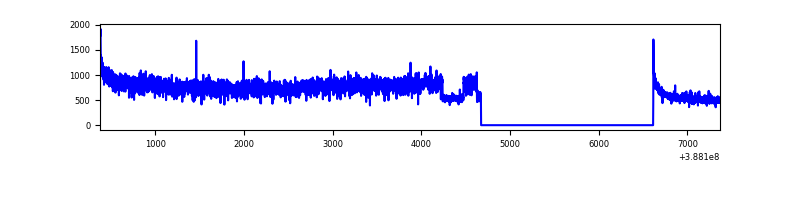 |
| B | 6994 | 5052 | 37 | 37 | 0.53% | 0.73% | 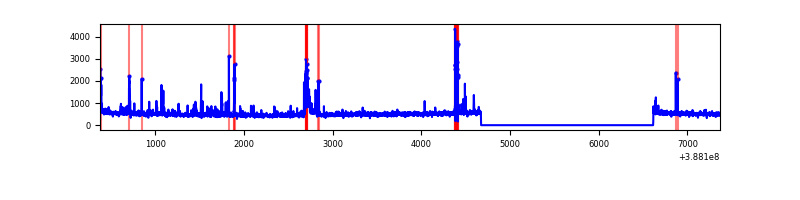 |
| C | 6994 | 5052 | 91 | 91 | 1.30% | 1.80% | 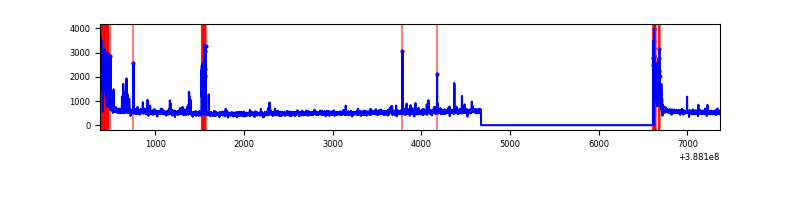 |
| D | 6994 | 5052 | 101 | 101 | 1.44% | 2.00% | 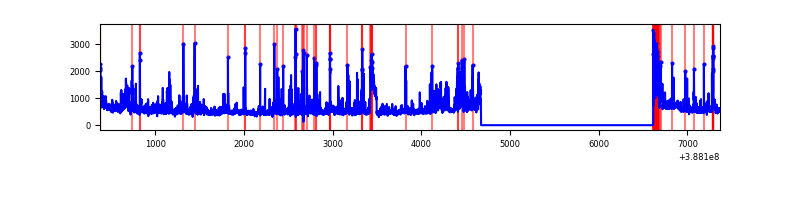 |
Top three noisy pixels from each quadrant. If the there are fewer than three noisy pixels in the level2.evt file, extra rows are filled as -1
| Pixel properties | Quadrant properties | ||||||
|---|---|---|---|---|---|---|---|
| Quadrant | DetID | PixID | Counts | Sigma | Mean | Median | Sigma |
| A | 15 | 169 | 1224498 | 9763.36 | 620 | 608 | 125.4 |
| A | 10 | 83 | 121775 | 966.59 | 620 | 608 | 125.4 |
| A | 13 | 6 | 9300 | 69.34 | 620 | 608 | 125.4 |
| B | 5 | 236 | 173551 | 1465.03 | 617 | 604 | 118.1 |
| B | 5 | 200 | 71750 | 602.67 | 617 | 604 | 118.1 |
| B | 5 | 172 | 66158 | 555.3 | 617 | 604 | 118.1 |
| C | 0 | 10 | 316503 | 2268.39 | 599 | 602 | 139.3 |
| C | 15 | 214 | 210842 | 1509.67 | 599 | 602 | 139.3 |
| C | 0 | 207 | 100061 | 714.18 | 599 | 602 | 139.3 |
| D | 1 | 52 | 412838 | 2810.32 | 594 | 577 | 146.7 |
| D | 7 | 80 | 257783 | 1753.34 | 594 | 577 | 146.7 |
| D | 13 | 249 | 186083 | 1264.57 | 594 | 577 | 146.7 |
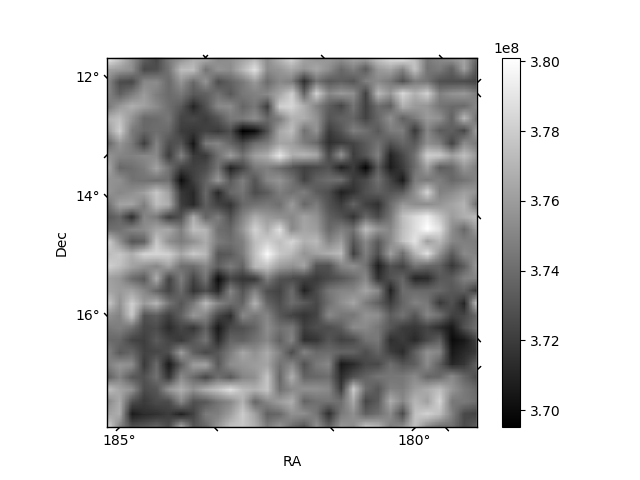
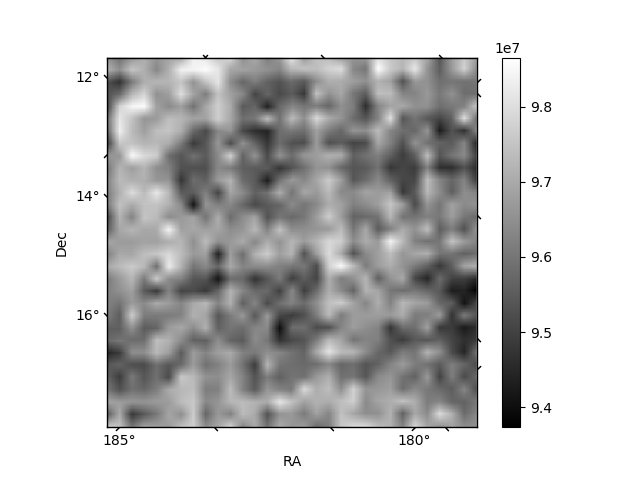
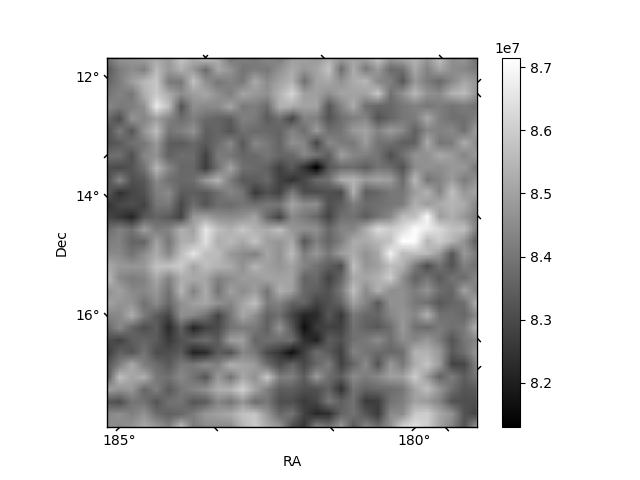
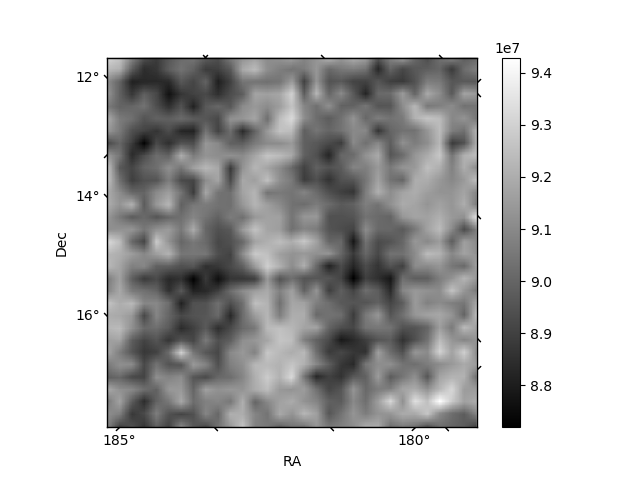
Histogram calculated using DETX and DETY for each event in the final _common_clean file
| Quadrant A | 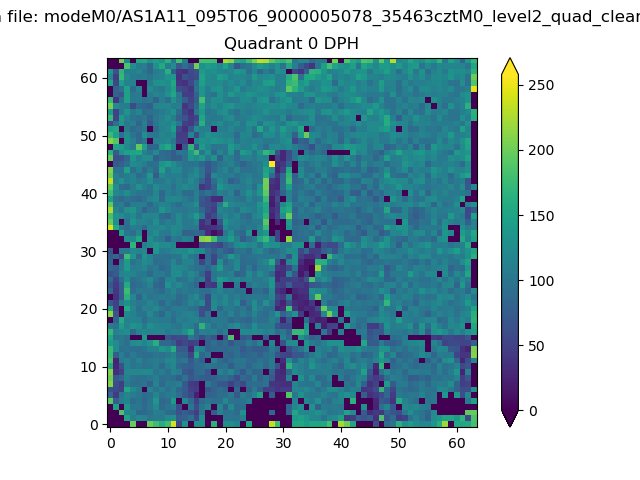 |
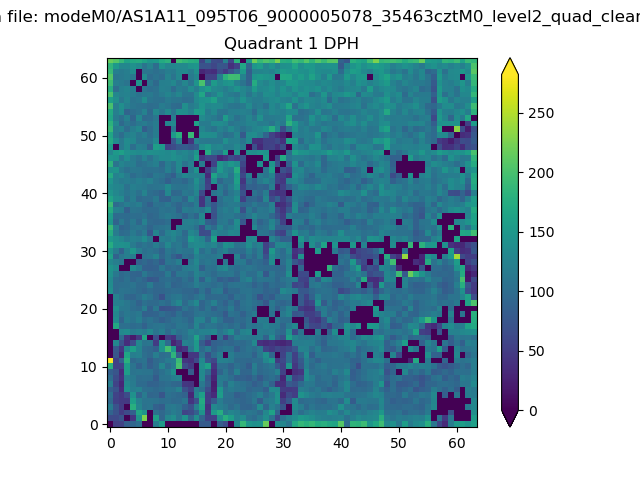 |
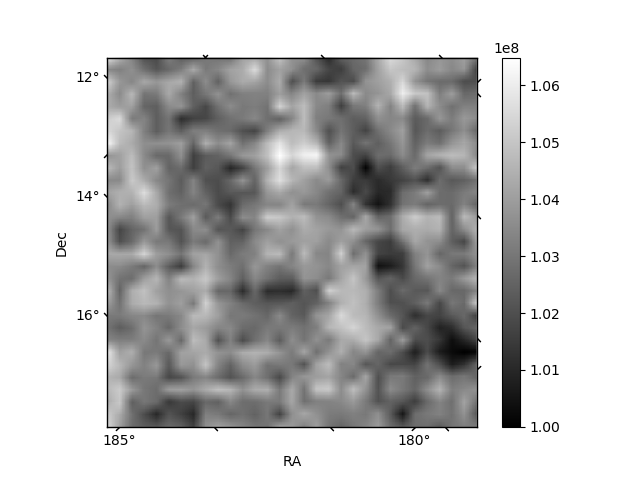
Quadrant B |
|---|---|---|---|
| Quadrant D | 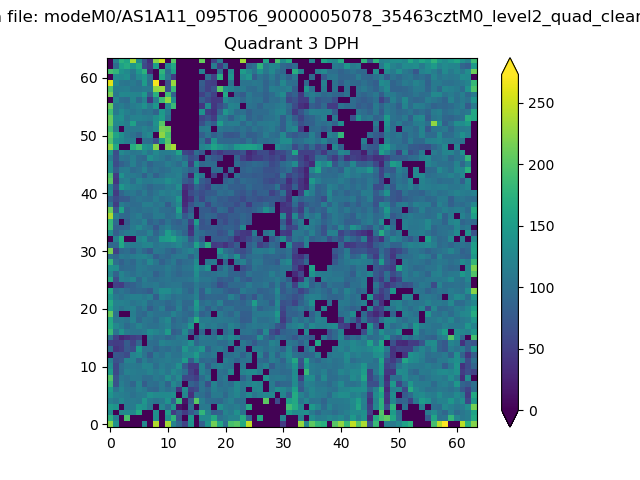 |
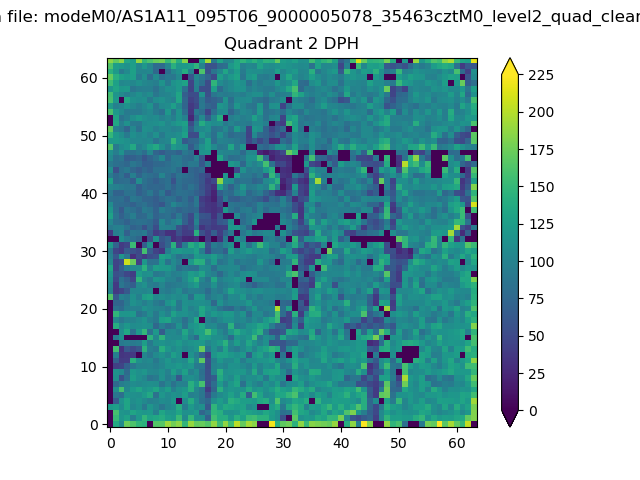 |
Quadrant C |
| Plot type | Count rate plots | Images |
|---|---|---|
| Comparison with Poisson distribution Blue bars denote a histogram of data divided into 1 sec bins. Red curve is a Poisson curve with rate = median count rate of data. |
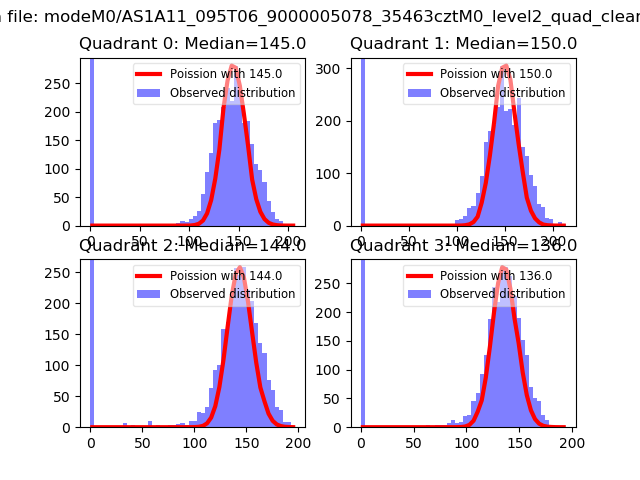 |
 |
| Quadrant-wise count rates Data is divided into 100 sec bins |
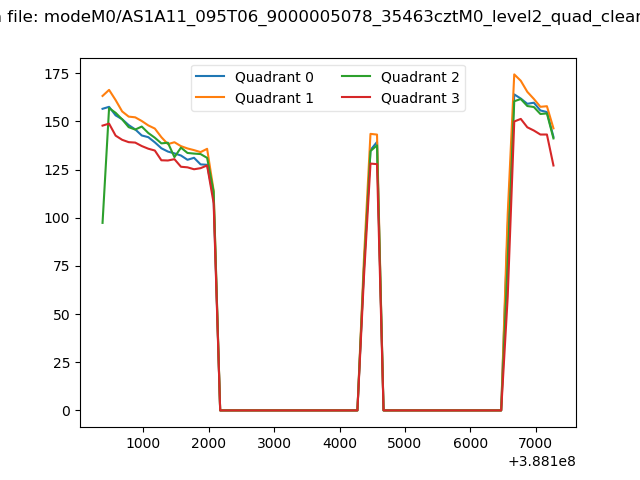 |
|
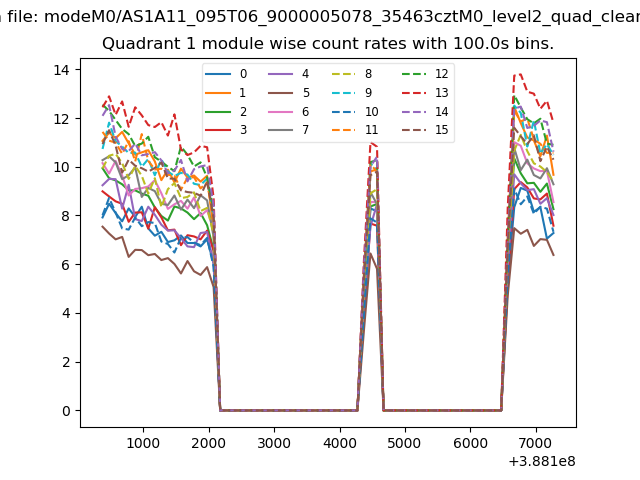
| Module-wise count rates for Quadrant A Data is divided into 100 sec bins |
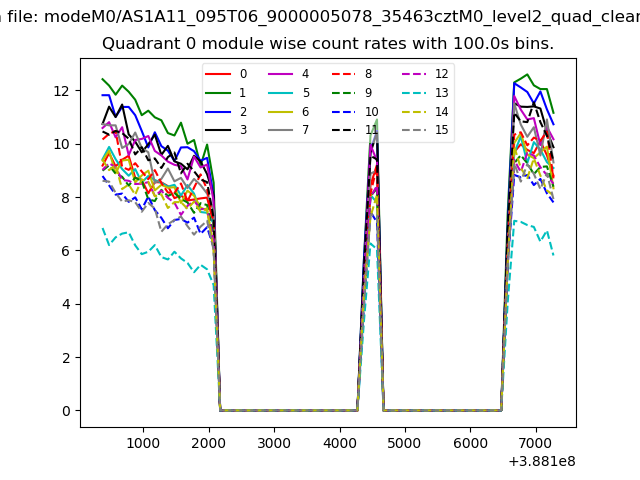 |
 |
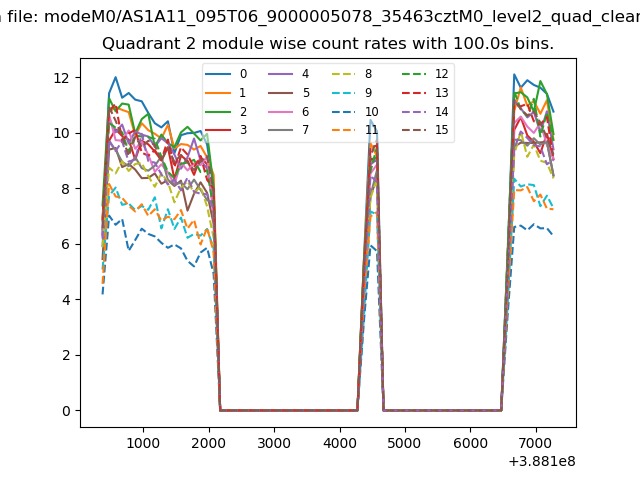
| Module-wise count rates for Quadrant B Data is divided into 100 sec bins |
 |
 |
| Module-wise count rates for Quadrant C Data is divided into 100 sec bins |
 |
 |
| Module-wise count rates for Quadrant D Data is divided into 100 sec bins |
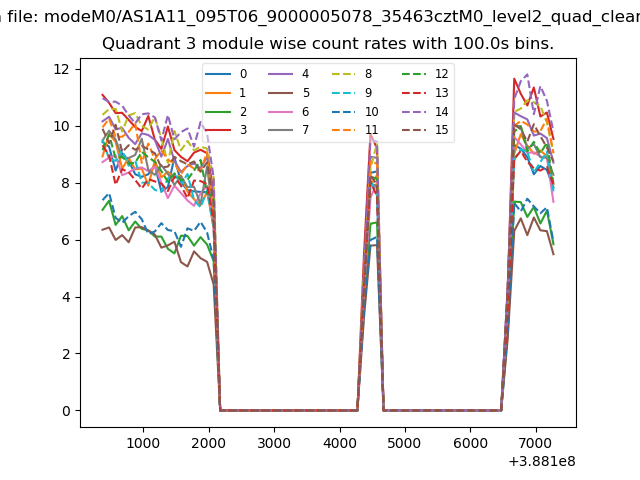 |
 |
| Parameter | Plot |
|---|---|
| CZT HV Monitor | 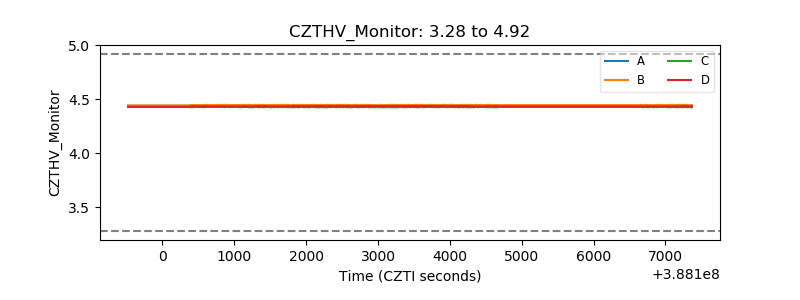 |
| D_VDD | 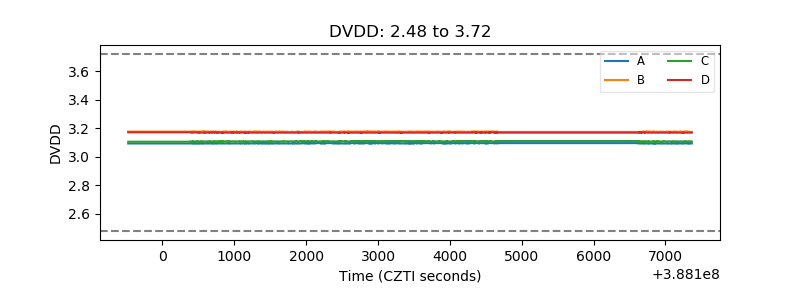 |
| Temperature 1 | 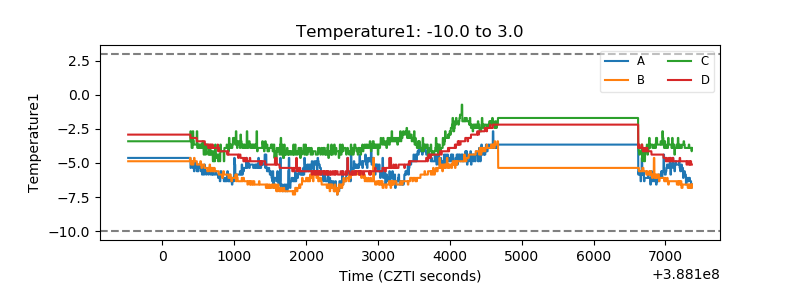 |
| Veto HV Monitor | 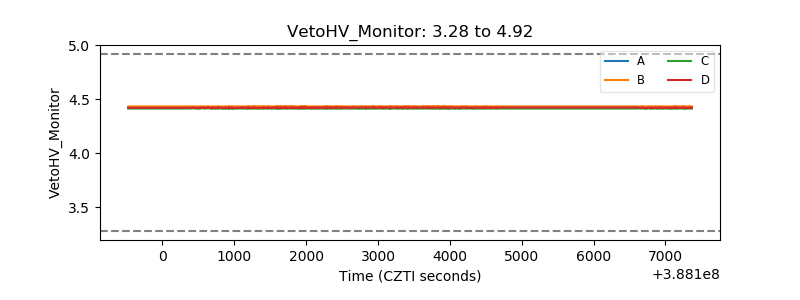 |
| Veto LLD | 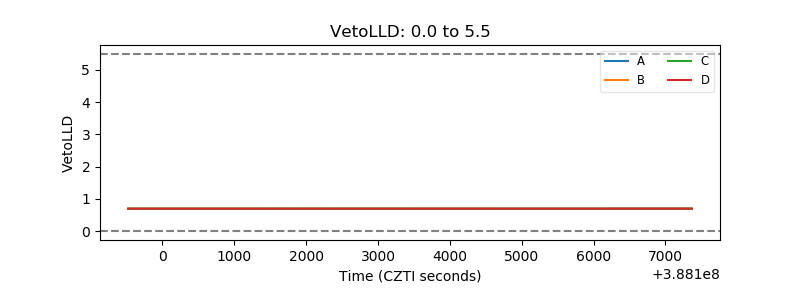 |
| Alpha Counter | 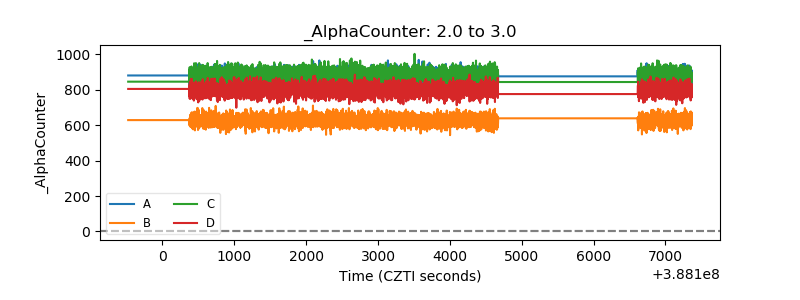 |
| _CPM_Rate | 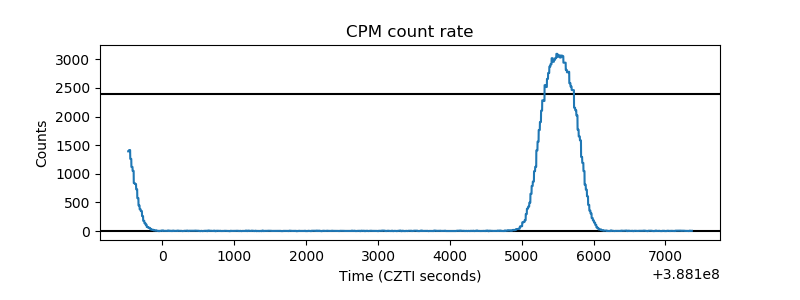 |
| CZT Counter | 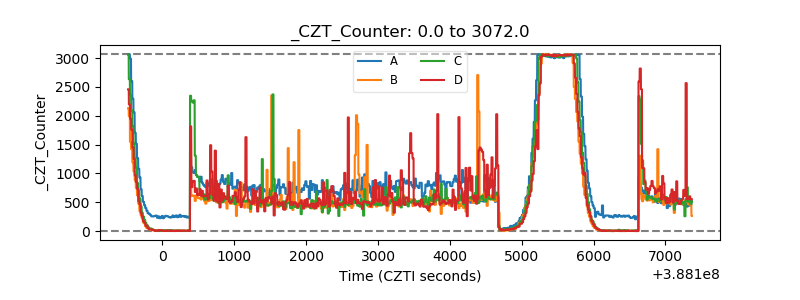 |
| +2.5 Volts monitor | 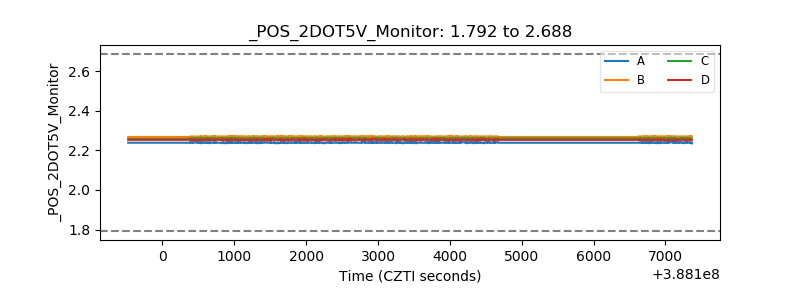 |
| +5 Volts monitor | 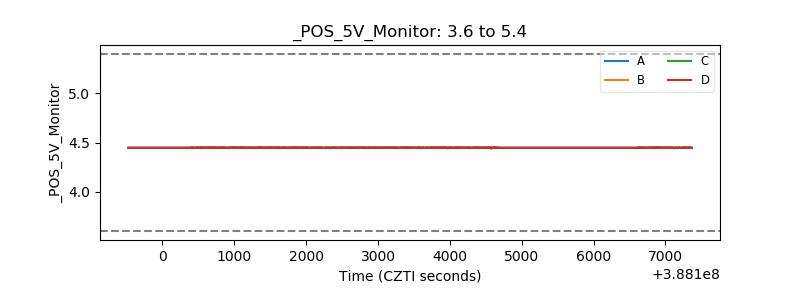 |
| _ROLL_ROT | 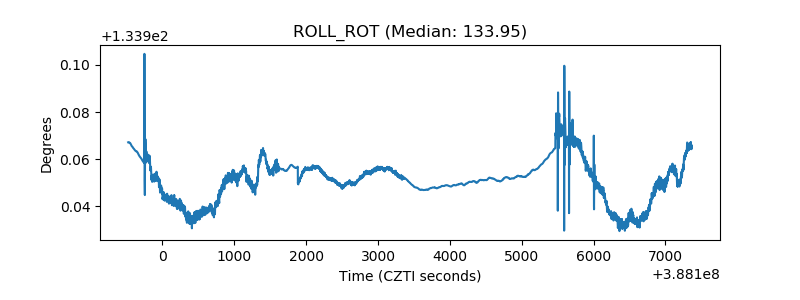 |
| _Roll_DEC | 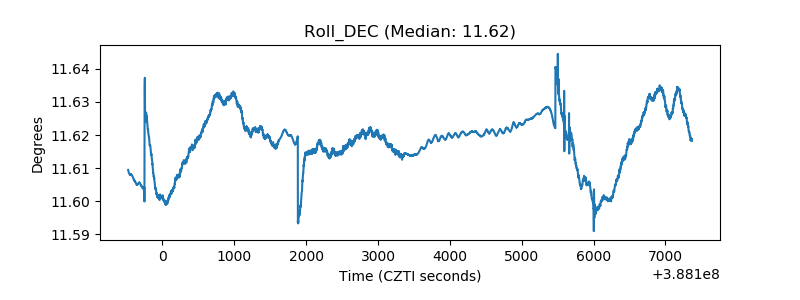 |
| _Roll_RA | 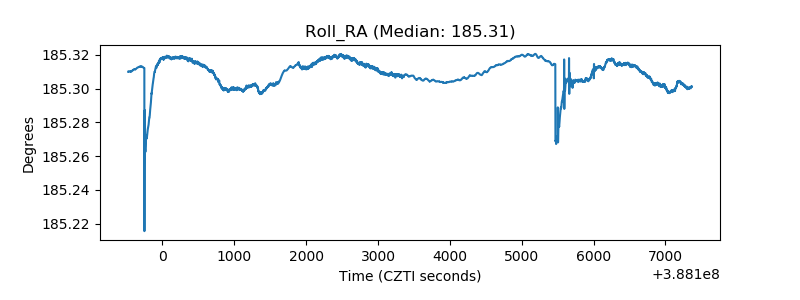 |
| Veto Counter | 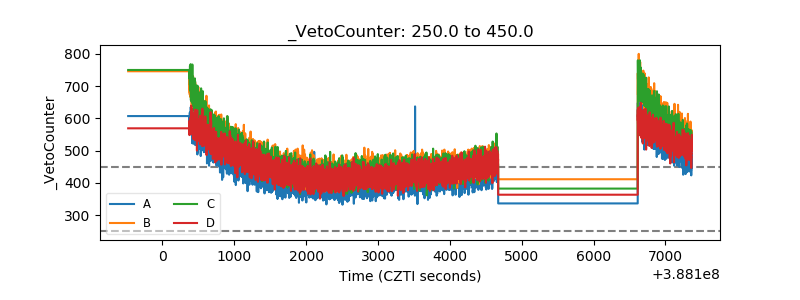 |