| Param | Original file | Final file |
|---|---|---|
| Filename | modeM0/AS1A11_068T03_9000005076_35459cztM0_level2.evt | modeM0/AS1A11_068T03_9000005076_35459cztM0_level2_quad_clean.evt |
| Size (bytes) | 569,626,560 | 100,730,880 |
| Size | 543.2 MB | 96.1 MB |
| Events in quadrant A | 3,080,948 | 677,668 |
| Events in quadrant B | 6,616,825 | 620,888 |
| Events in quadrant C | 3,460,260 | 662,370 |
| Events in quadrant D | 3,651,999 | 635,286 |
| Mode SS | |||
|---|---|---|---|
| Quadrant | BADHDUFLAG | Total packets | Discarded packets |
| A | 0 | 130 | 0 |
| B | 0 | 130 | 0 |
| C | 0 | 130 | 0 |
| D | 0 | 130 | 0 |
| Mode M0 | |||
|---|---|---|---|
| Quadrant | BADHDUFLAG | Total packets | Discarded packets |
| A | 0 | 13274 | 1 |
| B | 0 | 23976 | 1 |
| C | 0 | 14177 | 1 |
| D | 0 | 14931 | 1 |
| Mode M9 | |||
|---|---|---|---|
| Quadrant | BADHDUFLAG | Total packets | Discarded packets |
| A | 0 | 14 | 0 |
| B | 0 | 14 | 0 |
| C | 0 | 14 | 0 |
| D | 0 | 14 | 0 |
| Quadrant | Total seconds | Saturated seconds | Saturation percentage |
|---|---|---|---|
| A | 6518 | 11 | 0.168763% |
| B | 6518 | 1032 | 15.833078% |
| C | 6518 | 80 | 1.227370% |
| D | 6518 | 95 | 1.457502% |
Noise dominated data is calculated using 1-second bins in cleaned event files. If a bin has >2000 counts, and if more than 50% of those come from <1% of pixels, then it is considered to be noise-dominated and hence unusable.
| Quadrant | # 1 sec bins | Bins with >0 counts | Bins with >2000 counts | High rate bins dominated by noise | Noise dominated (total time) | Noise dominated (detector-on time) | Marked lightcurve |
|---|---|---|---|---|---|---|---|
| A | 7832 | 6519 | 3 | 3 | 0.04% | 0.05% | 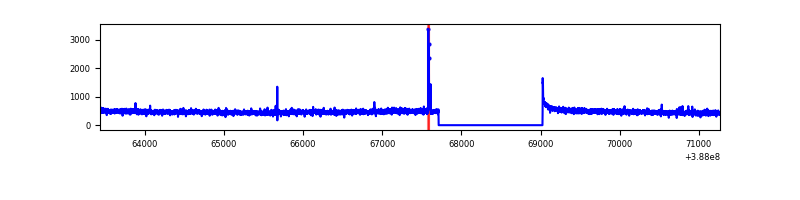 |
| B | 7832 | 6519 | 808 | 808 | 10.32% | 12.39% | 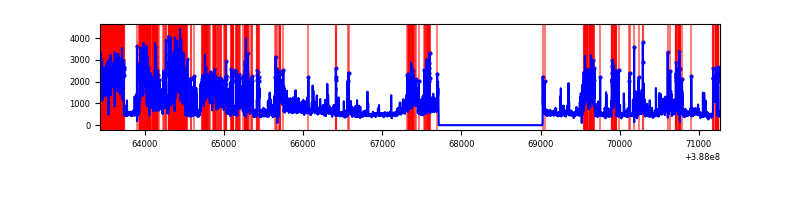 |
| C | 7832 | 6519 | 53 | 53 | 0.68% | 0.81% | 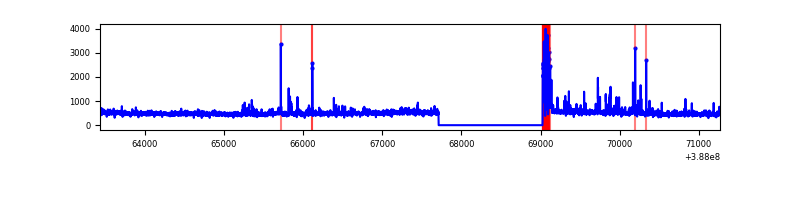 |
| D | 7832 | 6519 | 71 | 71 | 0.91% | 1.09% | 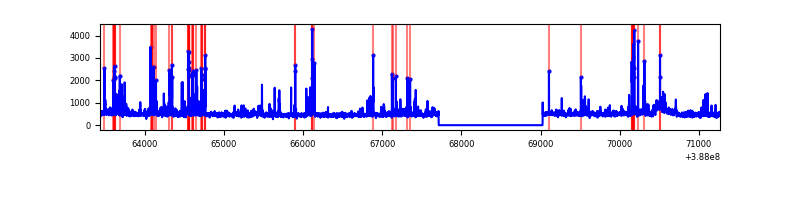 |
Top three noisy pixels from each quadrant. If the there are fewer than three noisy pixels in the level2.evt file, extra rows are filled as -1
| Pixel properties | Quadrant properties | ||||||
|---|---|---|---|---|---|---|---|
| Quadrant | DetID | PixID | Counts | Sigma | Mean | Median | Sigma |
| A | 10 | 83 | 109390 | 716.48 | 750 | 735 | 151.7 |
| A | 13 | 6 | 48122 | 312.48 | 750 | 735 | 151.7 |
| A | 9 | 143 | 25020 | 160.14 | 750 | 735 | 151.7 |
| B | 4 | 251 | 2376662 | 17690.08 | 696 | 680 | 134.3 |
| B | 5 | 236 | 858061 | 6383.52 | 696 | 680 | 134.3 |
| B | 5 | 172 | 411740 | 3060.5 | 696 | 680 | 134.3 |
| C | 15 | 214 | 259796 | 1530.25 | 725 | 729 | 169.3 |
| C | 0 | 10 | 215700 | 1269.78 | 725 | 729 | 169.3 |
| C | 0 | 207 | 153042 | 899.68 | 725 | 729 | 169.3 |
| D | 13 | 249 | 223676 | 1238.21 | 728 | 707 | 180.1 |
| D | 8 | 195 | 153462 | 848.29 | 728 | 707 | 180.1 |
| D | 1 | 47 | 96316 | 530.94 | 728 | 707 | 180.1 |
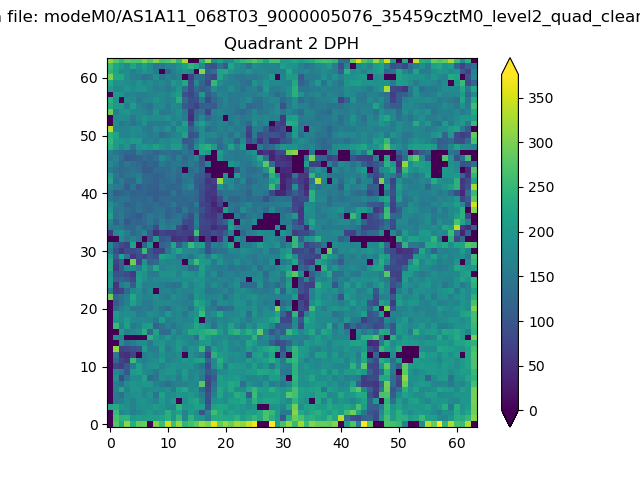
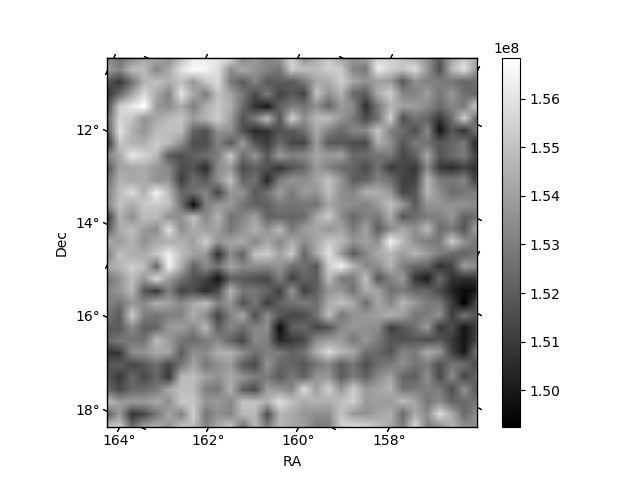
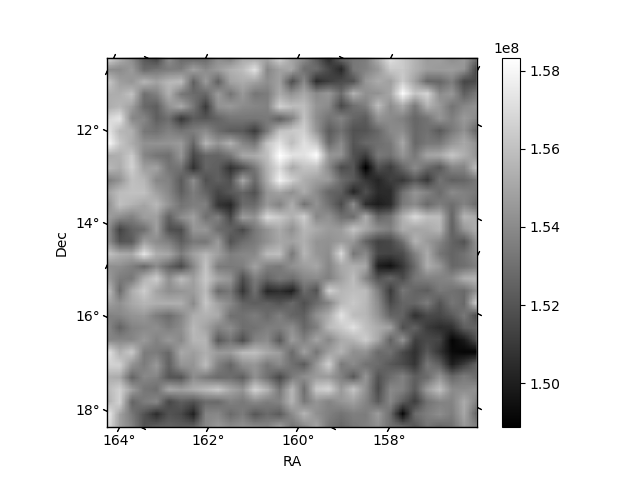
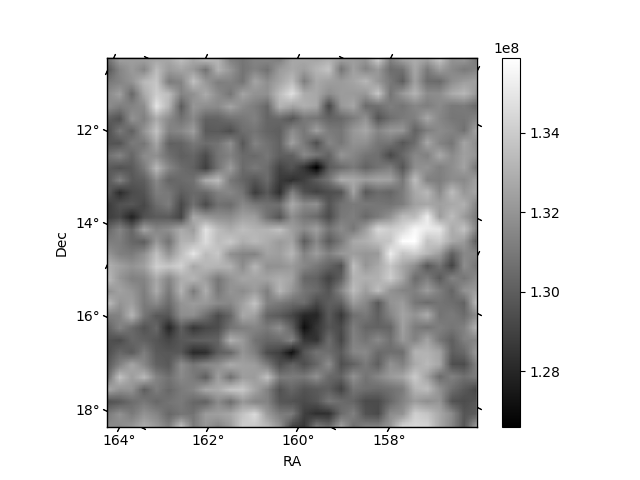
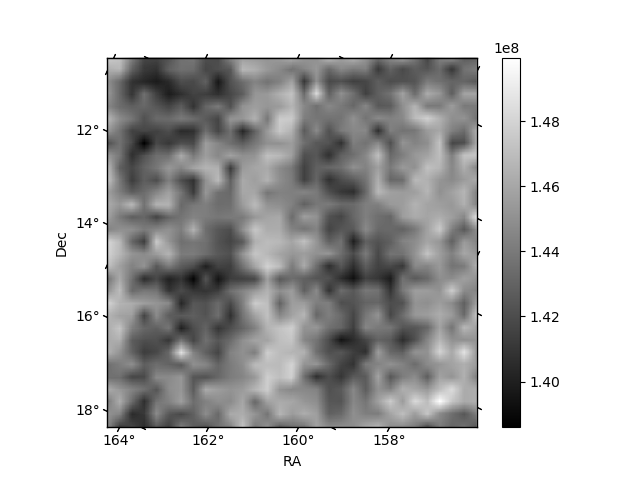
Histogram calculated using DETX and DETY for each event in the final _common_clean file
| Quadrant A | 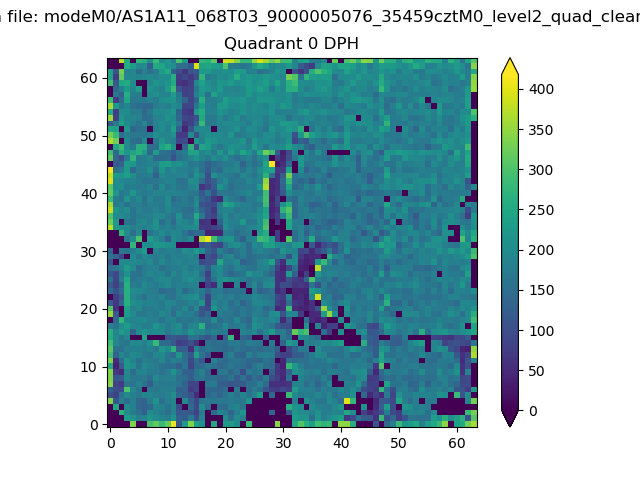 |
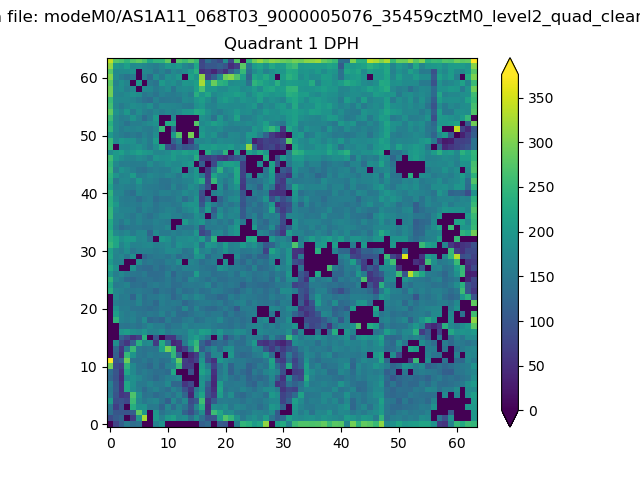 |
Quadrant B |
|---|---|---|---|
| Quadrant D | 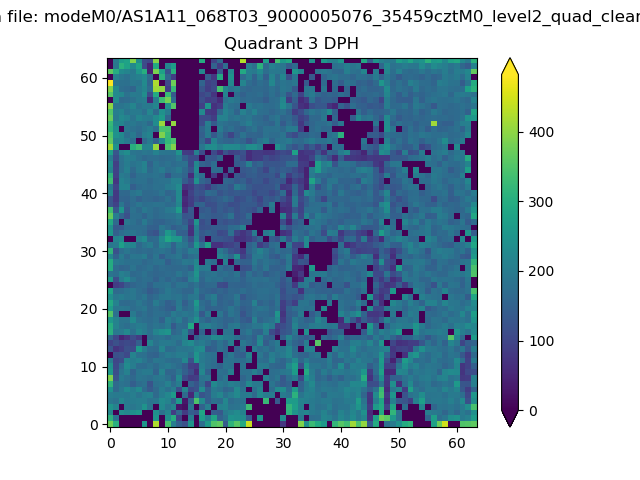 |
 |
Quadrant C |
| Plot type | Count rate plots | Images |
|---|---|---|
| Comparison with Poisson distribution Blue bars denote a histogram of data divided into 1 sec bins. Red curve is a Poisson curve with rate = median count rate of data. |
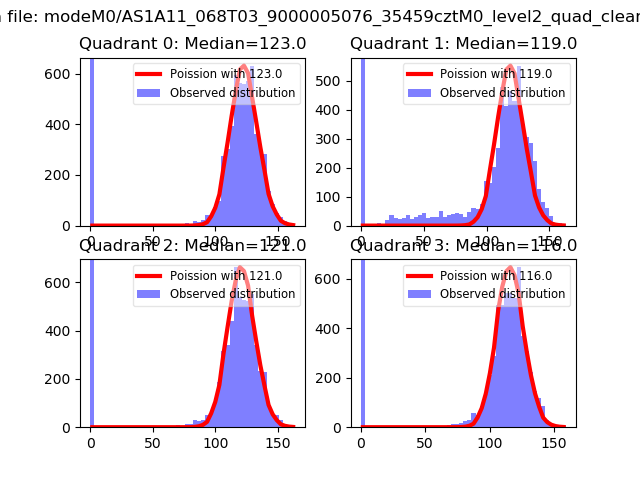 |
 |
| Quadrant-wise count rates Data is divided into 100 sec bins |
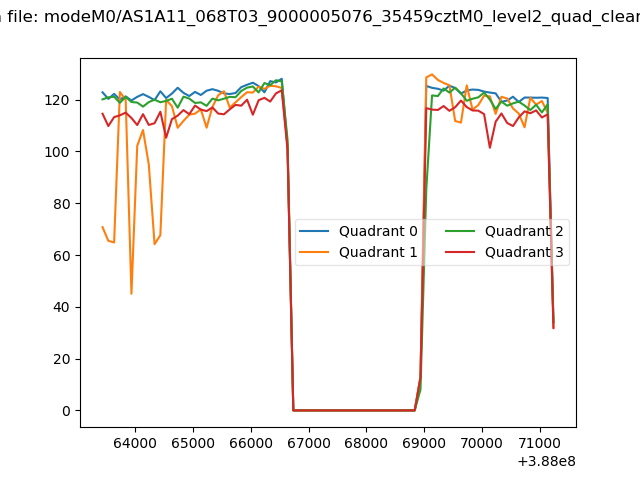 |
|
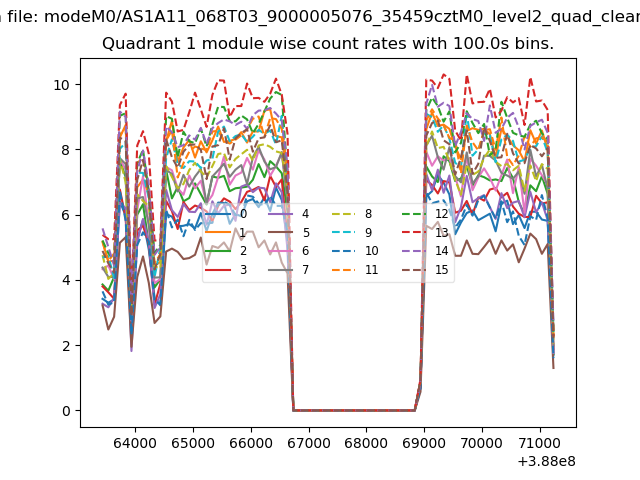
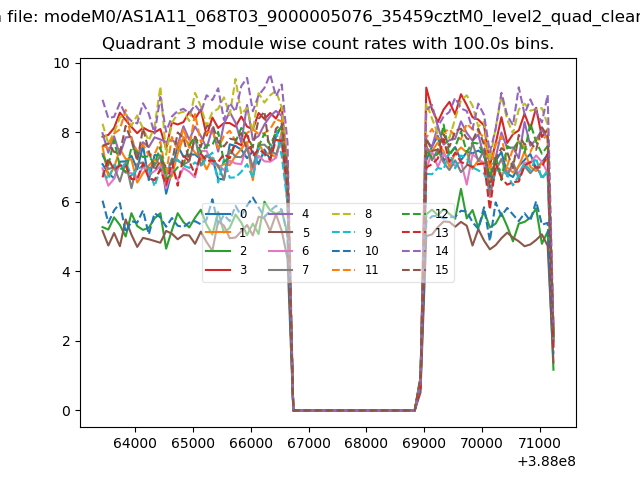
| Module-wise count rates for Quadrant A Data is divided into 100 sec bins |
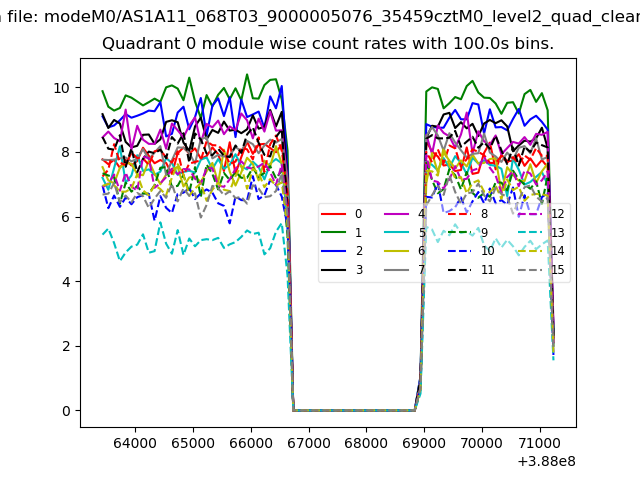 |
 |
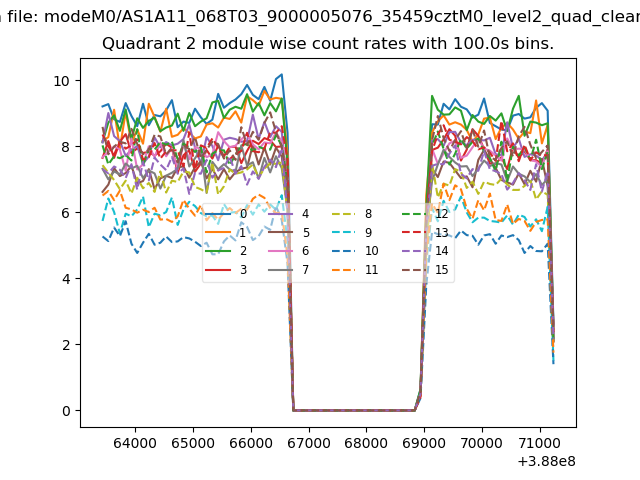
| Module-wise count rates for Quadrant B Data is divided into 100 sec bins |
 |
 |
| Module-wise count rates for Quadrant C Data is divided into 100 sec bins |
 |
 |
| Module-wise count rates for Quadrant D Data is divided into 100 sec bins |
 |
 |
| Parameter | Plot |
|---|---|
| CZT HV Monitor | 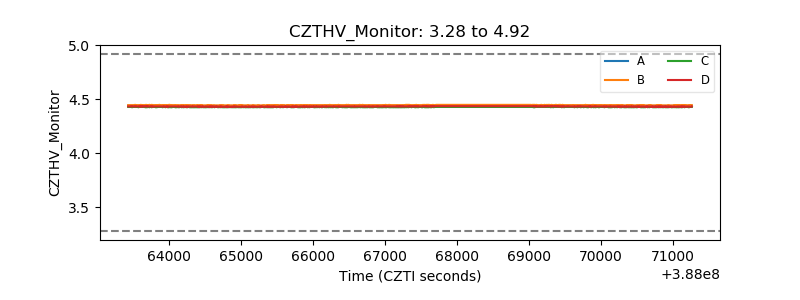 |
| D_VDD | 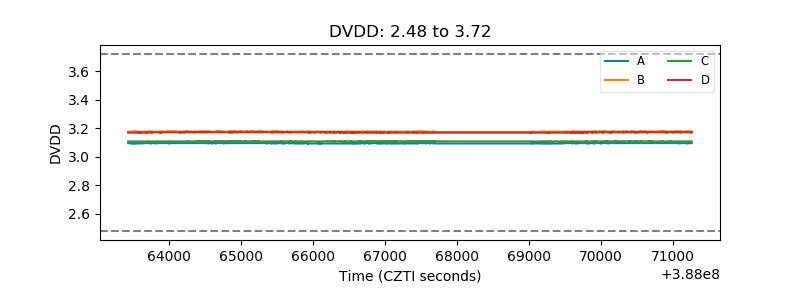 |
| Temperature 1 | 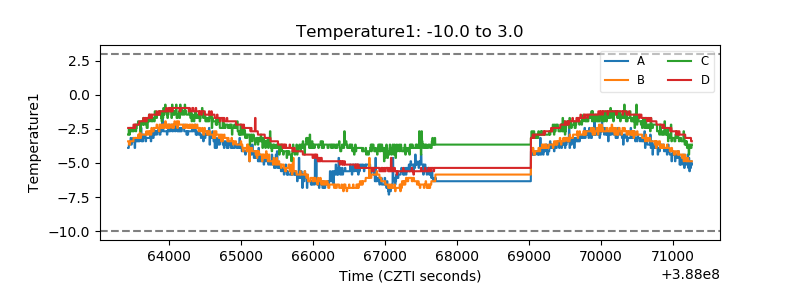 |
| Veto HV Monitor | 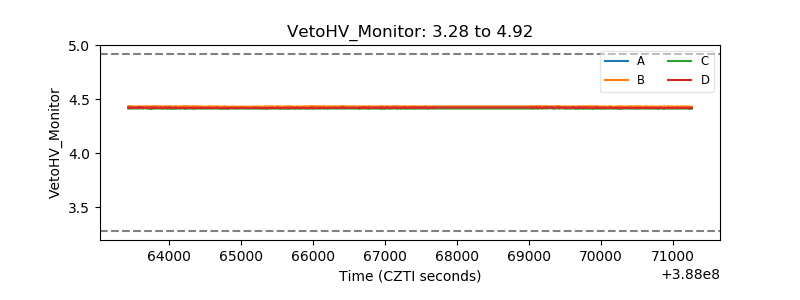 |
| Veto LLD | 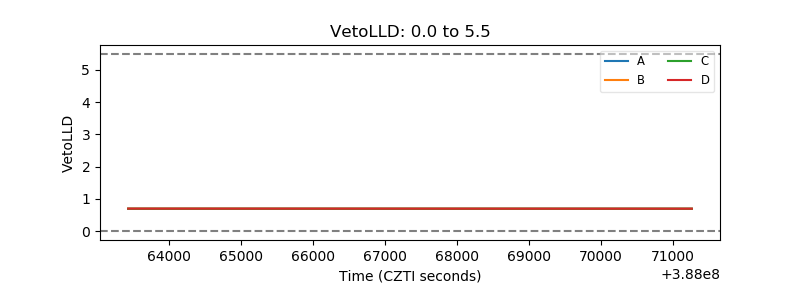 |
| Alpha Counter | 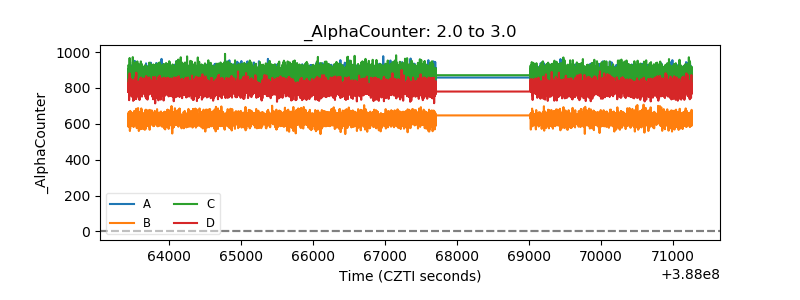 |
| _CPM_Rate | 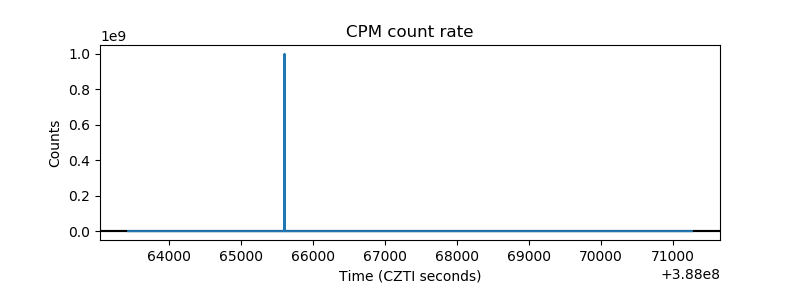 |
| CZT Counter | 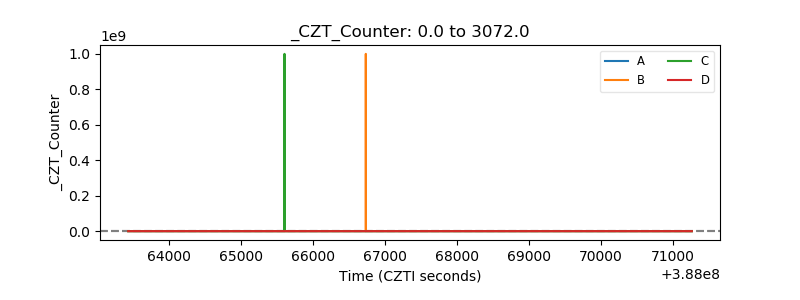 |
| +2.5 Volts monitor | 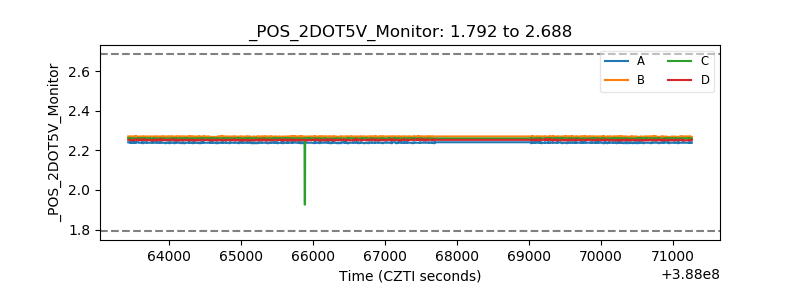 |
| +5 Volts monitor | 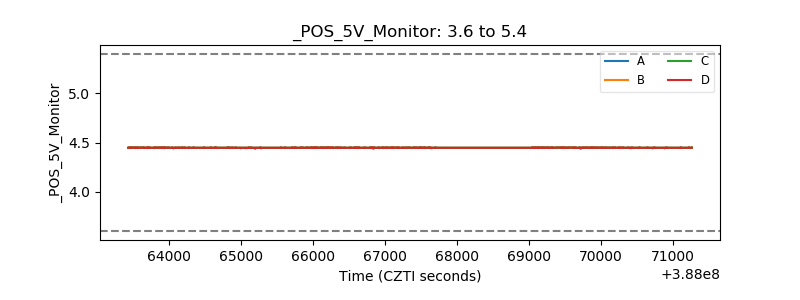 |
| _ROLL_ROT | 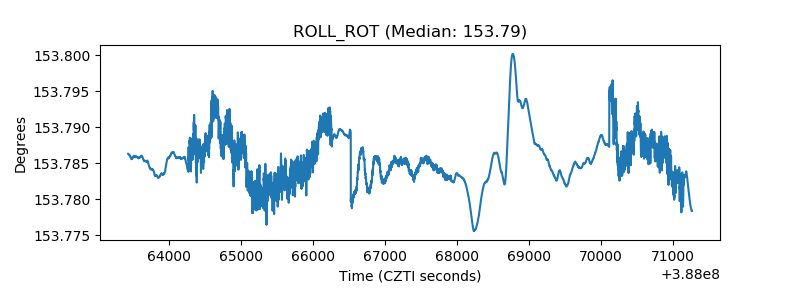 |
| _Roll_DEC | 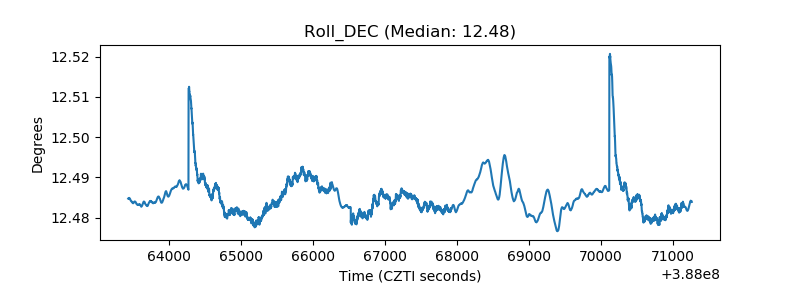 |
| _Roll_RA | 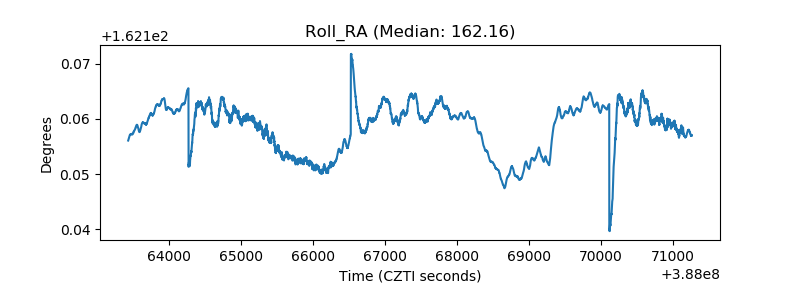 |
| Veto Counter | 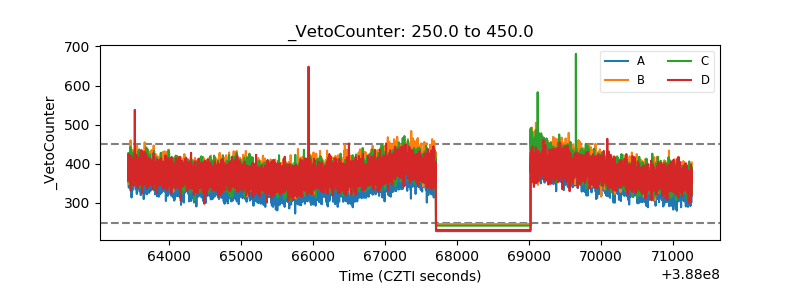 |