| Param | Original file | Final file |
|---|---|---|
| Filename | modeM0/AS1A11_068T03_9000005076_35454cztM0_level2.evt | modeM0/AS1A11_068T03_9000005076_35454cztM0_level2_quad_clean.evt |
| Size (bytes) | 442,117,440 | 72,604,800 |
| Size | 421.6 MB | 69.2 MB |
| Events in quadrant A | 2,729,574 | 460,700 |
| Events in quadrant B | 3,615,978 | 458,713 |
| Events in quadrant C | 3,320,268 | 453,065 |
| Events in quadrant D | 3,340,635 | 431,509 |
| Mode SS | |||
|---|---|---|---|
| Quadrant | BADHDUFLAG | Total packets | Discarded packets |
| A | 0 | 116 | 0 |
| B | 0 | 116 | 0 |
| C | 0 | 116 | 0 |
| D | 0 | 116 | 0 |
| Mode M0 | |||
|---|---|---|---|
| Quadrant | BADHDUFLAG | Total packets | Discarded packets |
| A | 0 | 11517 | 3 |
| B | 0 | 14193 | 2 |
| C | 0 | 13115 | 2 |
| D | 0 | 13578 | 2 |
| Mode M9 | |||
|---|---|---|---|
| Quadrant | BADHDUFLAG | Total packets | Discarded packets |
| A | 0 | 29 | 0 |
| B | 0 | 29 | 0 |
| C | 0 | 29 | 0 |
| D | 0 | 30 | 0 |
| Quadrant | Total seconds | Saturated seconds | Saturation percentage |
|---|---|---|---|
| A | 5636 | 7 | 0.124202% |
| B | 5636 | 158 | 2.803407% |
| C | 5636 | 109 | 1.933996% |
| D | 5636 | 75 | 1.330731% |
Noise dominated data is calculated using 1-second bins in cleaned event files. If a bin has >2000 counts, and if more than 50% of those come from <1% of pixels, then it is considered to be noise-dominated and hence unusable.
| Quadrant | # 1 sec bins | Bins with >0 counts | Bins with >2000 counts | High rate bins dominated by noise | Noise dominated (total time) | Noise dominated (detector-on time) | Marked lightcurve |
|---|---|---|---|---|---|---|---|
| A | 7159 | 5637 | 0 | 0 | 0.00% | 0.00% | 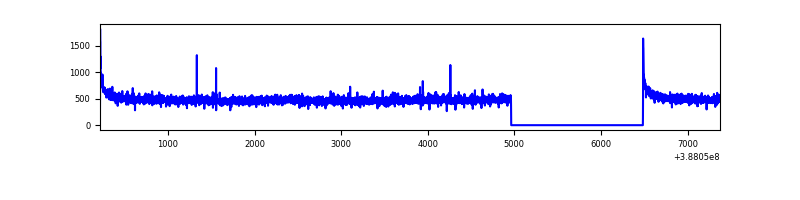 |
| B | 7159 | 5637 | 83 | 83 | 1.16% | 1.47% | 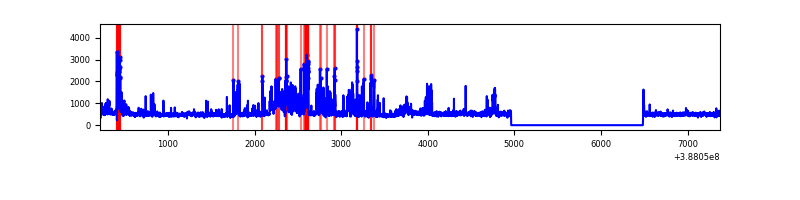 |
| C | 7159 | 5637 | 72 | 72 | 1.01% | 1.28% | 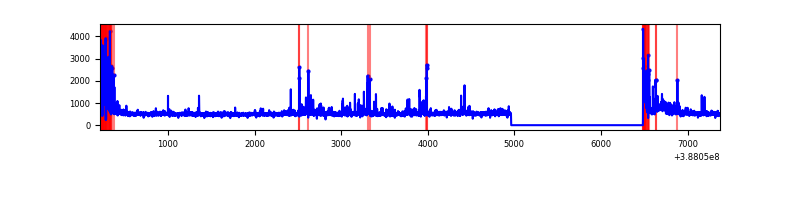 |
| D | 7159 | 5637 | 70 | 70 | 0.98% | 1.24% | 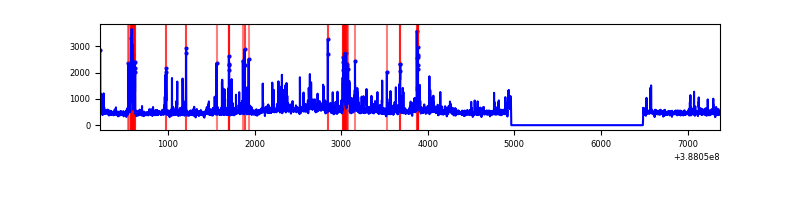 |
Top three noisy pixels from each quadrant. If the there are fewer than three noisy pixels in the level2.evt file, extra rows are filled as -1
| Pixel properties | Quadrant properties | ||||||
|---|---|---|---|---|---|---|---|
| Quadrant | DetID | PixID | Counts | Sigma | Mean | Median | Sigma |
| A | 10 | 83 | 131039 | 963.95 | 665 | 651 | 135.3 |
| A | 13 | 6 | 22569 | 162.04 | 665 | 651 | 135.3 |
| A | 13 | 254 | 8997 | 61.7 | 665 | 651 | 135.3 |
| B | 4 | 251 | 579147 | 4543.83 | 654 | 638 | 127.3 |
| B | 5 | 172 | 176876 | 1384.24 | 654 | 638 | 127.3 |
| B | 5 | 236 | 152826 | 1195.34 | 654 | 638 | 127.3 |
| C | 0 | 10 | 408835 | 2729.36 | 640 | 643 | 149.6 |
| C | 15 | 214 | 233187 | 1554.9 | 640 | 643 | 149.6 |
| C | 0 | 207 | 115117 | 765.43 | 640 | 643 | 149.6 |
| D | 13 | 249 | 178297 | 1113.98 | 641 | 621 | 159.5 |
| D | 10 | 118 | 115664 | 721.29 | 641 | 621 | 159.5 |
| D | 8 | 195 | 114668 | 715.05 | 641 | 621 | 159.5 |
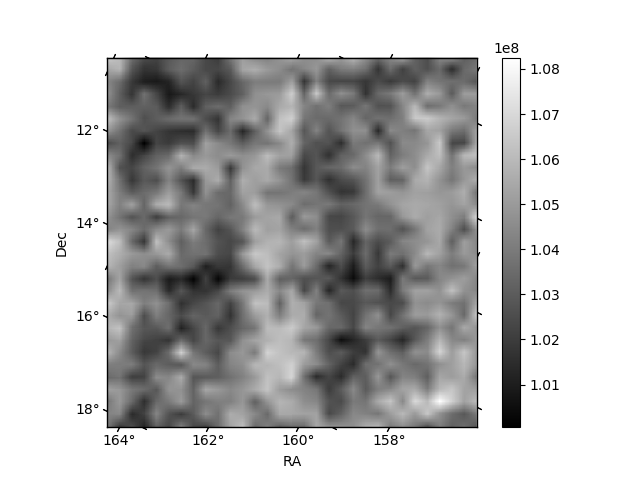
Histogram calculated using DETX and DETY for each event in the final _common_clean file
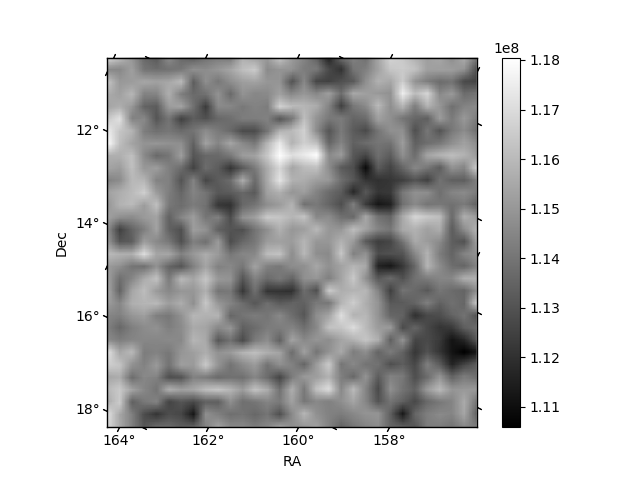
| Quadrant A | 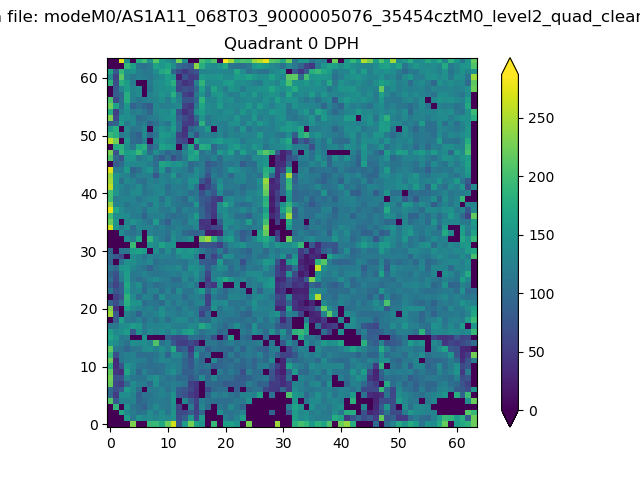 |
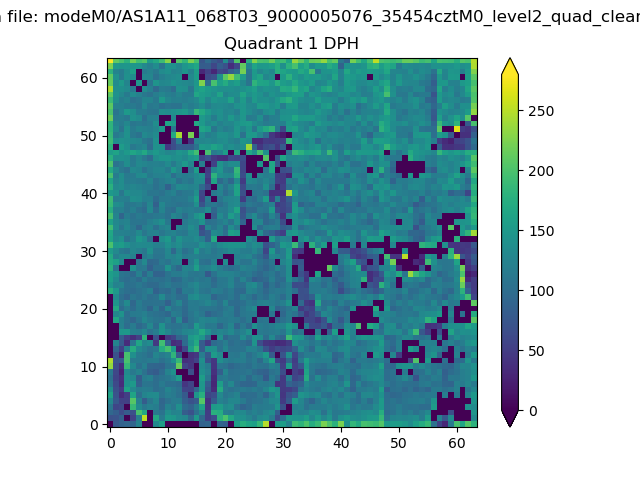 |
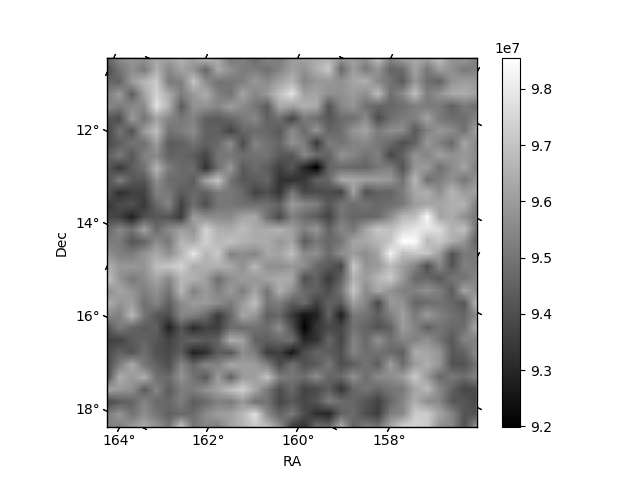
Quadrant B |
|---|---|---|---|
| Quadrant D | 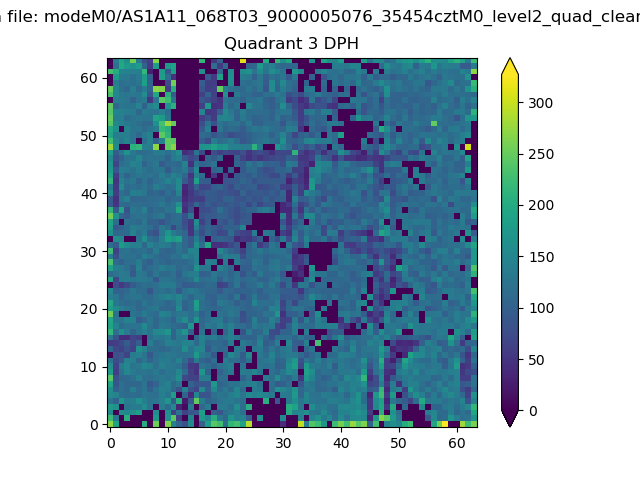 |
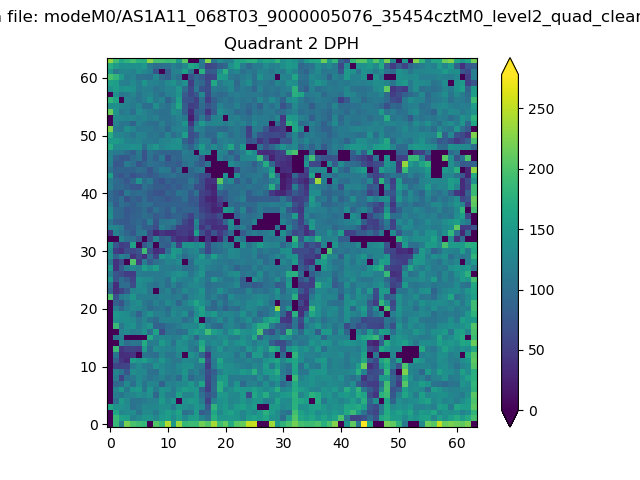 |
Quadrant C |
| Plot type | Count rate plots | Images |
|---|---|---|
| Comparison with Poisson distribution Blue bars denote a histogram of data divided into 1 sec bins. Red curve is a Poisson curve with rate = median count rate of data. |
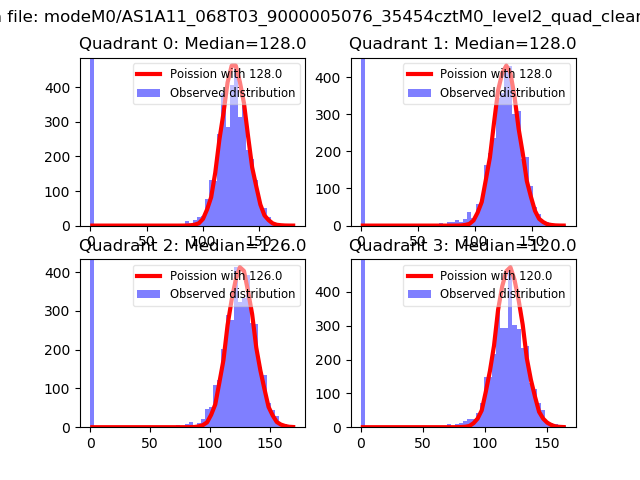 |
 |
| Quadrant-wise count rates Data is divided into 100 sec bins |
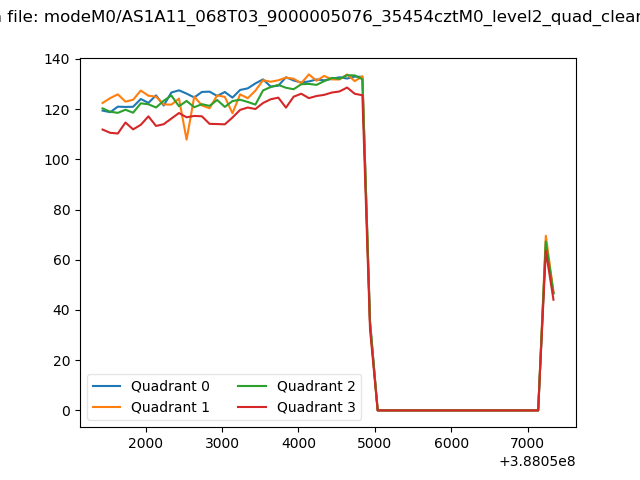 |
|
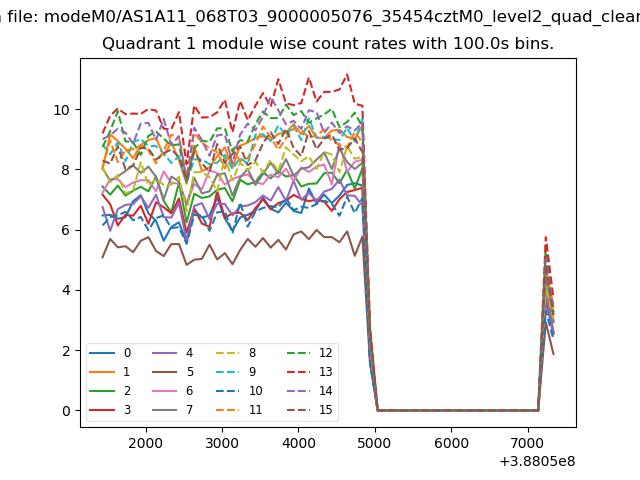
| Module-wise count rates for Quadrant A Data is divided into 100 sec bins |
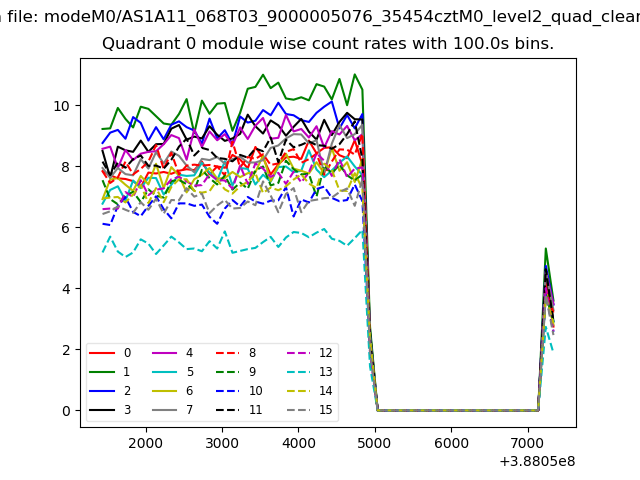 |
 |
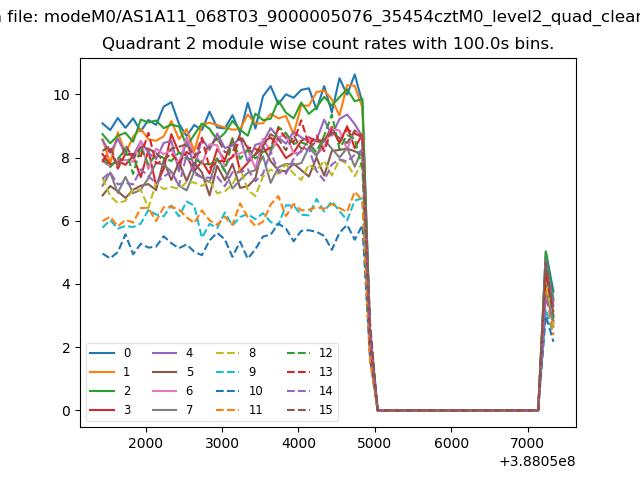
| Module-wise count rates for Quadrant B Data is divided into 100 sec bins |
 |
 |
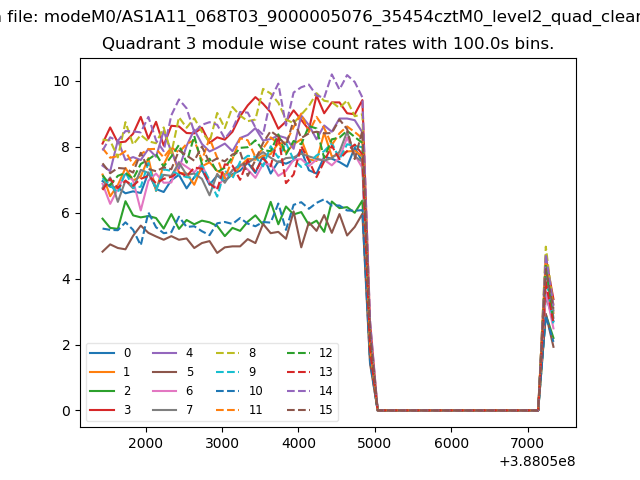
| Module-wise count rates for Quadrant C Data is divided into 100 sec bins |
 |
 |
| Module-wise count rates for Quadrant D Data is divided into 100 sec bins |
 |
 |
| Parameter | Plot |
|---|---|
| CZT HV Monitor |  |
| D_VDD | 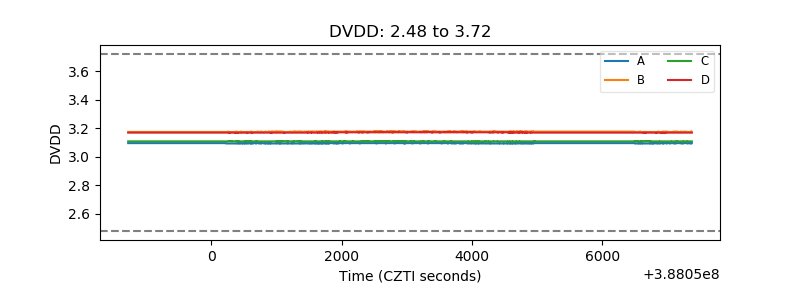 |
| Temperature 1 | 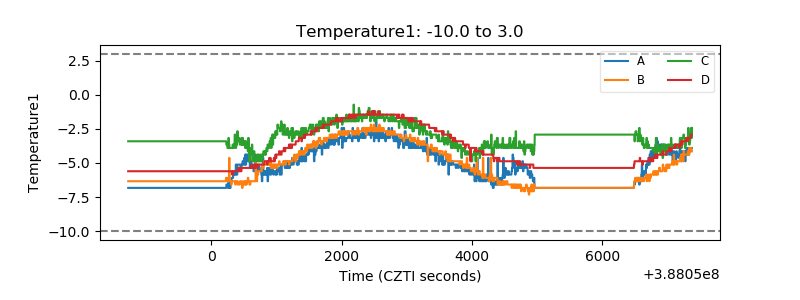 |
| Veto HV Monitor | 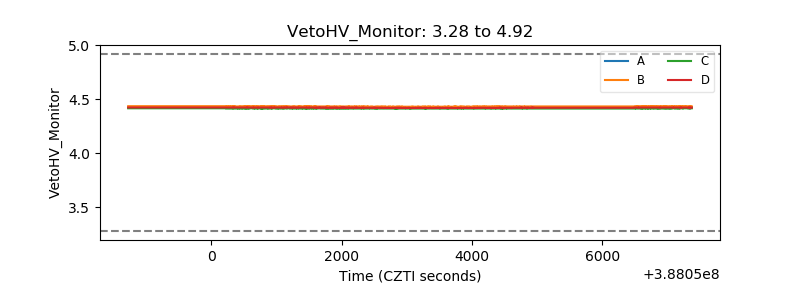 |
| Veto LLD | 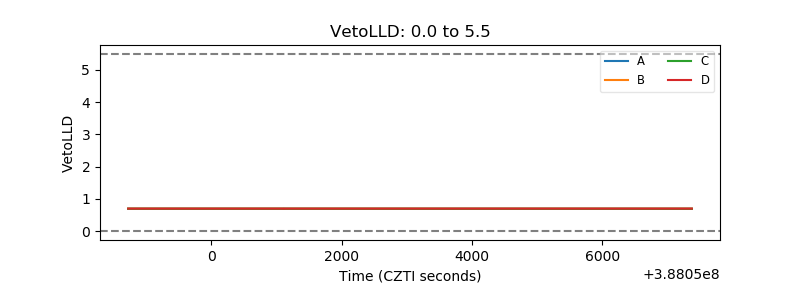 |
| Alpha Counter | 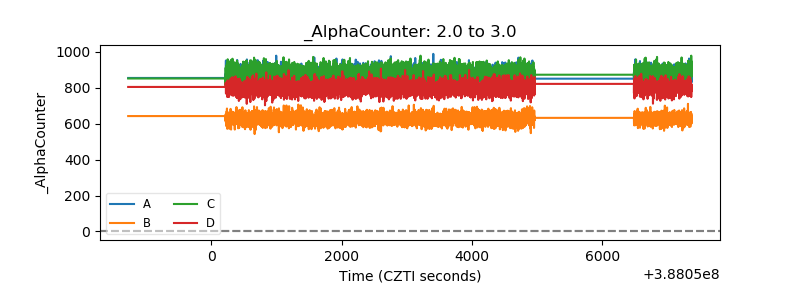 |
| _CPM_Rate | 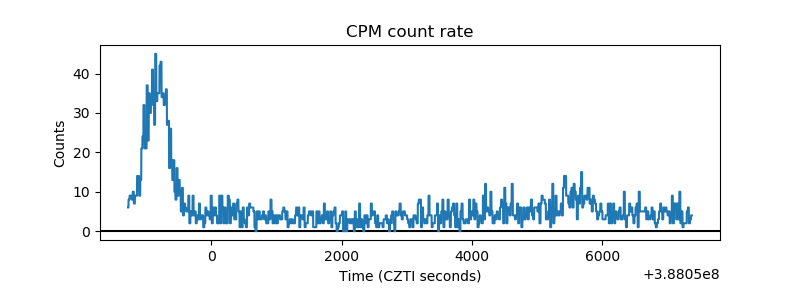 |
| CZT Counter | 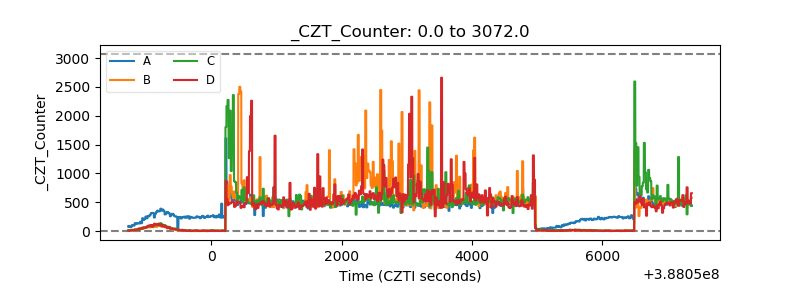 |
| +2.5 Volts monitor | 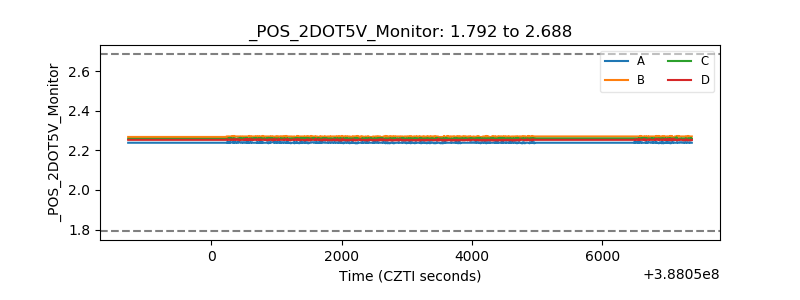 |
| +5 Volts monitor | 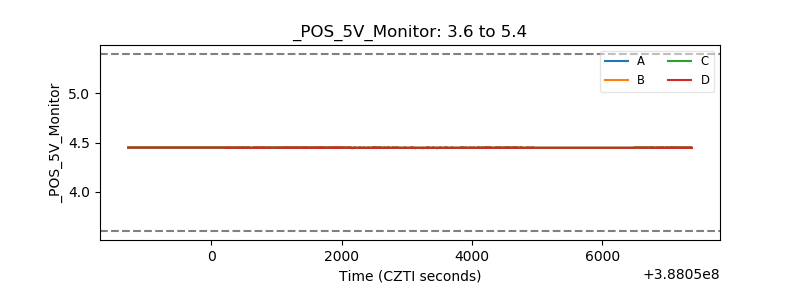 |
| _ROLL_ROT | 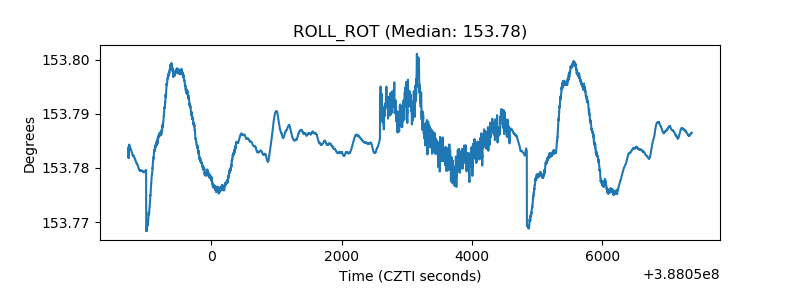 |
| _Roll_DEC | 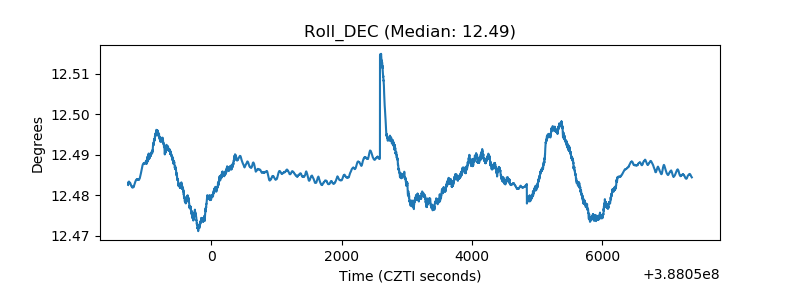 |
| _Roll_RA | 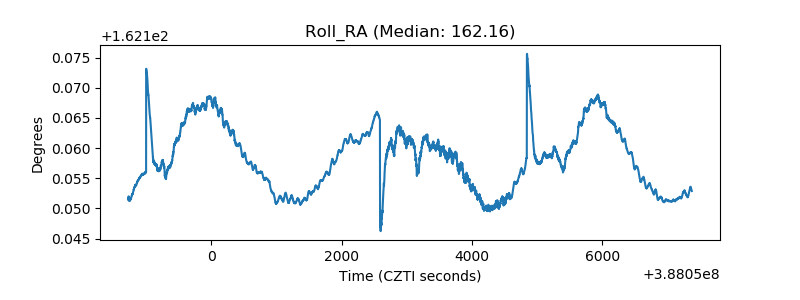 |
| Veto Counter | 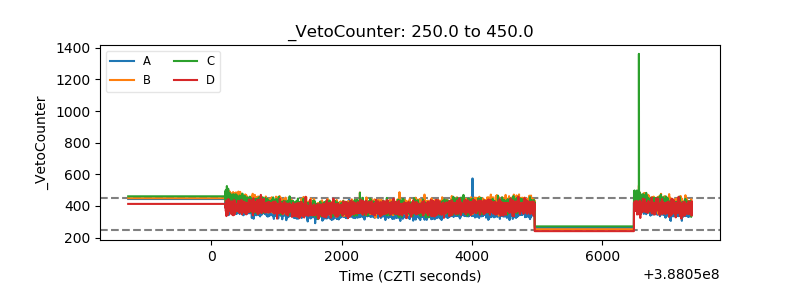 |