| Param | Original file | Final file |
|---|---|---|
| Filename | modeM0/AS1A11_068T03_9000005076_35453cztM0_level2.evt | modeM0/AS1A11_068T03_9000005076_35453cztM0_level2_quad_clean.evt |
| Size (bytes) | 476,628,480 | 62,648,640 |
| Size | 454.5 MB | 59.7 MB |
| Events in quadrant A | 2,749,104 | 388,800 |
| Events in quadrant B | 4,351,672 | 377,047 |
| Events in quadrant C | 3,621,624 | 379,066 |
| Events in quadrant D | 3,334,694 | 362,273 |
| Mode SS | |||
|---|---|---|---|
| Quadrant | BADHDUFLAG | Total packets | Discarded packets |
| A | 0 | 116 | 0 |
| B | 0 | 116 | 0 |
| C | 0 | 116 | 0 |
| D | 0 | 116 | 0 |
| Mode M0 | |||
|---|---|---|---|
| Quadrant | BADHDUFLAG | Total packets | Discarded packets |
| A | 0 | 11450 | 3 |
| B | 0 | 16588 | 2 |
| C | 0 | 14017 | 2 |
| D | 0 | 13498 | 2 |
| Mode M9 | |||
|---|---|---|---|
| Quadrant | BADHDUFLAG | Total packets | Discarded packets |
| A | 0 | 39 | 0 |
| B | 0 | 39 | 0 |
| C | 0 | 39 | 0 |
| D | 0 | 39 | 0 |
| Quadrant | Total seconds | Saturated seconds | Saturation percentage |
|---|---|---|---|
| A | 5565 | 9 | 0.161725% |
| B | 5565 | 264 | 4.743935% |
| C | 5565 | 190 | 3.414196% |
| D | 5565 | 90 | 1.617251% |
Noise dominated data is calculated using 1-second bins in cleaned event files. If a bin has >2000 counts, and if more than 50% of those come from <1% of pixels, then it is considered to be noise-dominated and hence unusable.
| Quadrant | # 1 sec bins | Bins with >0 counts | Bins with >2000 counts | High rate bins dominated by noise | Noise dominated (total time) | Noise dominated (detector-on time) | Marked lightcurve |
|---|---|---|---|---|---|---|---|
| A | 9510 | 5567 | 2 | 2 | 0.02% | 0.04% | 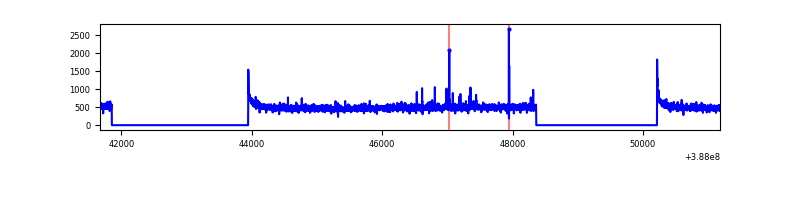 |
| B | 9510 | 5567 | 177 | 177 | 1.86% | 3.18% | 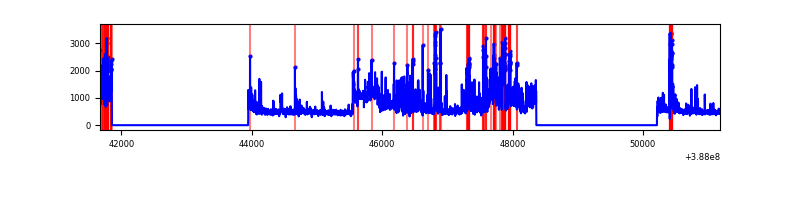 |
| C | 9510 | 5567 | 139 | 139 | 1.46% | 2.50% | 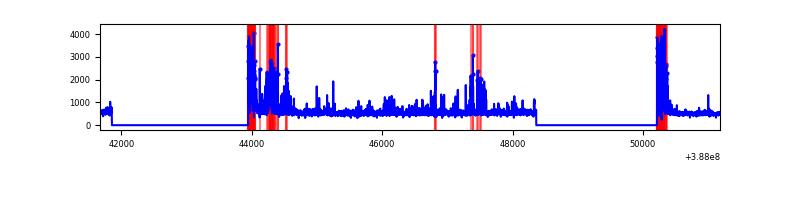 |
| D | 9510 | 5567 | 73 | 73 | 0.77% | 1.31% | 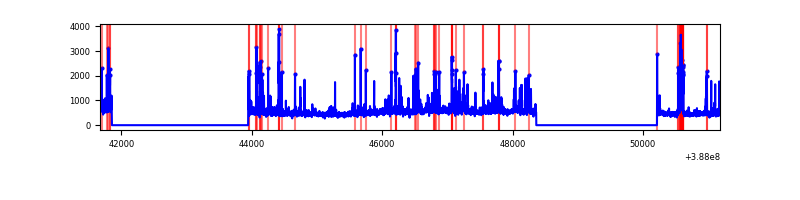 |
Top three noisy pixels from each quadrant. If the there are fewer than three noisy pixels in the level2.evt file, extra rows are filled as -1
| Pixel properties | Quadrant properties | ||||||
|---|---|---|---|---|---|---|---|
| Quadrant | DetID | PixID | Counts | Sigma | Mean | Median | Sigma |
| A | 10 | 83 | 131947 | 971.99 | 666 | 651 | 135.1 |
| A | 9 | 143 | 22227 | 159.73 | 666 | 651 | 135.1 |
| A | 13 | 6 | 12027 | 84.22 | 666 | 651 | 135.1 |
| B | 4 | 251 | 1063915 | 8465.34 | 650 | 633 | 125.6 |
| B | 5 | 200 | 320106 | 2543.49 | 650 | 633 | 125.6 |
| B | 5 | 172 | 206952 | 1642.61 | 650 | 633 | 125.6 |
| C | 0 | 10 | 822990 | 5550.02 | 637 | 641 | 148.2 |
| C | 15 | 214 | 227928 | 1533.96 | 637 | 641 | 148.2 |
| C | 0 | 207 | 48164 | 320.73 | 637 | 641 | 148.2 |
| D | 13 | 249 | 274675 | 1744.27 | 641 | 622 | 157.1 |
| D | 1 | 52 | 144954 | 918.63 | 641 | 622 | 157.1 |
| D | 8 | 195 | 129704 | 821.57 | 641 | 622 | 157.1 |
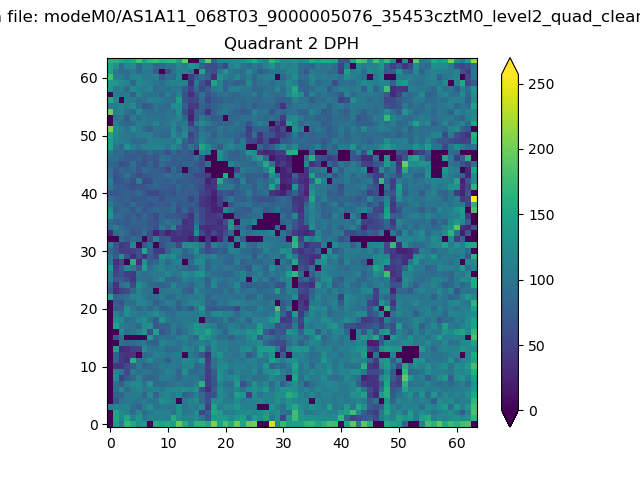
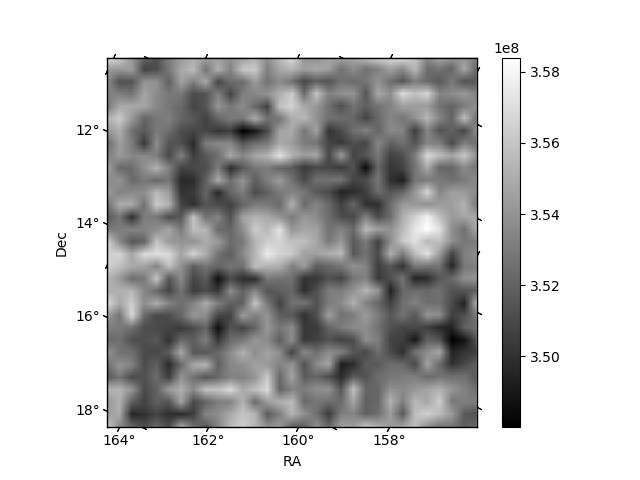
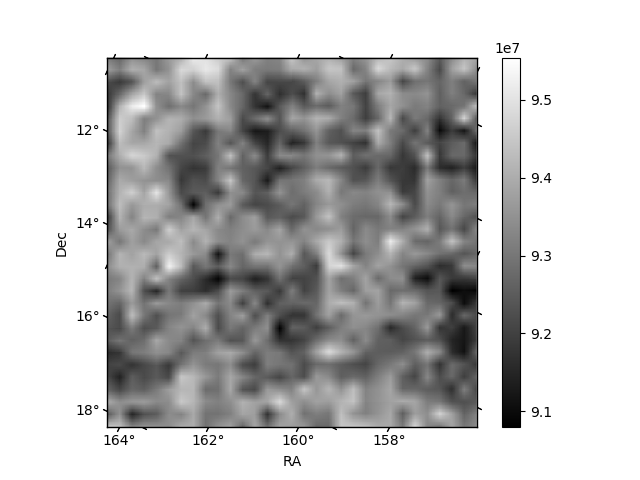
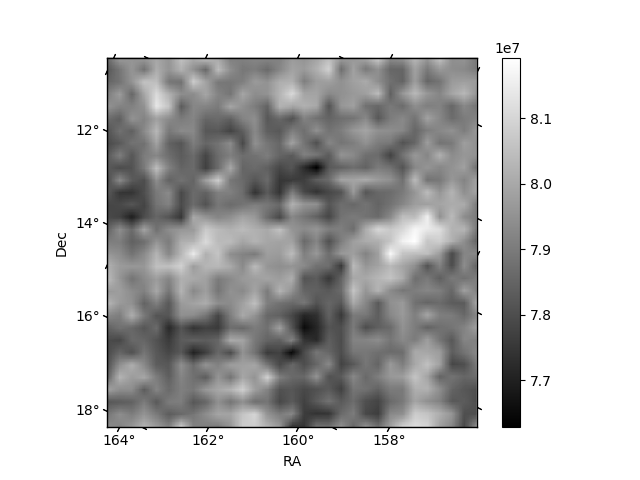
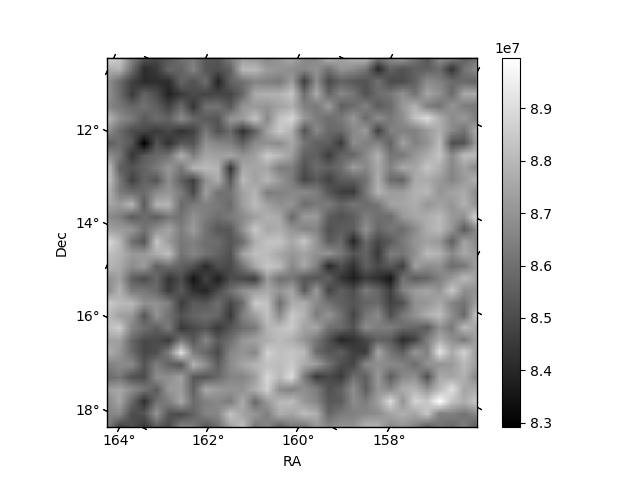
Histogram calculated using DETX and DETY for each event in the final _common_clean file
| Quadrant A | 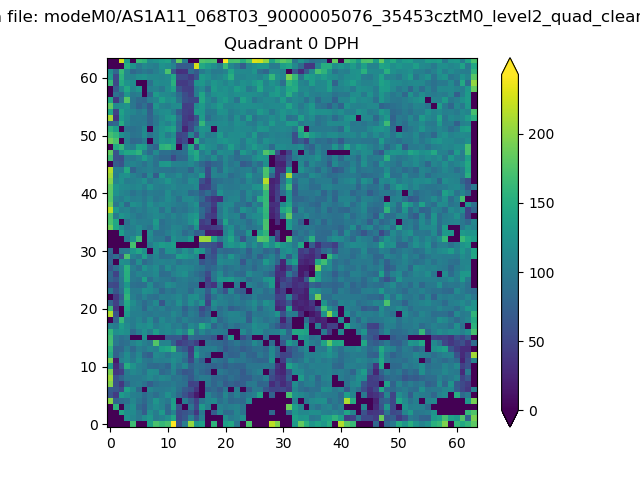 |
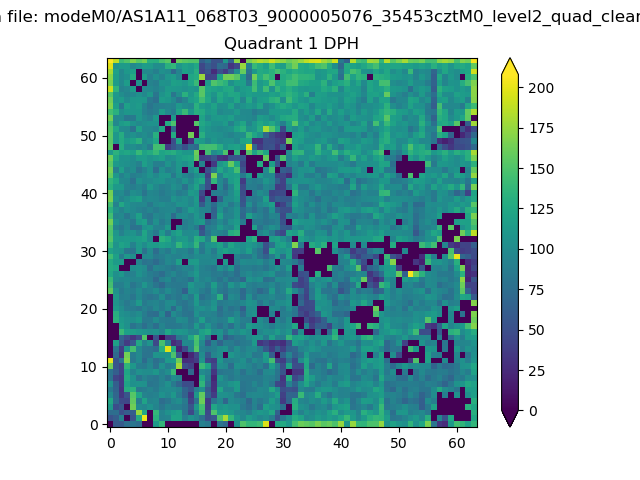 |
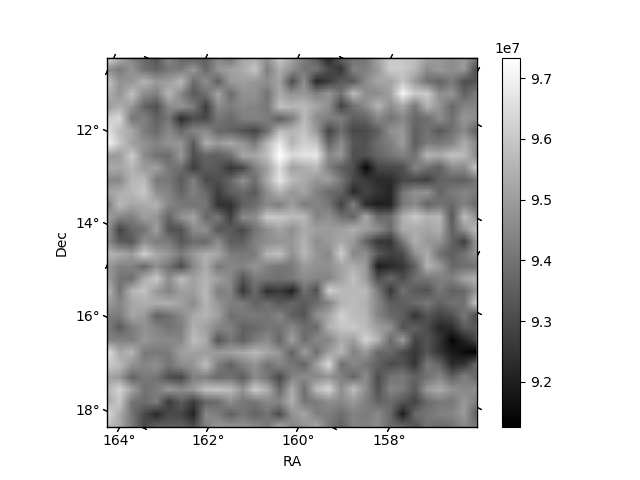
Quadrant B |
|---|---|---|---|
| Quadrant D | 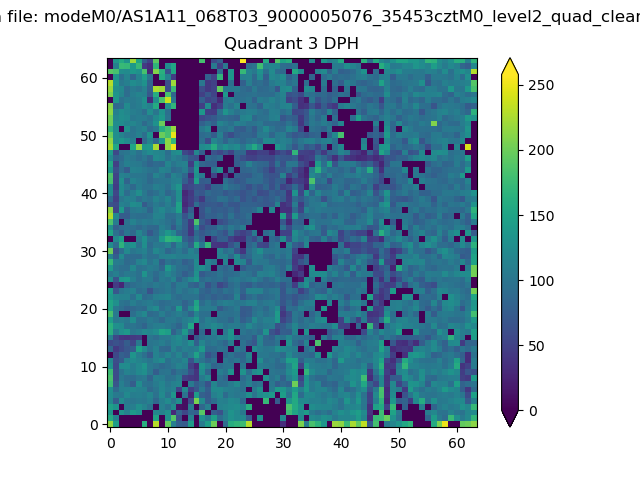 |
 |
Quadrant C |
| Plot type | Count rate plots | Images |
|---|---|---|
| Comparison with Poisson distribution Blue bars denote a histogram of data divided into 1 sec bins. Red curve is a Poisson curve with rate = median count rate of data. |
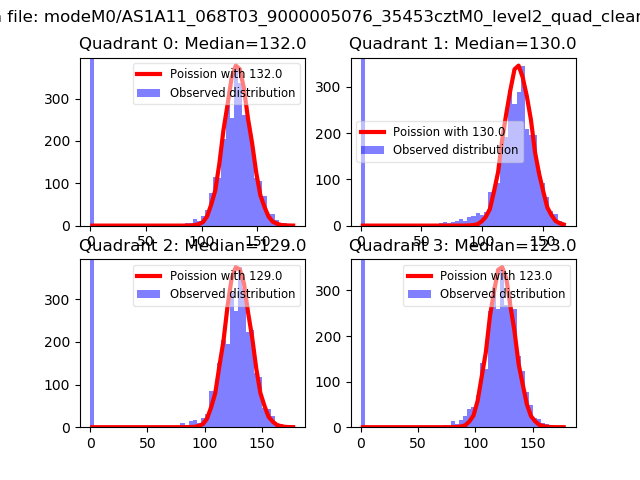 |
 |
| Quadrant-wise count rates Data is divided into 100 sec bins |
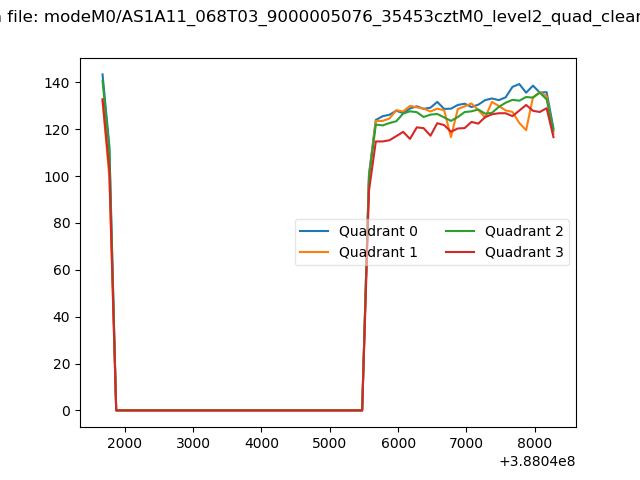 |
|
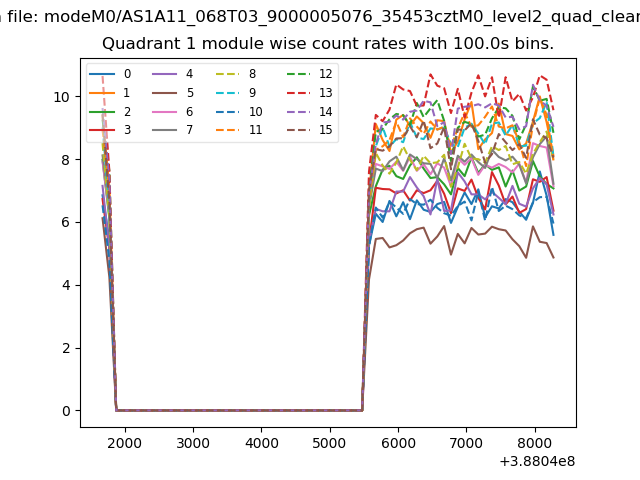
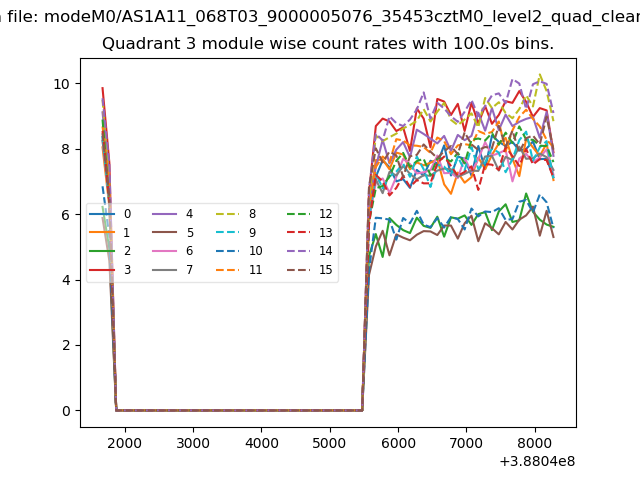
| Module-wise count rates for Quadrant A Data is divided into 100 sec bins |
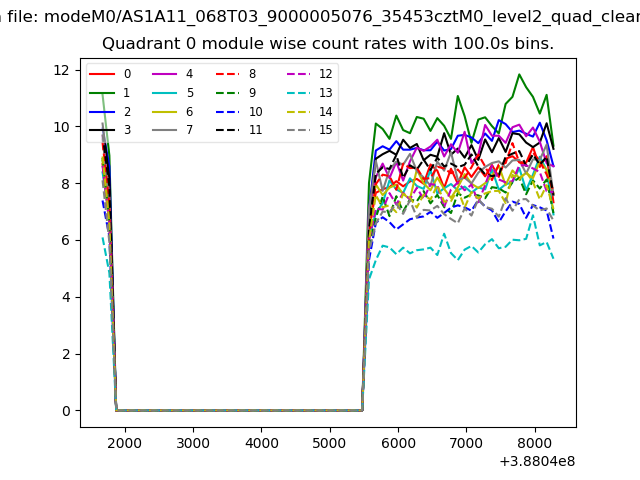 |
 |
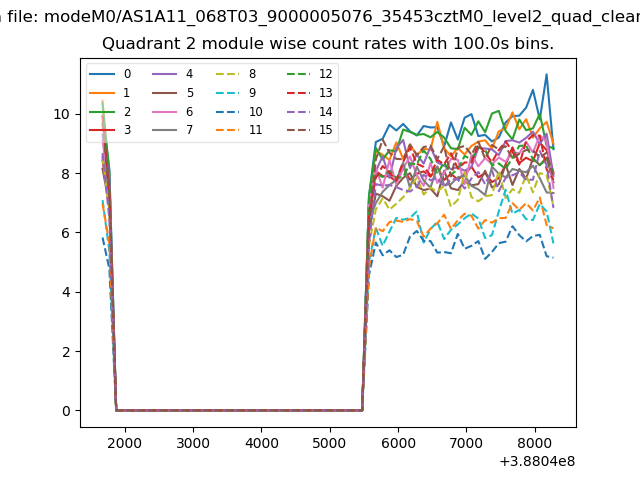
| Module-wise count rates for Quadrant B Data is divided into 100 sec bins |
 |
 |
| Module-wise count rates for Quadrant C Data is divided into 100 sec bins |
 |
 |
| Module-wise count rates for Quadrant D Data is divided into 100 sec bins |
 |
 |
| Parameter | Plot |
|---|---|
| CZT HV Monitor | 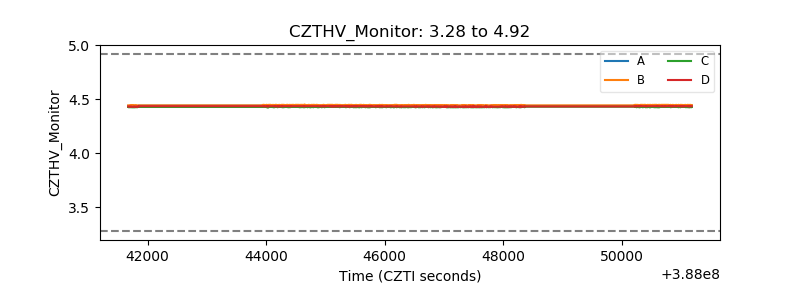 |
| D_VDD | 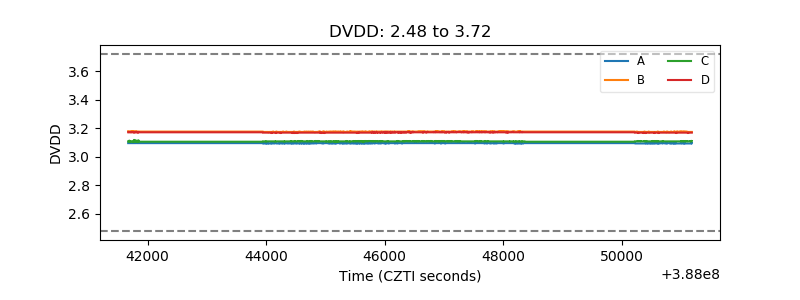 |
| Temperature 1 | 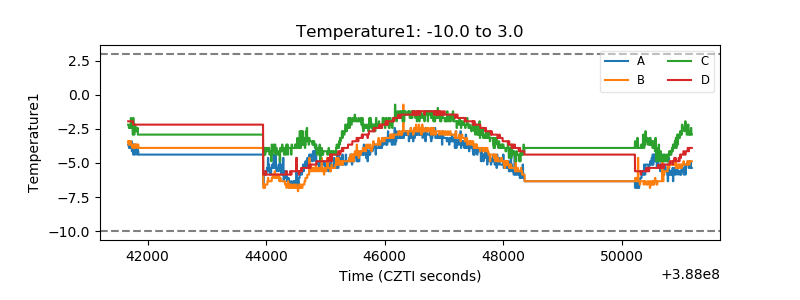 |
| Veto HV Monitor | 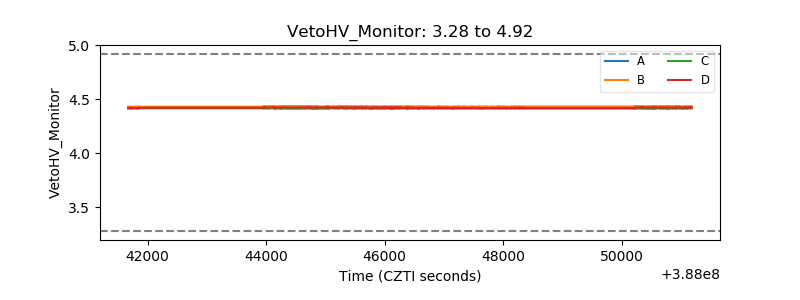 |
| Veto LLD | 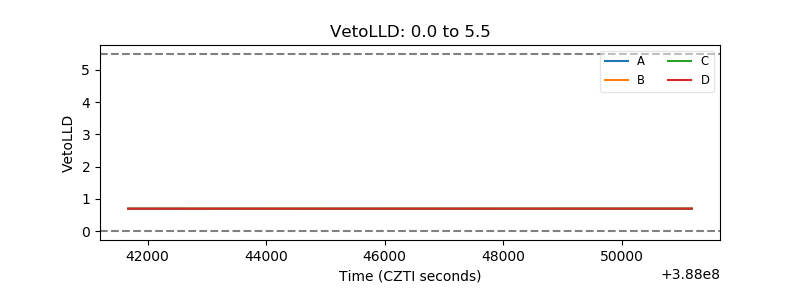 |
| Alpha Counter | 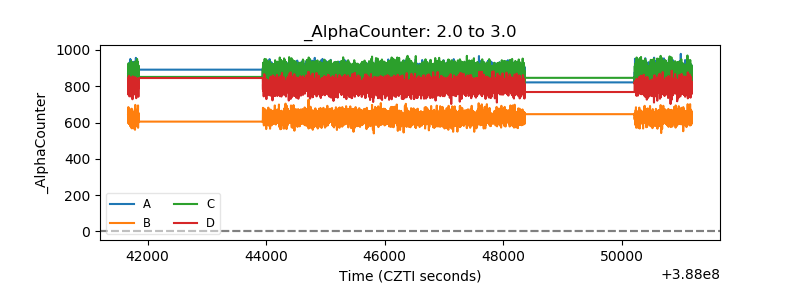 |
| _CPM_Rate | 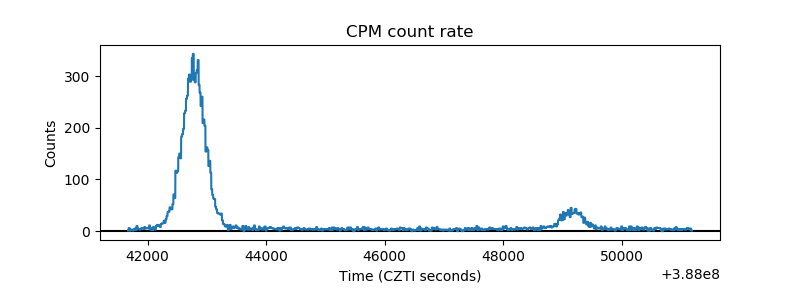 |
| CZT Counter | 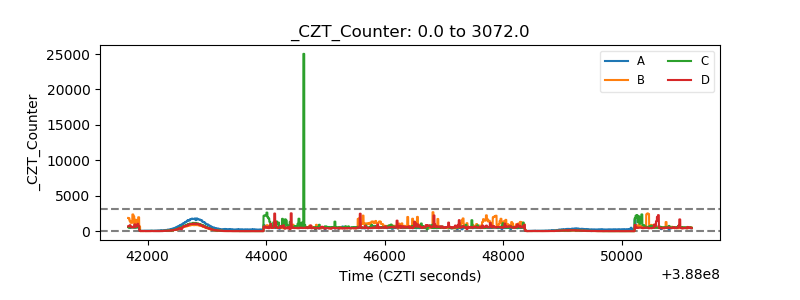 |
| +2.5 Volts monitor | 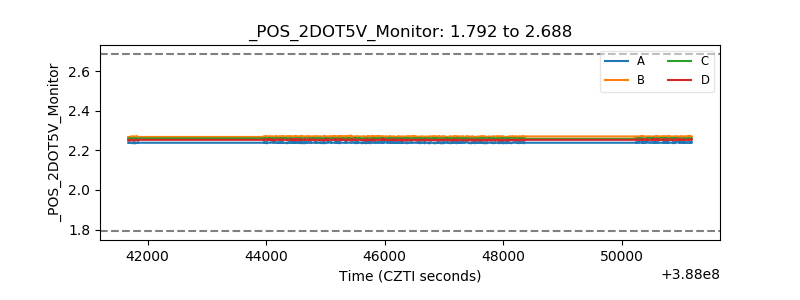 |
| +5 Volts monitor | 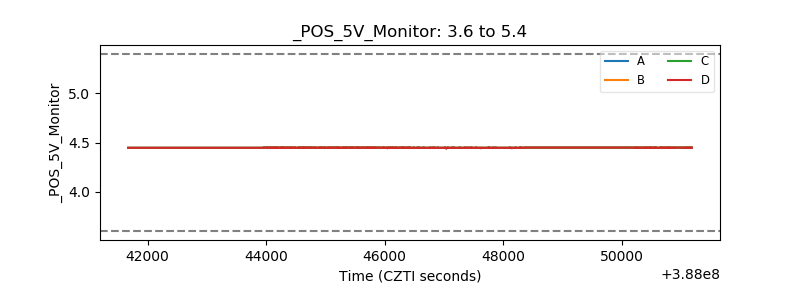 |
| _ROLL_ROT | 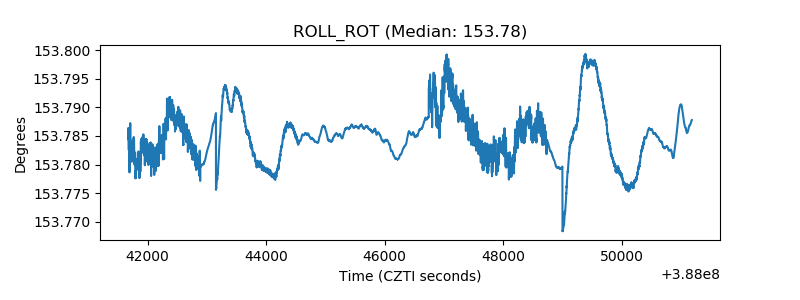 |
| _Roll_DEC | 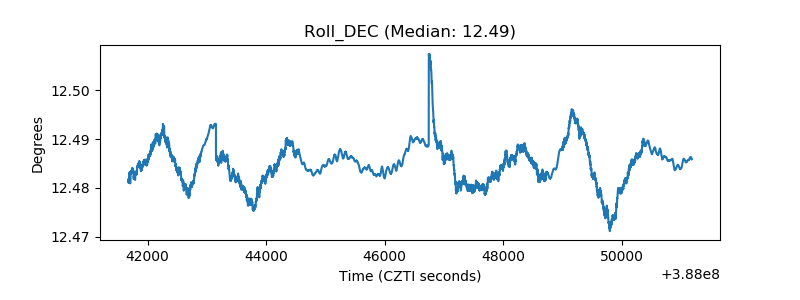 |
| _Roll_RA | 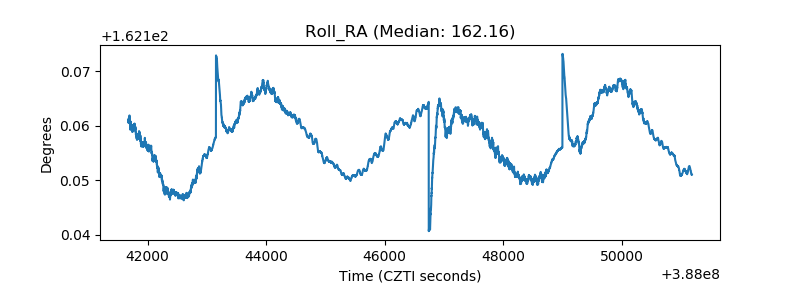 |
| Veto Counter | 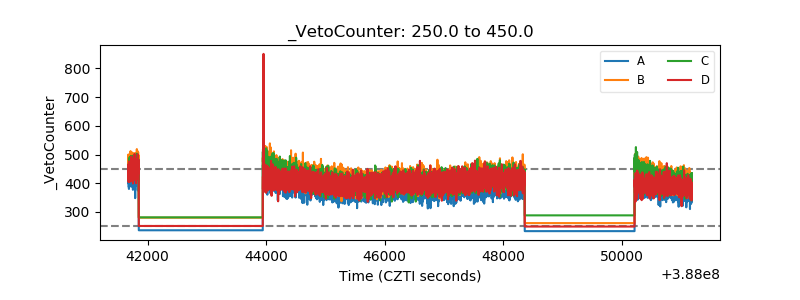 |