| Param | Original file | Final file |
|---|---|---|
| Filename | modeM0/AS1A11_068T03_9000005076_35450cztM0_level2.evt | modeM0/AS1A11_068T03_9000005076_35450cztM0_level2_quad_clean.evt |
| Size (bytes) | 455,302,080 | 52,571,520 |
| Size | 434.2 MB | 50.1 MB |
| Events in quadrant A | 2,703,320 | 324,449 |
| Events in quadrant B | 4,010,653 | 322,245 |
| Events in quadrant C | 3,183,710 | 305,627 |
| Events in quadrant D | 3,553,055 | 289,490 |
| Mode SS | |||
|---|---|---|---|
| Quadrant | BADHDUFLAG | Total packets | Discarded packets |
| A | 0 | 100 | 0 |
| B | 0 | 100 | 0 |
| C | 0 | 100 | 0 |
| D | 0 | 100 | 0 |
| Mode M0 | |||
|---|---|---|---|
| Quadrant | BADHDUFLAG | Total packets | Discarded packets |
| A | 0 | 10860 | 3 |
| B | 0 | 15278 | 2 |
| C | 0 | 12295 | 2 |
| D | 0 | 13710 | 2 |
| Mode M9 | |||
|---|---|---|---|
| Quadrant | BADHDUFLAG | Total packets | Discarded packets |
| A | 0 | 28 | 0 |
| B | 0 | 28 | 0 |
| C | 0 | 28 | 0 |
| D | 0 | 29 | 0 |
| Quadrant | Total seconds | Saturated seconds | Saturation percentage |
|---|---|---|---|
| A | 4987 | 22 | 0.441147% |
| B | 4987 | 311 | 6.236214% |
| C | 4987 | 164 | 3.288550% |
| D | 4987 | 306 | 6.135953% |
Noise dominated data is calculated using 1-second bins in cleaned event files. If a bin has >2000 counts, and if more than 50% of those come from <1% of pixels, then it is considered to be noise-dominated and hence unusable.
| Quadrant | # 1 sec bins | Bins with >0 counts | Bins with >2000 counts | High rate bins dominated by noise | Noise dominated (total time) | Noise dominated (detector-on time) | Marked lightcurve |
|---|---|---|---|---|---|---|---|
| A | 7079 | 4988 | 9 | 9 | 0.13% | 0.18% | 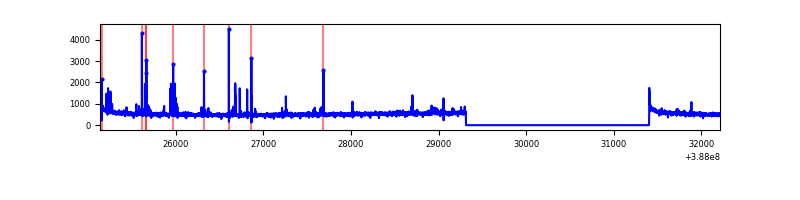 |
| B | 7079 | 4988 | 168 | 168 | 2.37% | 3.37% | 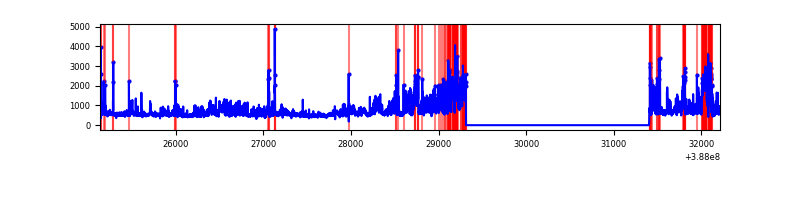 |
| C | 7079 | 4988 | 127 | 127 | 1.79% | 2.55% | 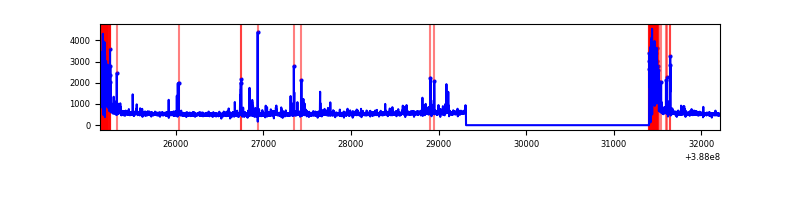 |
| D | 7079 | 4988 | 223 | 223 | 3.15% | 4.47% | 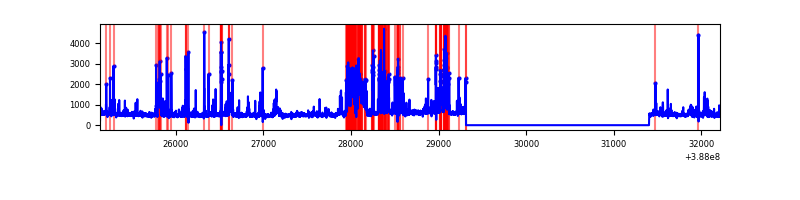 |
Top three noisy pixels from each quadrant. If the there are fewer than three noisy pixels in the level2.evt file, extra rows are filled as -1
| Pixel properties | Quadrant properties | ||||||
|---|---|---|---|---|---|---|---|
| Quadrant | DetID | PixID | Counts | Sigma | Mean | Median | Sigma |
| A | 10 | 83 | 121870 | 951.17 | 636 | 625 | 127.5 |
| A | 9 | 143 | 93699 | 730.17 | 636 | 625 | 127.5 |
| A | 13 | 6 | 22453 | 171.24 | 636 | 625 | 127.5 |
| B | 4 | 251 | 817167 | 6969.02 | 624 | 609 | 117.2 |
| B | 5 | 236 | 386869 | 3296.59 | 624 | 609 | 117.2 |
| B | 5 | 172 | 134242 | 1140.51 | 624 | 609 | 117.2 |
| C | 0 | 10 | 489953 | 3489.33 | 606 | 612 | 140.2 |
| C | 15 | 214 | 205146 | 1458.47 | 606 | 612 | 140.2 |
| C | 0 | 207 | 90796 | 643.07 | 606 | 612 | 140.2 |
| D | 13 | 249 | 750907 | 5151.4 | 592 | 576 | 145.7 |
| D | 8 | 195 | 178519 | 1221.67 | 592 | 576 | 145.7 |
| D | 12 | 233 | 139658 | 954.87 | 592 | 576 | 145.7 |
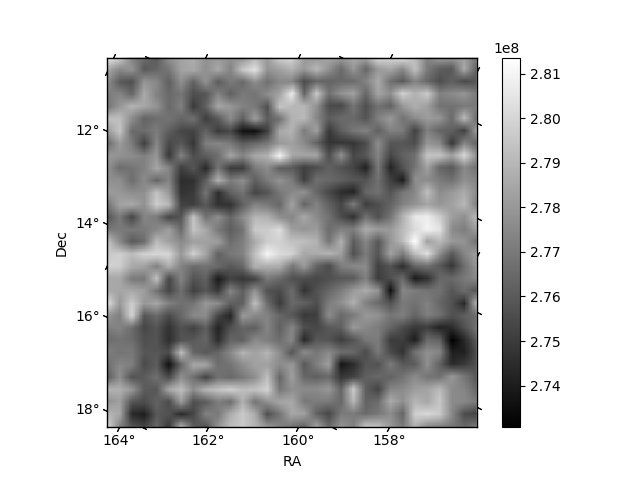
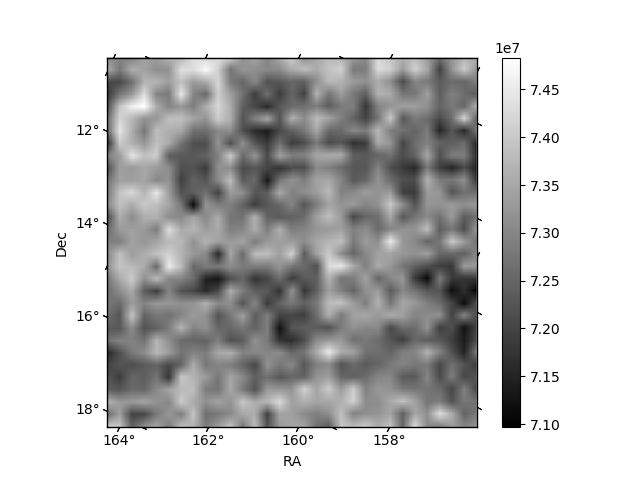
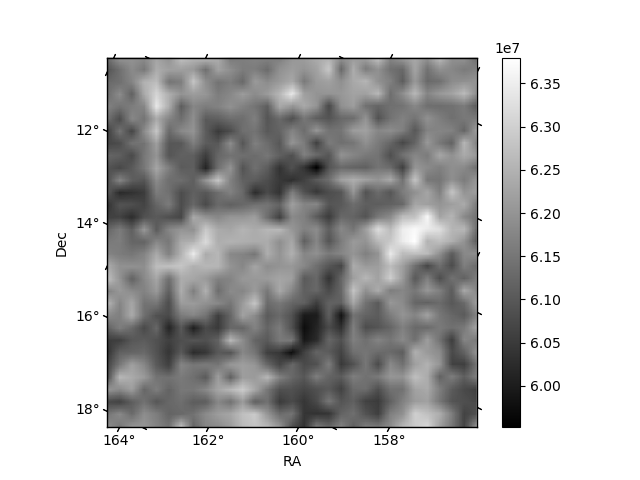
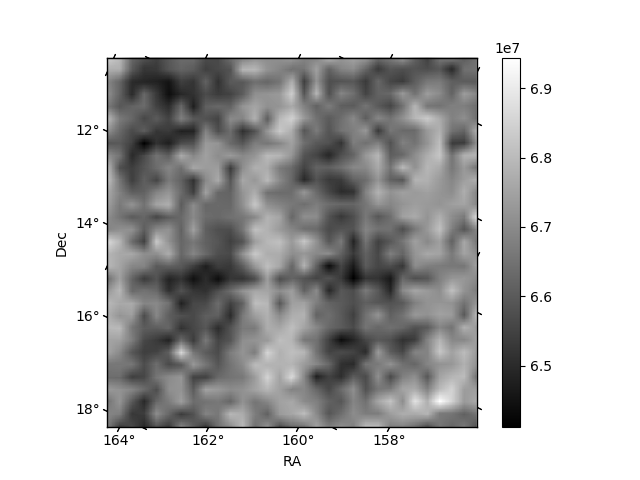
Histogram calculated using DETX and DETY for each event in the final _common_clean file
| Quadrant A | 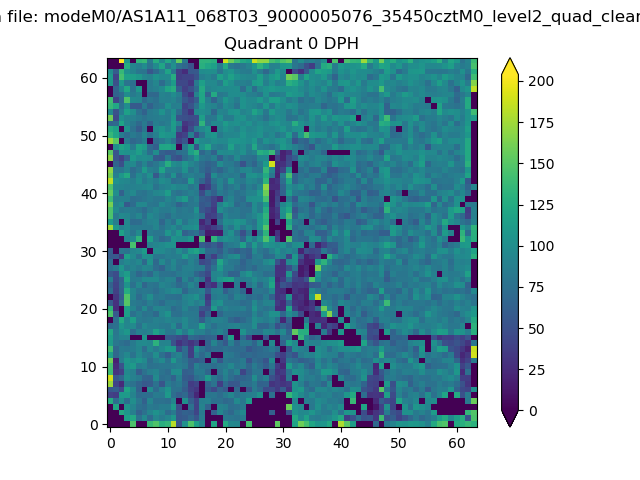 |
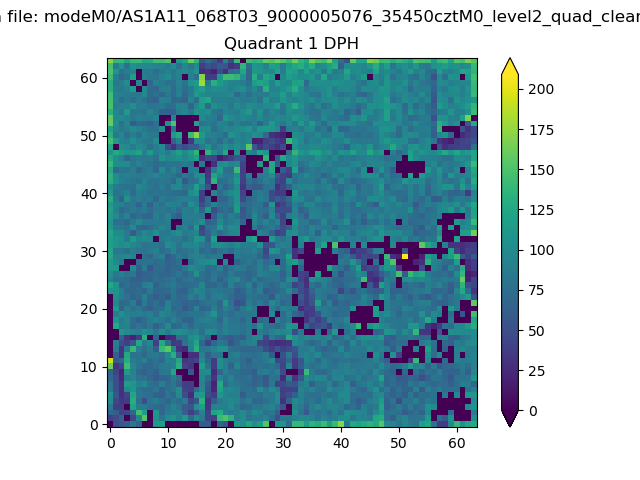 |
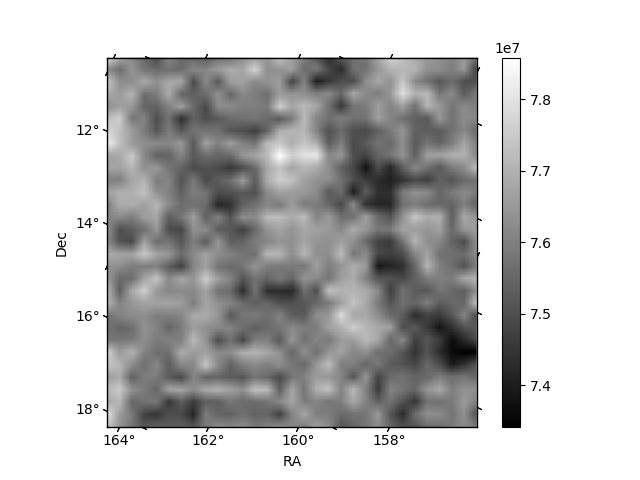
Quadrant B |
|---|---|---|---|
| Quadrant D | 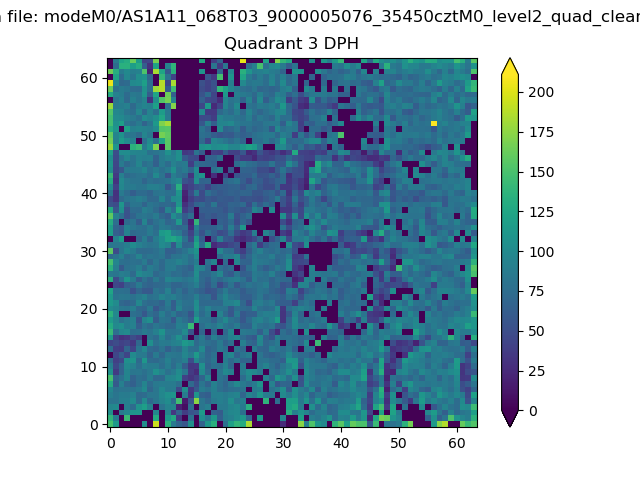 |
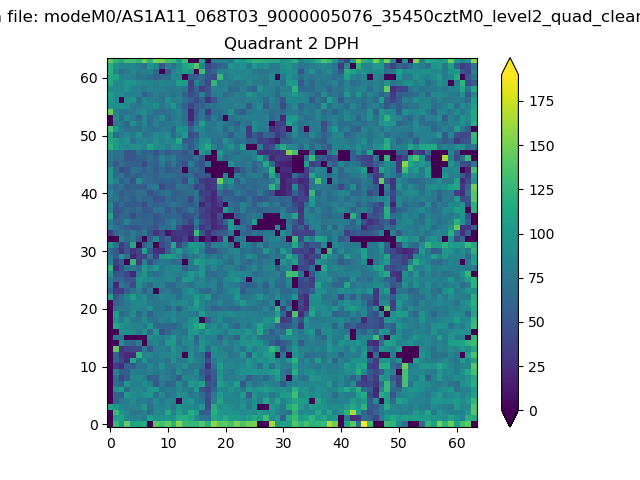 |
Quadrant C |
| Plot type | Count rate plots | Images |
|---|---|---|
| Comparison with Poisson distribution Blue bars denote a histogram of data divided into 1 sec bins. Red curve is a Poisson curve with rate = median count rate of data. |
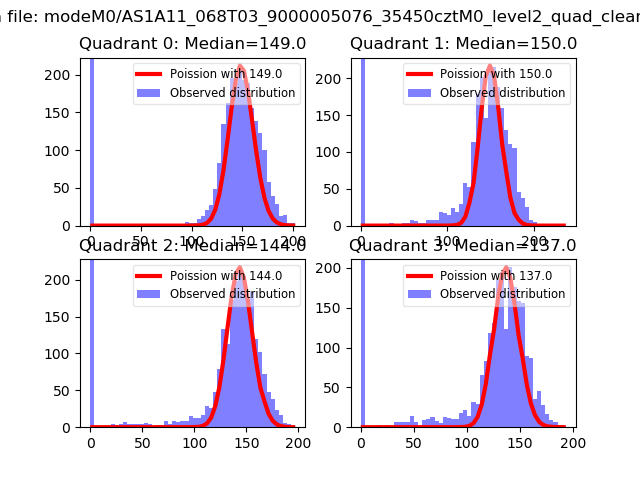 |
 |
| Quadrant-wise count rates Data is divided into 100 sec bins |
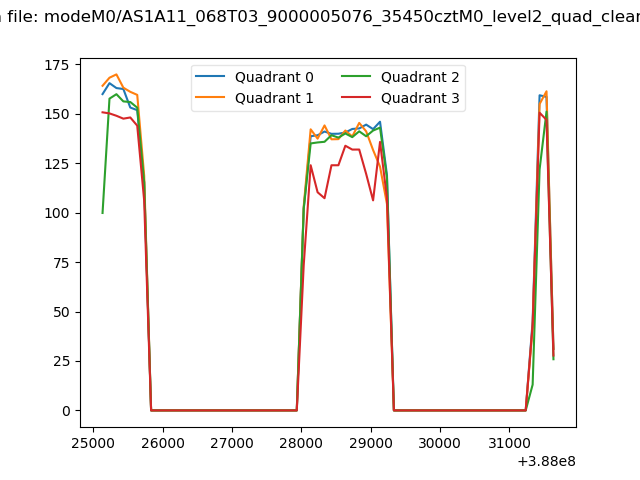 |
|
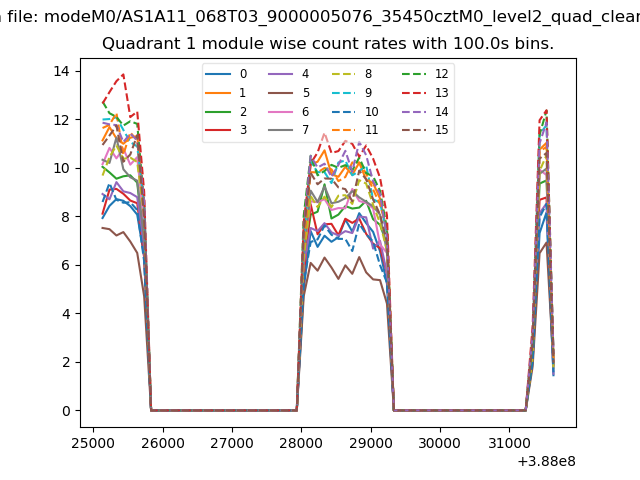
| Module-wise count rates for Quadrant A Data is divided into 100 sec bins |
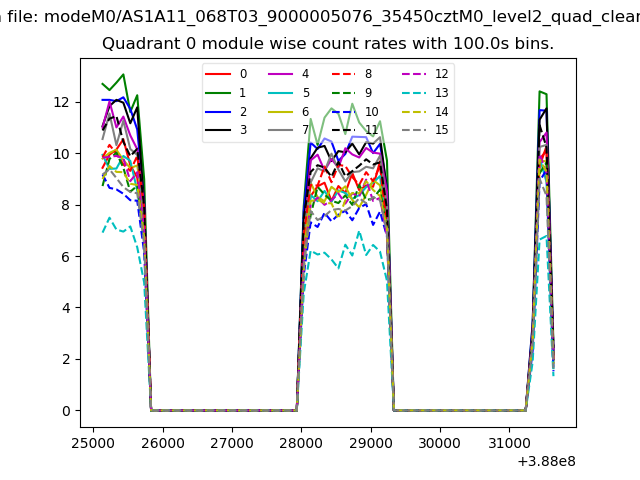 |
 |
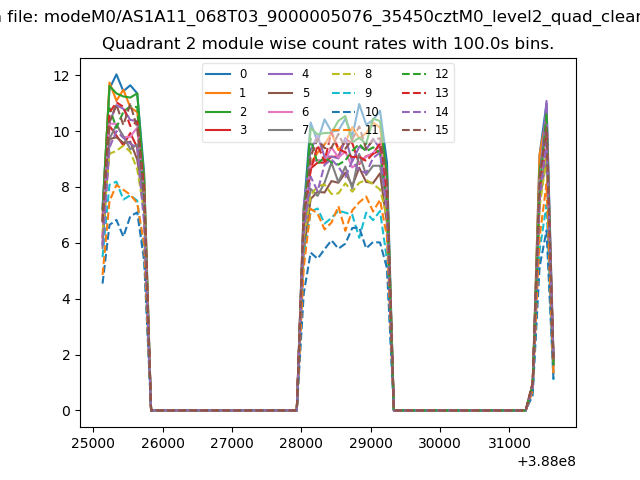
| Module-wise count rates for Quadrant B Data is divided into 100 sec bins |
 |
 |
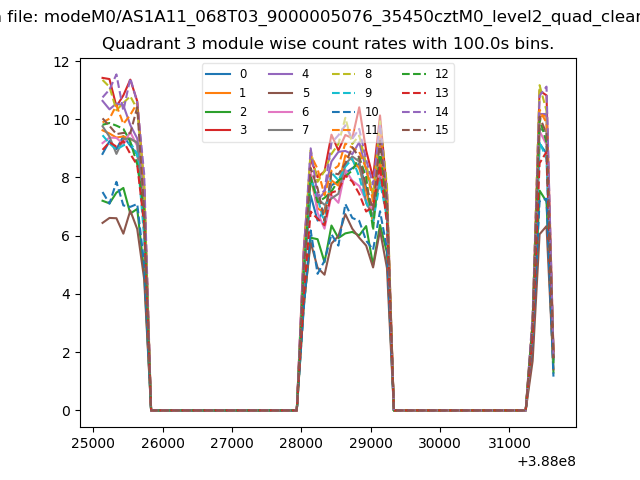
| Module-wise count rates for Quadrant C Data is divided into 100 sec bins |
 |
 |
| Module-wise count rates for Quadrant D Data is divided into 100 sec bins |
 |
 |
| Parameter | Plot |
|---|---|
| CZT HV Monitor | 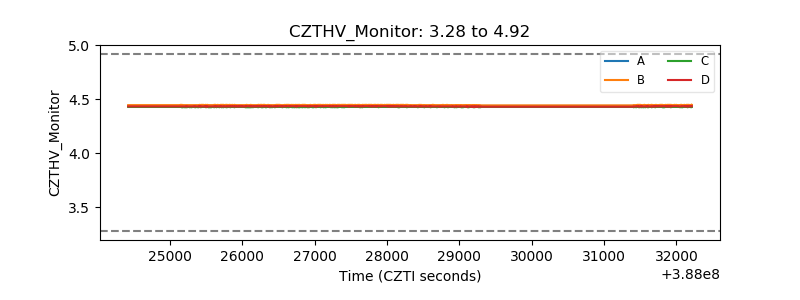 |
| D_VDD | 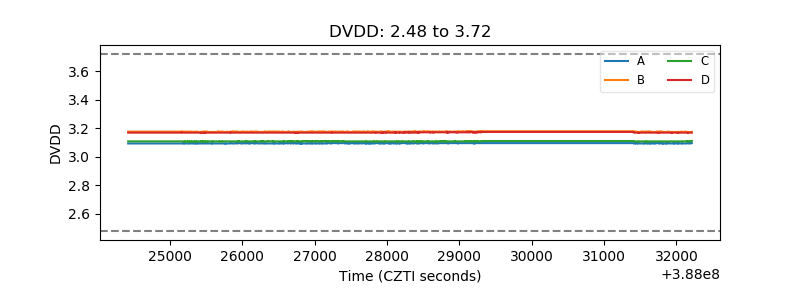 |
| Temperature 1 | 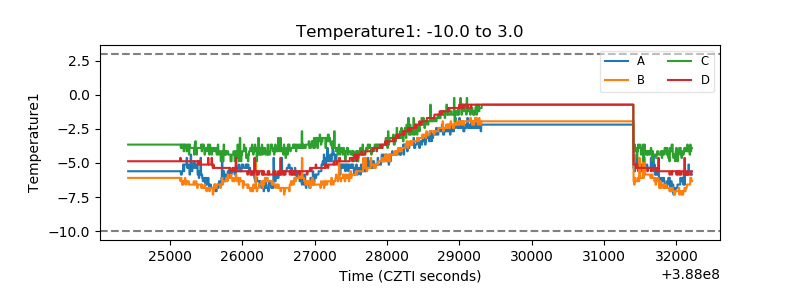 |
| Veto HV Monitor | 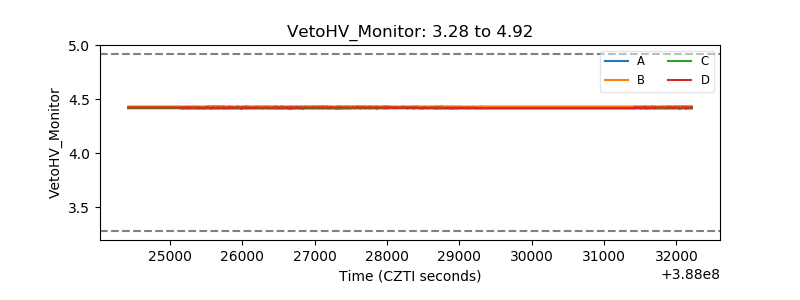 |
| Veto LLD | 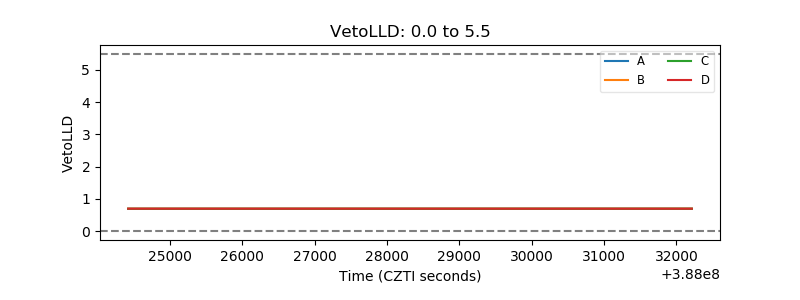 |
| Alpha Counter | 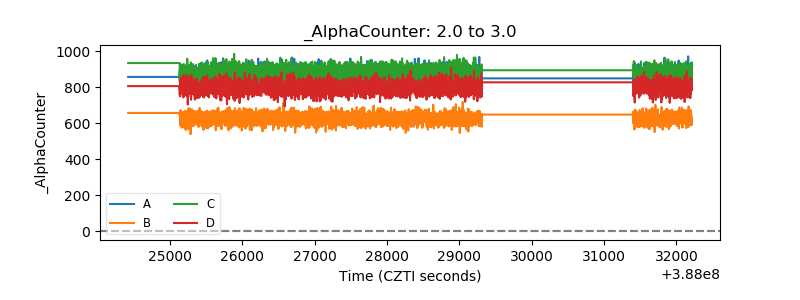 |
| _CPM_Rate | 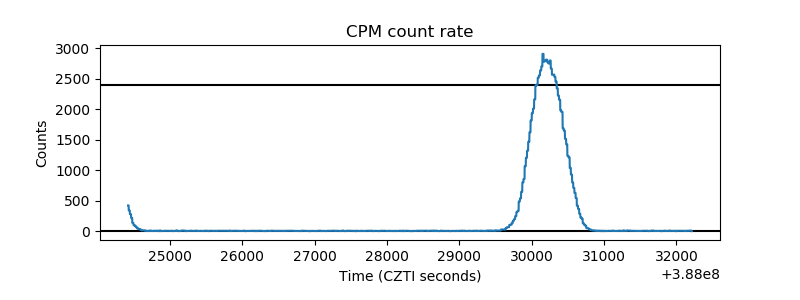 |
| CZT Counter | 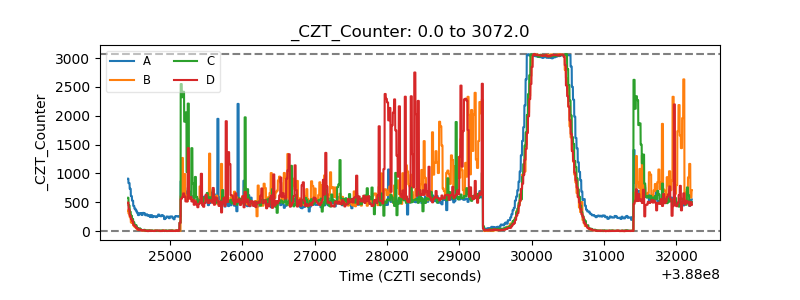 |
| +2.5 Volts monitor | 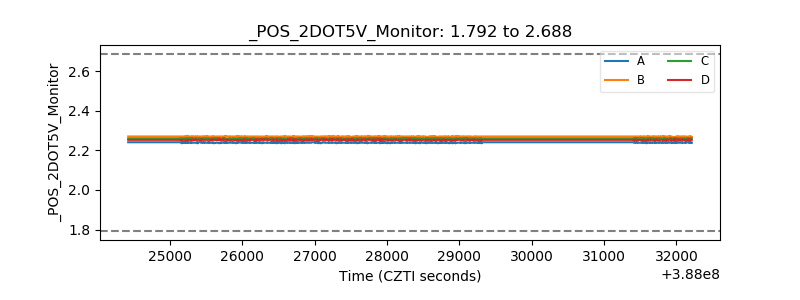 |
| +5 Volts monitor | 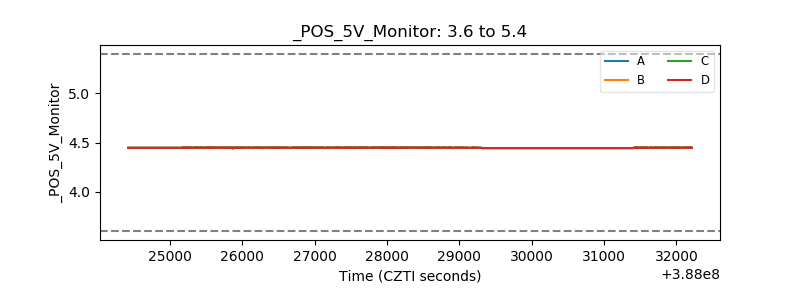 |
| _ROLL_ROT | 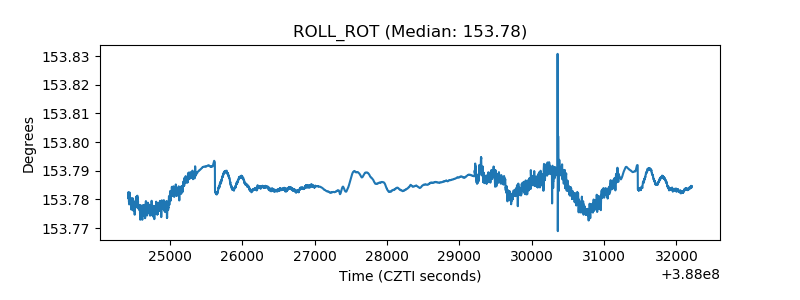 |
| _Roll_DEC |  |
| _Roll_RA | 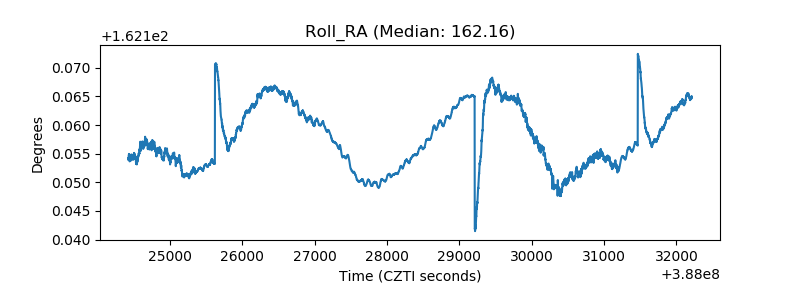 |
| Veto Counter | 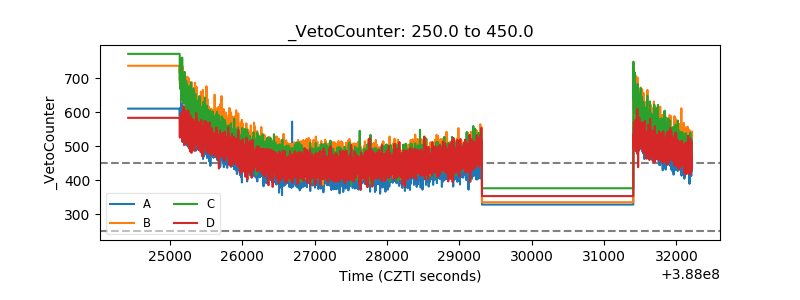 |