| Param | Original file | Final file |
|---|---|---|
| Filename | modeM0/AS1A11_097T17_9000005074_35448cztM0_level2.evt | modeM0/AS1A11_097T17_9000005074_35448cztM0_level2_quad_clean.evt |
| Size (bytes) | 113,938,560 | 30,314,880 |
| Size | 108.7 MB | 28.9 MB |
| Events in quadrant A | 704,568 | 200,316 |
| Events in quadrant B | 976,355 | 206,006 |
| Events in quadrant C | 852,434 | 207,637 |
| Events in quadrant D | 816,187 | 196,185 |
| Mode M9 | |||
|---|---|---|---|
| Quadrant | BADHDUFLAG | Total packets | Discarded packets |
| A | 0 | 7 | 0 |
| B | 0 | 7 | 0 |
| C | 0 | 7 | 0 |
| D | 0 | 8 | 0 |
| Mode M0 | |||
|---|---|---|---|
| Quadrant | BADHDUFLAG | Total packets | Discarded packets |
| A | 0 | 3051 | 1 |
| B | 0 | 3879 | 1 |
| C | 0 | 3431 | 1 |
| D | 0 | 3368 | 1 |
| Mode SS | |||
|---|---|---|---|
| Quadrant | BADHDUFLAG | Total packets | Discarded packets |
| A | 0 | 30 | 0 |
| B | 0 | 30 | 0 |
| C | 0 | 30 | 0 |
| D | 0 | 30 | 0 |
| Quadrant | Total seconds | Saturated seconds | Saturation percentage |
|---|---|---|---|
| A | 1442 | 1 | 0.069348% |
| B | 1442 | 11 | 0.762829% |
| C | 1442 | 21 | 1.456311% |
| D | 1442 | 12 | 0.832178% |
Noise dominated data is calculated using 1-second bins in cleaned event files. If a bin has >2000 counts, and if more than 50% of those come from <1% of pixels, then it is considered to be noise-dominated and hence unusable.
| Quadrant | # 1 sec bins | Bins with >0 counts | Bins with >2000 counts | High rate bins dominated by noise | Noise dominated (total time) | Noise dominated (detector-on time) | Marked lightcurve |
|---|---|---|---|---|---|---|---|
| A | 1442 | 1442 | 0 | 0 | 0.00% | 0.00% | 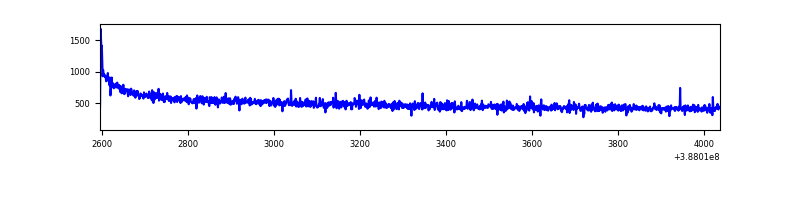 |
| B | 1442 | 1442 | 5 | 5 | 0.35% | 0.35% | 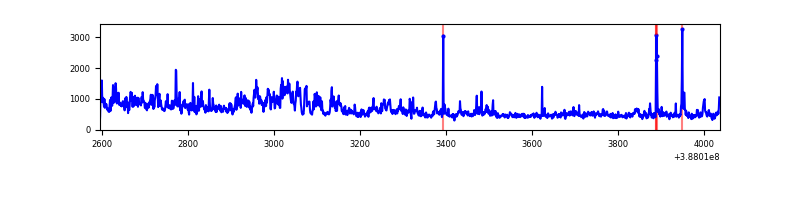 |
| C | 1442 | 1442 | 13 | 13 | 0.90% | 0.90% | 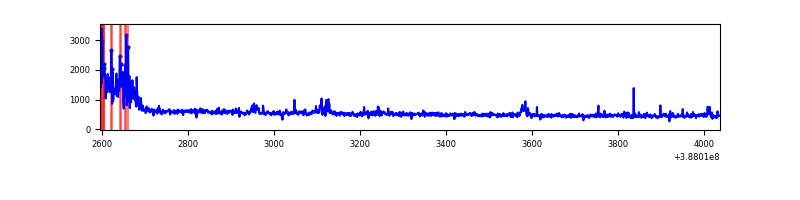 |
| D | 1442 | 1442 | 10 | 10 | 0.69% | 0.69% | 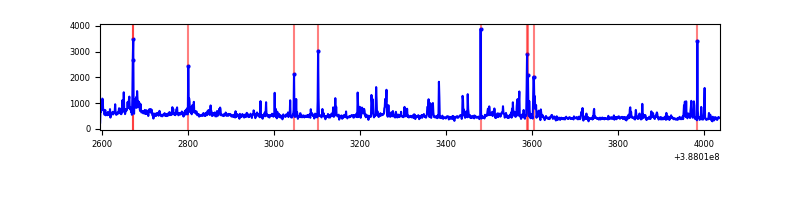 |
Top three noisy pixels from each quadrant. If the there are fewer than three noisy pixels in the level2.evt file, extra rows are filled as -1
| Pixel properties | Quadrant properties | ||||||
|---|---|---|---|---|---|---|---|
| Quadrant | DetID | PixID | Counts | Sigma | Mean | Median | Sigma |
| A | 10 | 83 | 50250 | 1422.31 | 167 | 164 | 35.2 |
| A | 13 | 6 | 3773 | 102.49 | 167 | 164 | 35.2 |
| A | 8 | 6 | 2669 | 71.14 | 167 | 164 | 35.2 |
| B | 4 | 251 | 259978 | 7585.62 | 170 | 165 | 34.3 |
| B | 5 | 172 | 25701 | 745.56 | 170 | 165 | 34.3 |
| B | 0 | 155 | 11316 | 325.57 | 170 | 165 | 34.3 |
| C | 0 | 10 | 89826 | 2203.48 | 171 | 173 | 40.7 |
| C | 15 | 214 | 62815 | 1539.61 | 171 | 173 | 40.7 |
| C | 1 | 23 | 16093 | 391.28 | 171 | 173 | 40.7 |
| D | 13 | 249 | 65201 | 1553.59 | 167 | 163 | 41.9 |
| D | 7 | 80 | 58410 | 1391.37 | 167 | 163 | 41.9 |
| D | 2 | 249 | 10613 | 249.62 | 167 | 163 | 41.9 |
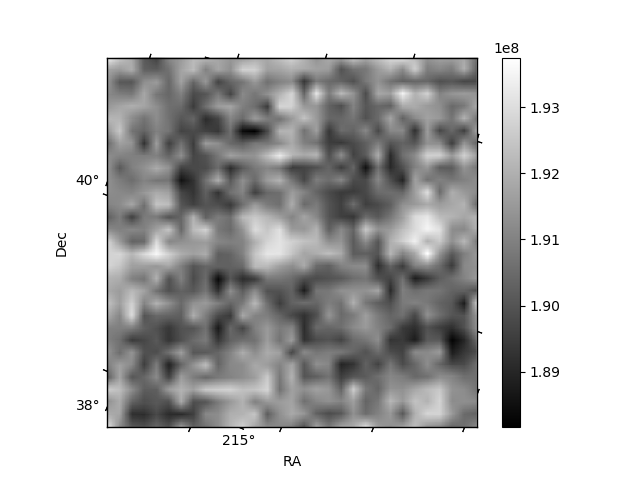
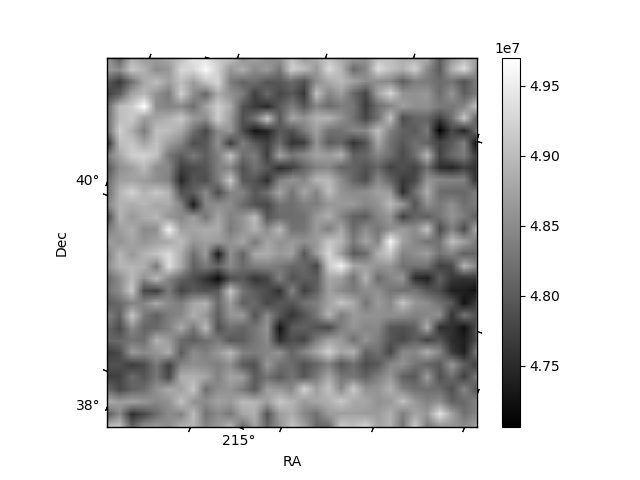
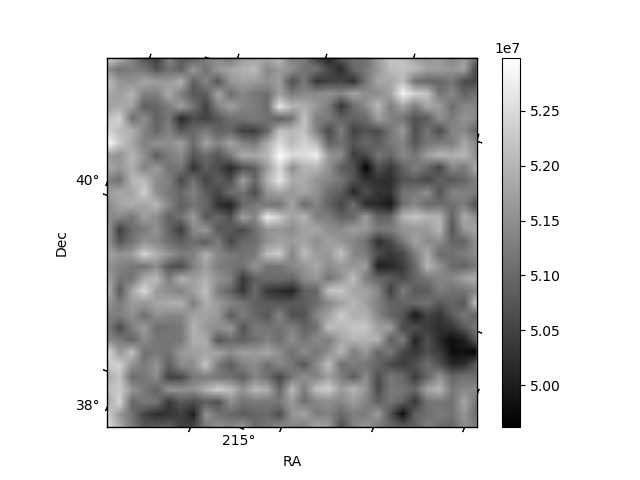
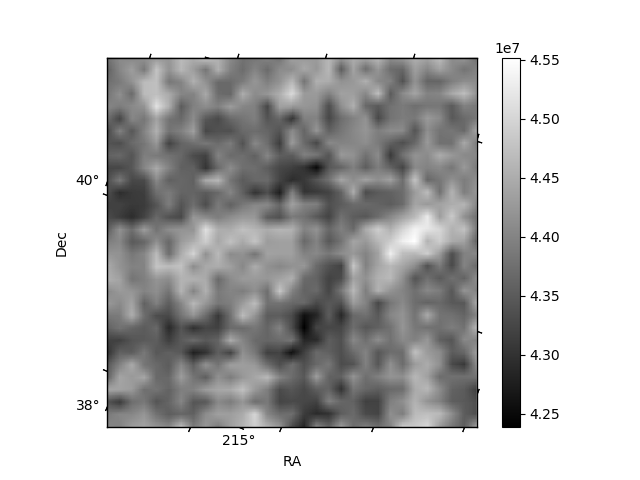
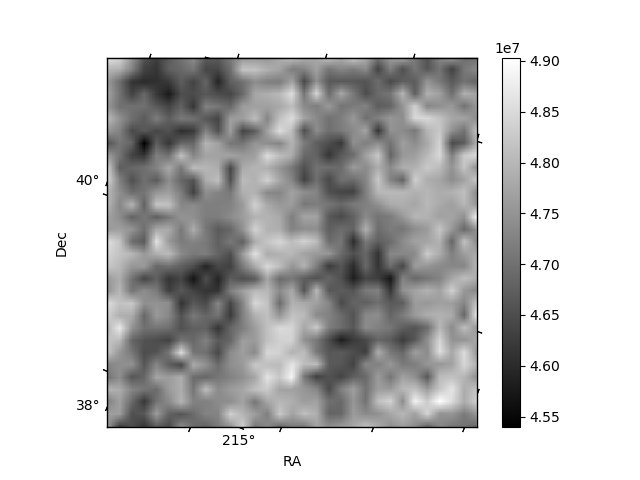
Histogram calculated using DETX and DETY for each event in the final _common_clean file
| Quadrant A | 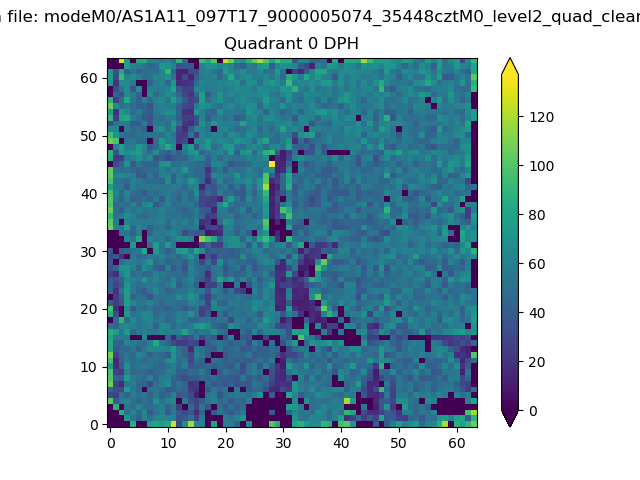 |
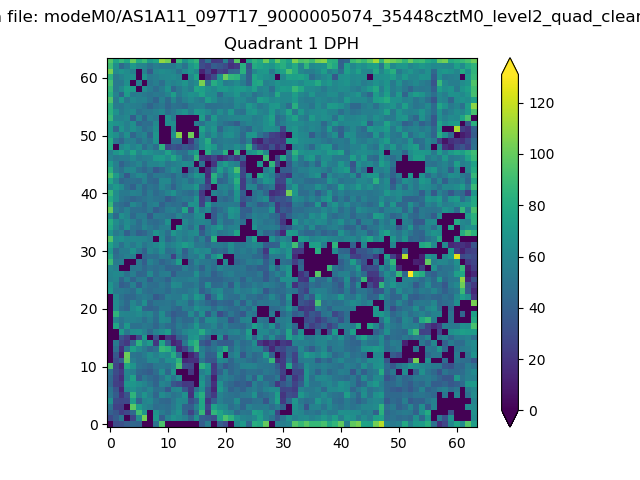 |
Quadrant B |
|---|---|---|---|
| Quadrant D | 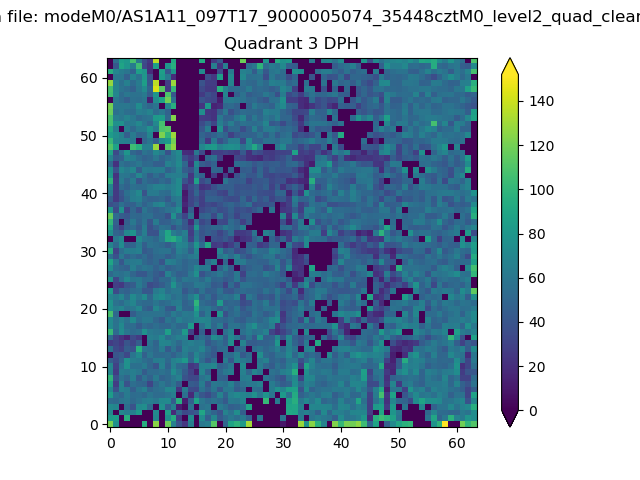 |
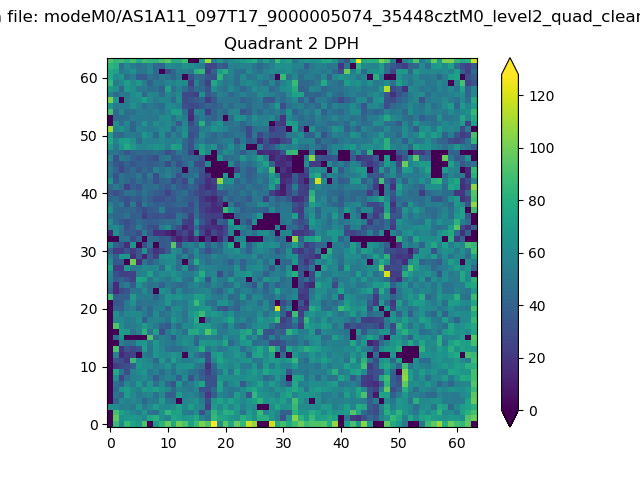 |
Quadrant C |
| Plot type | Count rate plots | Images |
|---|---|---|
| Comparison with Poisson distribution Blue bars denote a histogram of data divided into 1 sec bins. Red curve is a Poisson curve with rate = median count rate of data. |
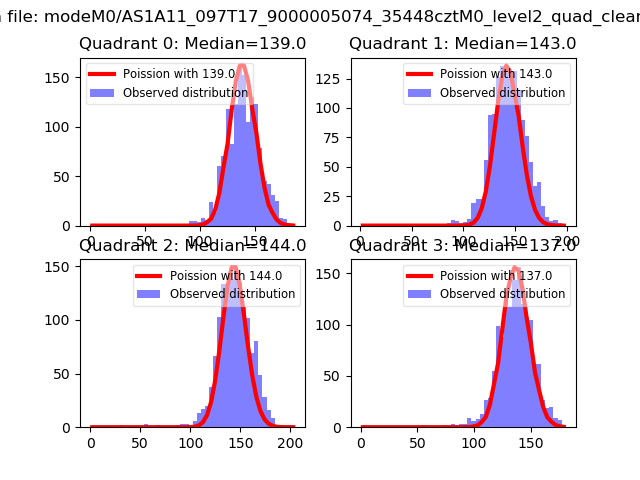 |
 |
| Quadrant-wise count rates Data is divided into 100 sec bins |
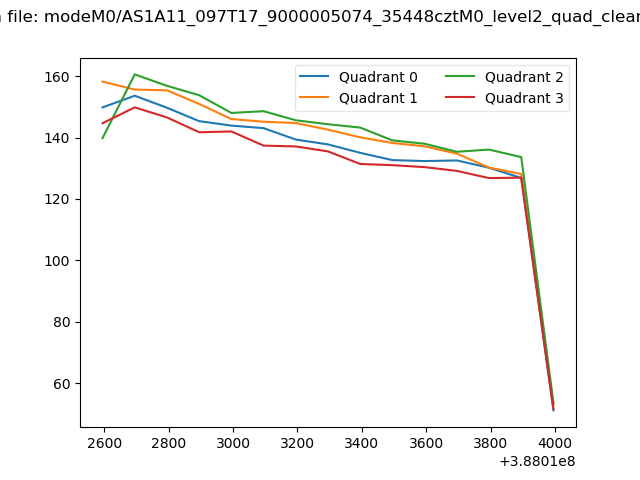 |
|
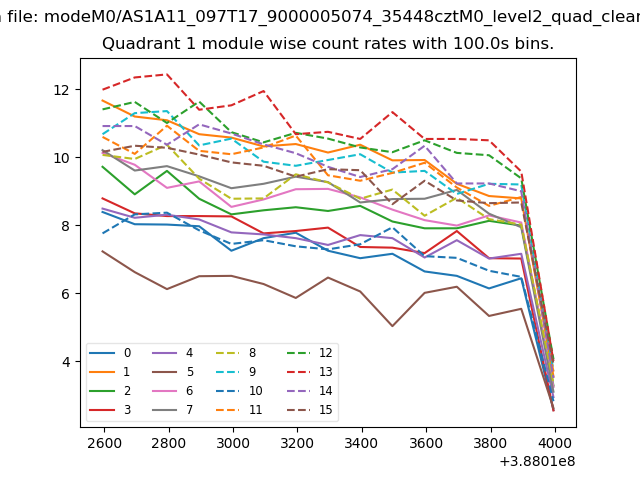
| Module-wise count rates for Quadrant A Data is divided into 100 sec bins |
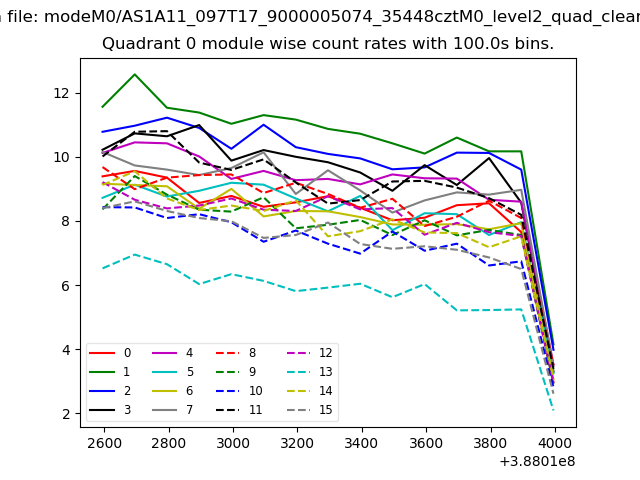 |
 |
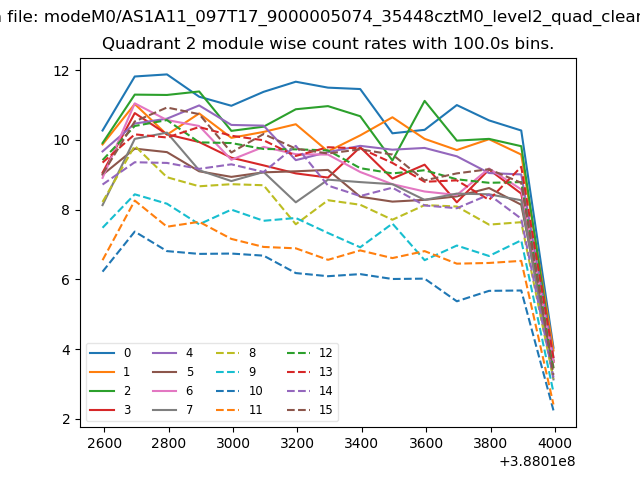
| Module-wise count rates for Quadrant B Data is divided into 100 sec bins |
 |
 |
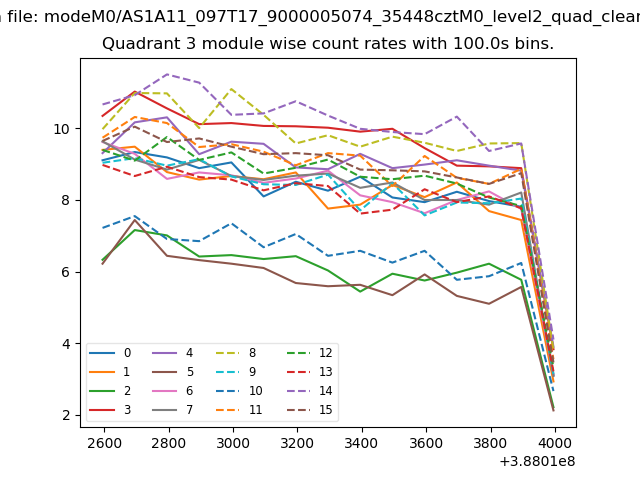
| Module-wise count rates for Quadrant C Data is divided into 100 sec bins |
 |
 |
| Module-wise count rates for Quadrant D Data is divided into 100 sec bins |
 |
 |
| Parameter | Plot |
|---|---|
| CZT HV Monitor | 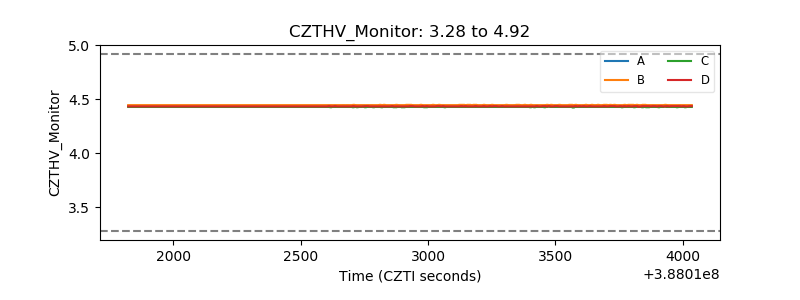 |
| D_VDD | 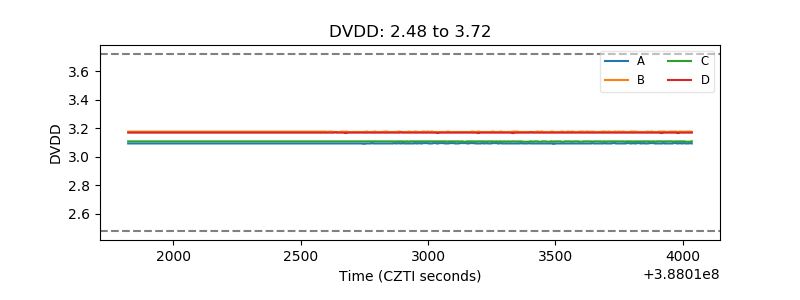 |
| Temperature 1 | 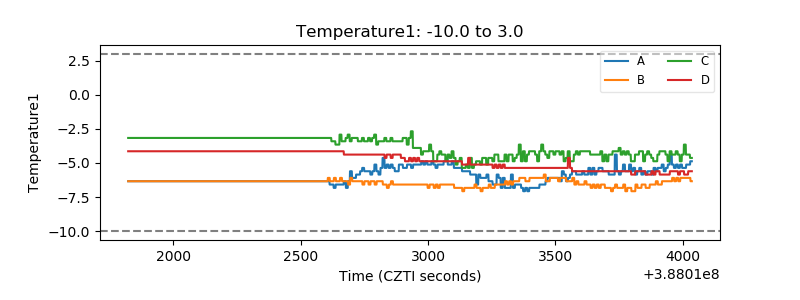 |
| Veto HV Monitor | 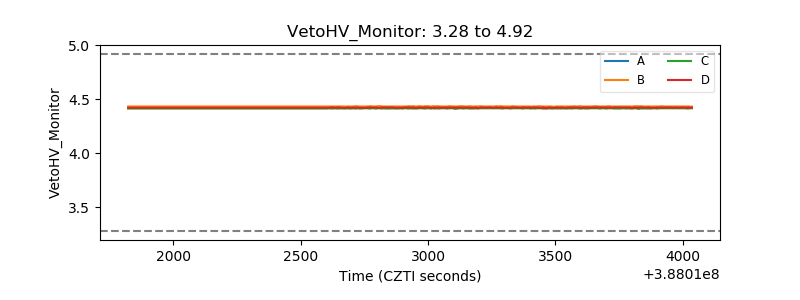 |
| Veto LLD | 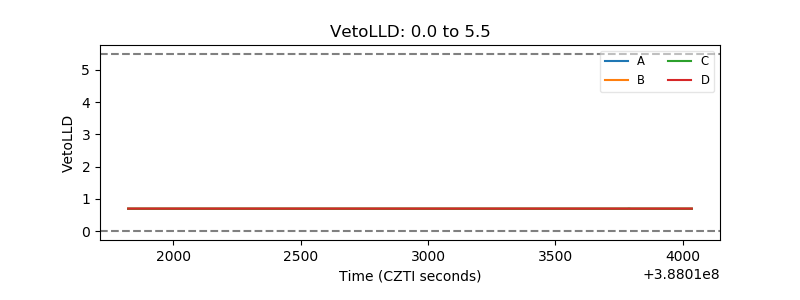 |
| Alpha Counter | 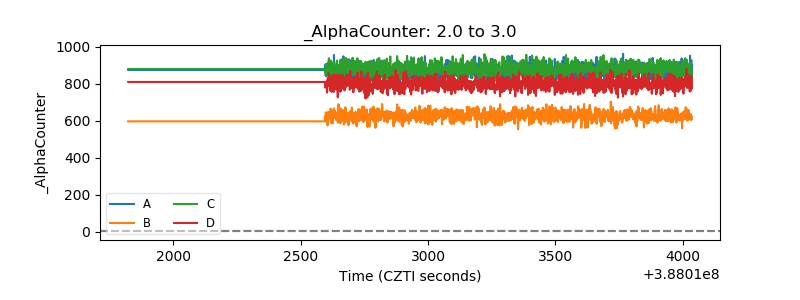 |
| _CPM_Rate | 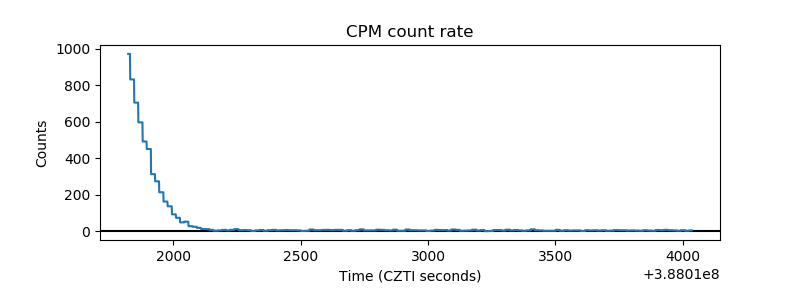 |
| CZT Counter | 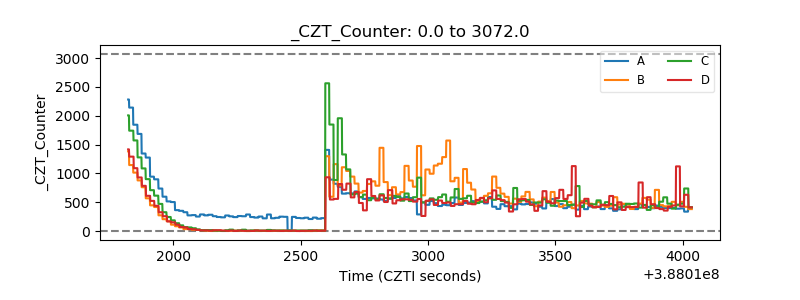 |
| +2.5 Volts monitor | 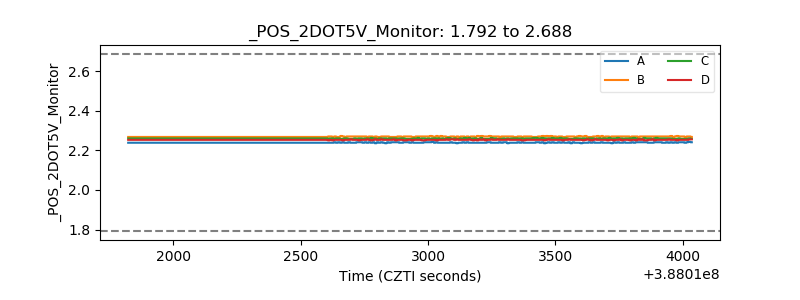 |
| +5 Volts monitor | 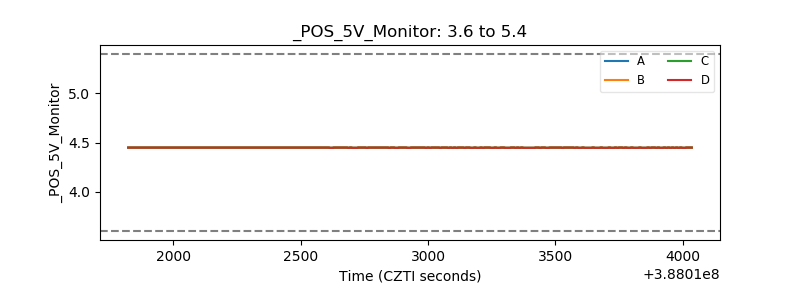 |
| _ROLL_ROT | 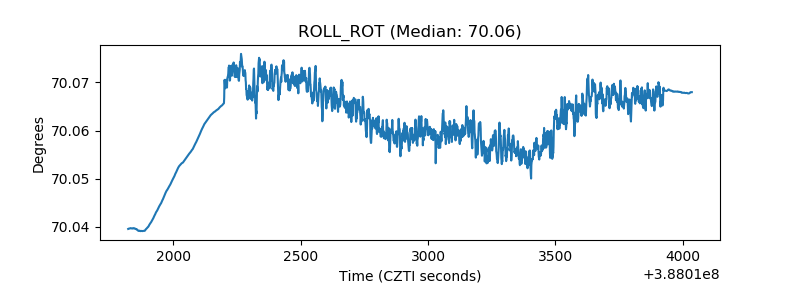 |
| _Roll_DEC | 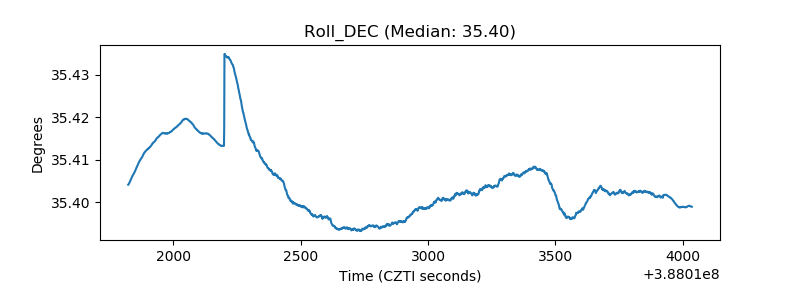 |
| _Roll_RA | 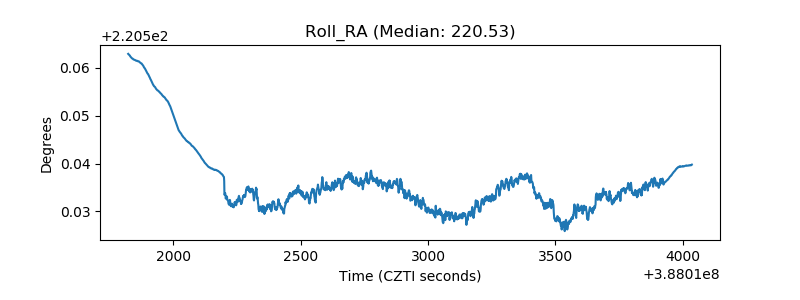 |
| Veto Counter | 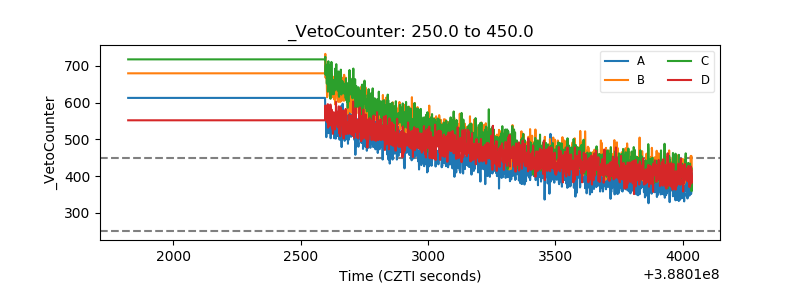 |