| Param | Original file | Final file |
|---|---|---|
| Filename | modeM0/AS1A11_097T17_9000005074_35444cztM0_level2.evt | modeM0/AS1A11_097T17_9000005074_35444cztM0_level2_quad_clean.evt |
| Size (bytes) | 1,608,943,680 | 236,226,240 |
| Size | 1.5 GB | 225.3 MB |
| Events in quadrant A | 7,508,766 | 1,558,387 |
| Events in quadrant B | 18,853,191 | 1,483,195 |
| Events in quadrant C | 11,348,235 | 1,514,035 |
| Events in quadrant D | 9,934,515 | 1,488,939 |
| Mode M9 | |||
|---|---|---|---|
| Quadrant | BADHDUFLAG | Total packets | Discarded packets |
| A | 0 | 55 | 0 |
| B | 0 | 55 | 0 |
| C | 0 | 55 | 0 |
| D | 0 | 55 | 0 |
| Mode M0 | |||
|---|---|---|---|
| Quadrant | BADHDUFLAG | Total packets | Discarded packets |
| A | 0 | 32959 | 5 |
| B | 0 | 67441 | 17 |
| C | 0 | 43838 | 17 |
| D | 0 | 40053 | 7 |
| Mode SS | |||
|---|---|---|---|
| Quadrant | BADHDUFLAG | Total packets | Discarded packets |
| A | 0 | 330 | 0 |
| B | 0 | 330 | 0 |
| C | 0 | 330 | 0 |
| D | 0 | 330 | 0 |
| Quadrant | Total seconds | Saturated seconds | Saturation percentage |
|---|---|---|---|
| A | 16085 | 24 | 0.149207% |
| B | 16083 | 2779 | 17.279115% |
| C | 16079 | 1004 | 6.244169% |
| D | 16083 | 488 | 3.034260% |
Noise dominated data is calculated using 1-second bins in cleaned event files. If a bin has >2000 counts, and if more than 50% of those come from <1% of pixels, then it is considered to be noise-dominated and hence unusable.
| Quadrant | # 1 sec bins | Bins with >0 counts | Bins with >2000 counts | High rate bins dominated by noise | Noise dominated (total time) | Noise dominated (detector-on time) | Marked lightcurve |
|---|---|---|---|---|---|---|---|
| A | 21577 | 16089 | 0 | 0 | 0.00% | 0.00% | 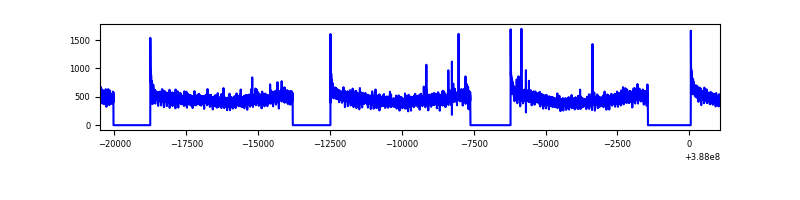 |
| B | 21577 | 16089 | 1740 | 1740 | 8.06% | 10.81% | 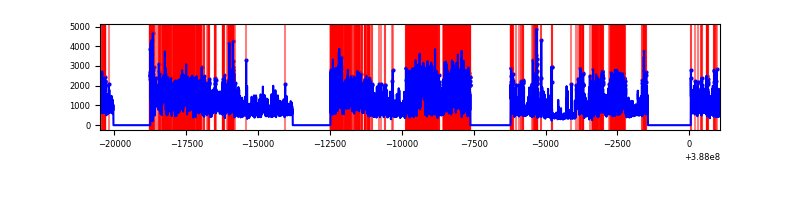 |
| C | 21577 | 16088 | 721 | 721 | 3.34% | 4.48% | 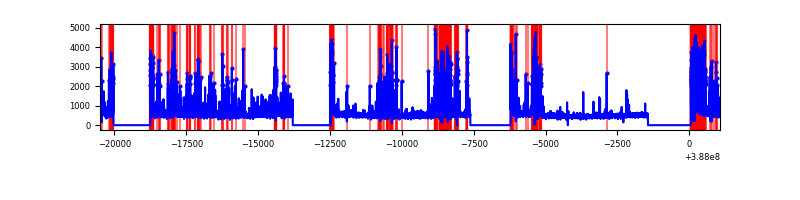 |
| D | 21577 | 16088 | 374 | 374 | 1.73% | 2.32% | 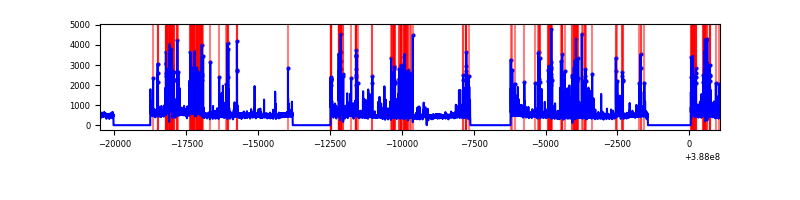 |
Top three noisy pixels from each quadrant. If the there are fewer than three noisy pixels in the level2.evt file, extra rows are filled as -1
| Pixel properties | Quadrant properties | ||||||
|---|---|---|---|---|---|---|---|
| Quadrant | DetID | PixID | Counts | Sigma | Mean | Median | Sigma |
| A | 10 | 83 | 301618 | 811.36 | 1846 | 1805 | 369.5 |
| A | 13 | 6 | 29987 | 76.27 | 1846 | 1805 | 369.5 |
| A | 8 | 6 | 29743 | 75.61 | 1846 | 1805 | 369.5 |
| B | 4 | 251 | 10445045 | 31049.35 | 1751 | 1699 | 336.3 |
| B | 5 | 236 | 852114 | 2528.39 | 1751 | 1699 | 336.3 |
| B | 5 | 172 | 326561 | 965.85 | 1751 | 1699 | 336.3 |
| C | 4 | 254 | 2463044 | 6049.36 | 1755 | 1768 | 406.9 |
| C | 0 | 10 | 862445 | 2115.38 | 1755 | 1768 | 406.9 |
| C | 15 | 214 | 637772 | 1563.18 | 1755 | 1768 | 406.9 |
| D | 13 | 249 | 802968 | 1841.73 | 1788 | 1739 | 435.0 |
| D | 12 | 6 | 641523 | 1470.63 | 1788 | 1739 | 435.0 |
| D | 8 | 195 | 486279 | 1113.78 | 1788 | 1739 | 435.0 |
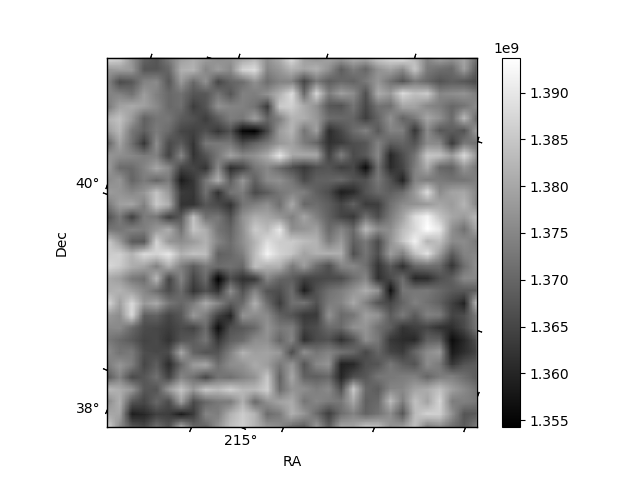
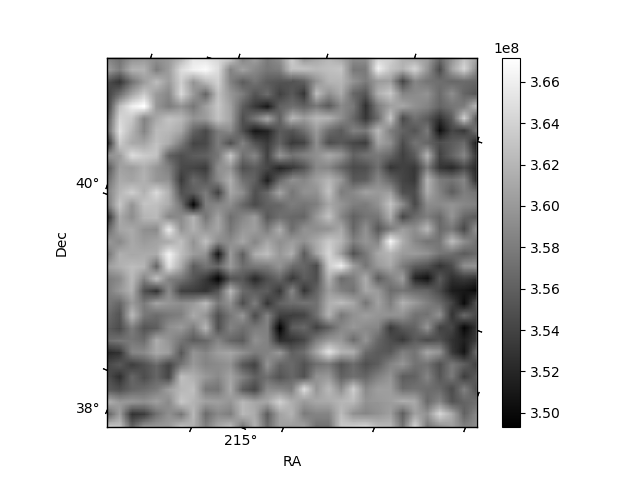
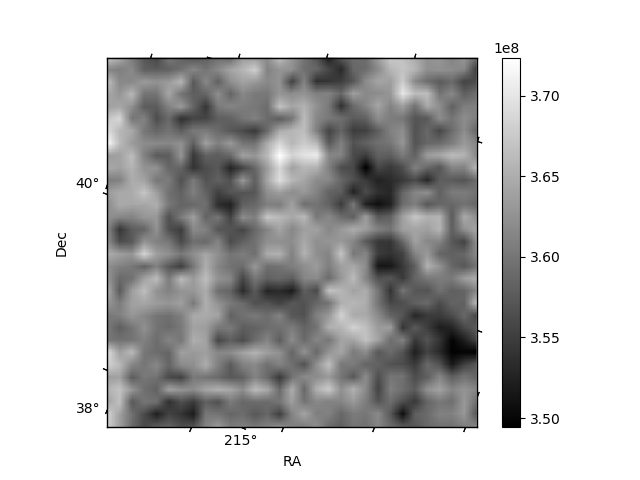
Histogram calculated using DETX and DETY for each event in the final _common_clean file
| Quadrant A | 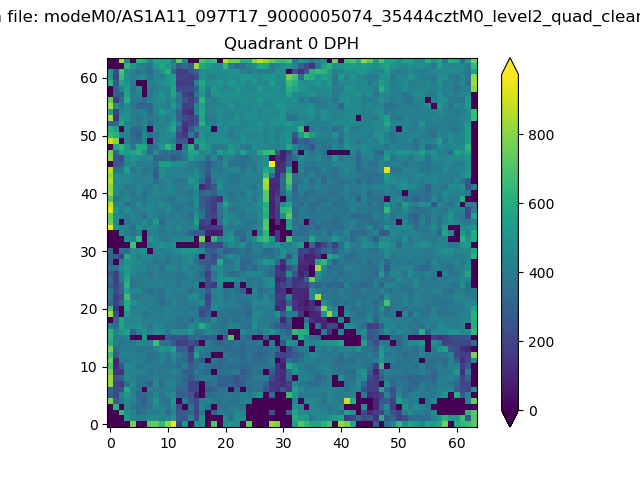 |
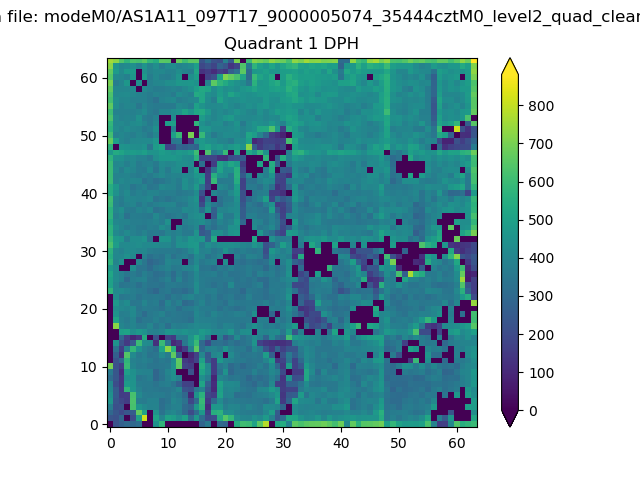 |
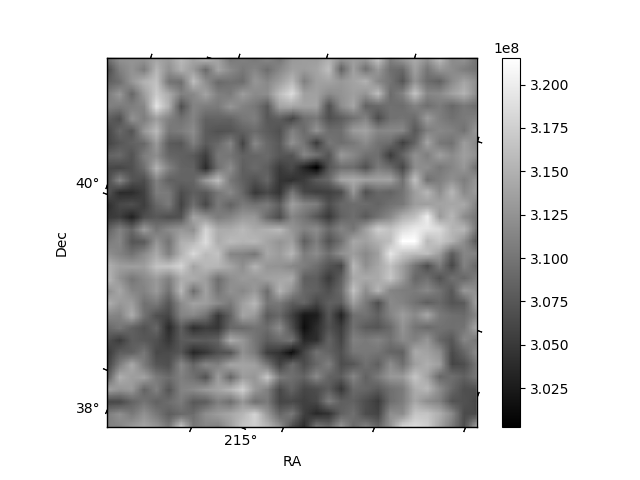
Quadrant B |
|---|---|---|---|
| Quadrant D | 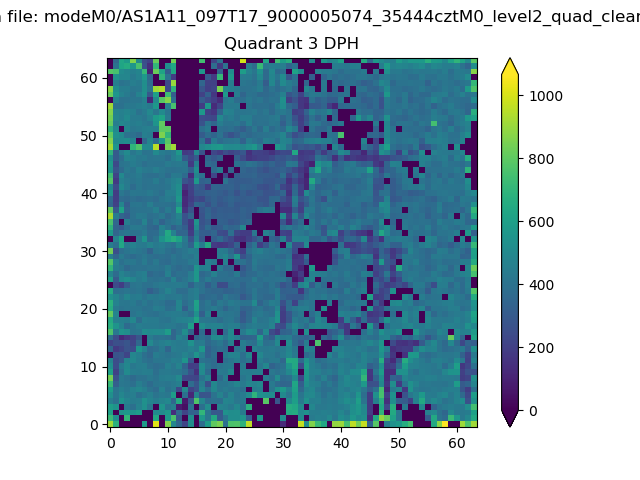 |
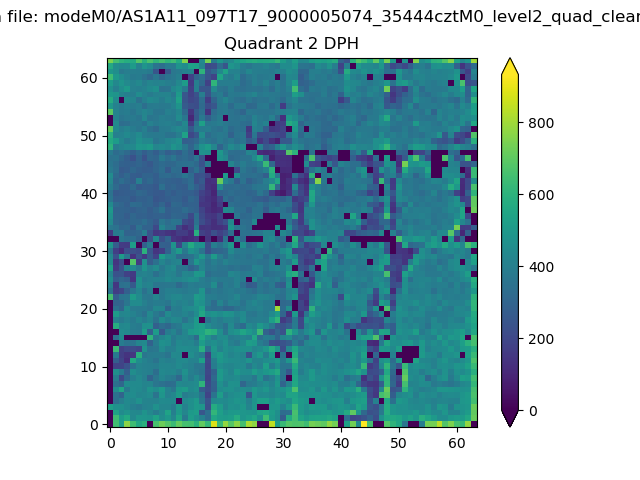 |
Quadrant C |
| Plot type | Count rate plots | Images |
|---|---|---|
| Comparison with Poisson distribution Blue bars denote a histogram of data divided into 1 sec bins. Red curve is a Poisson curve with rate = median count rate of data. |
 |
 |
| Quadrant-wise count rates Data is divided into 100 sec bins |
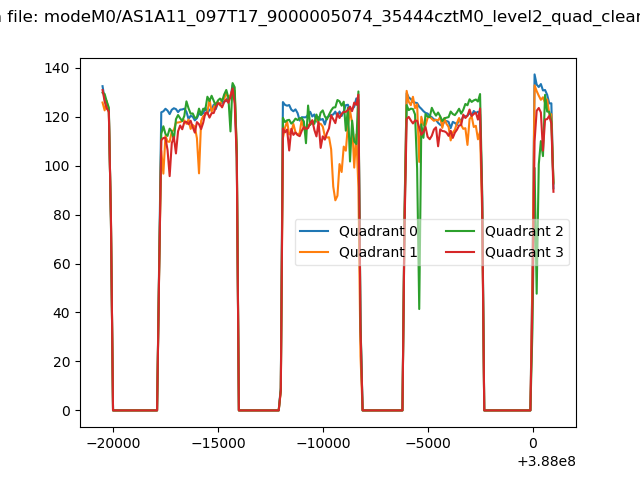 |
|
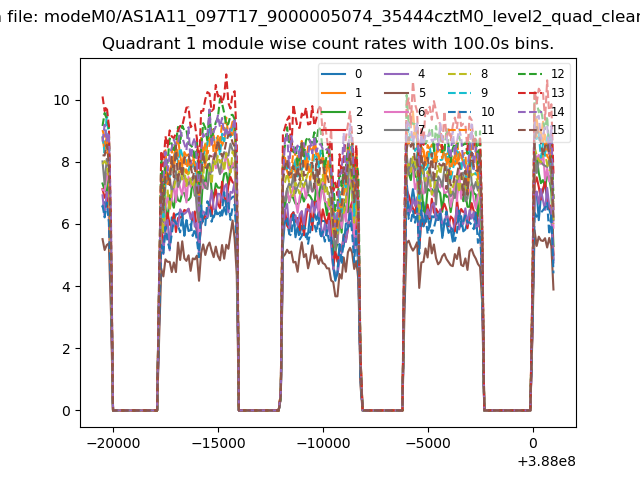
| Module-wise count rates for Quadrant A Data is divided into 100 sec bins |
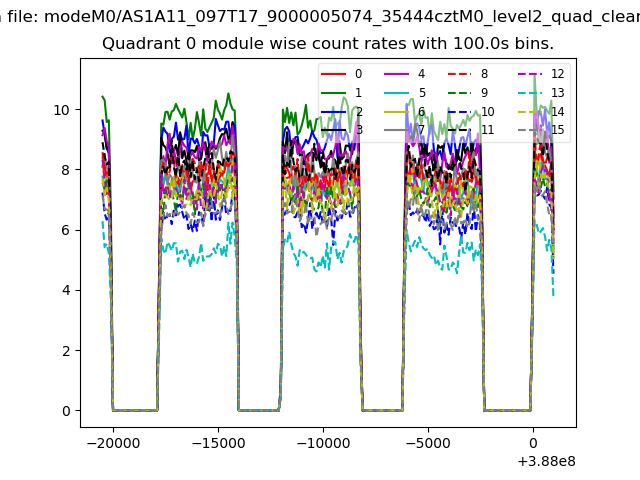 |
 |
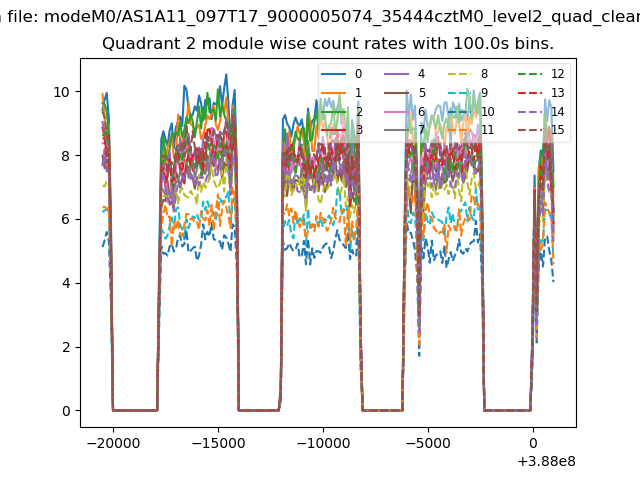
| Module-wise count rates for Quadrant B Data is divided into 100 sec bins |
 |
 |
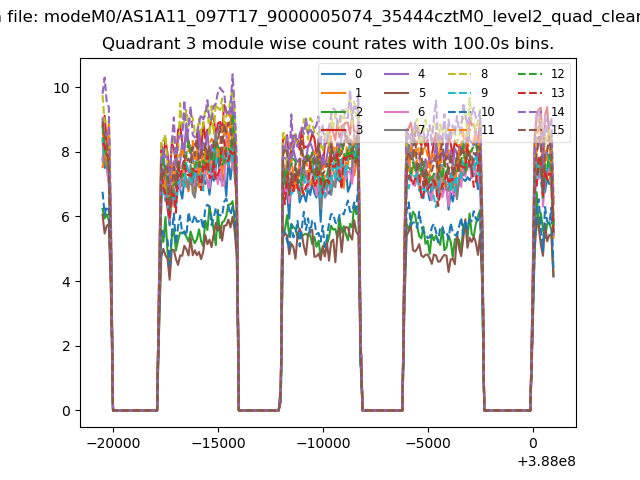
| Module-wise count rates for Quadrant C Data is divided into 100 sec bins |
 |
 |
| Module-wise count rates for Quadrant D Data is divided into 100 sec bins |
 |
 |
| Parameter | Plot |
|---|---|
| CZT HV Monitor | 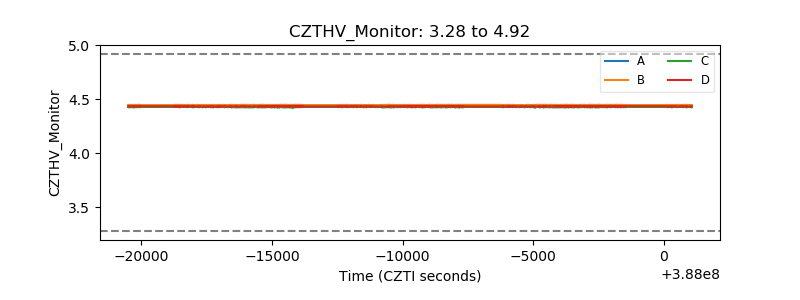 |
| D_VDD | 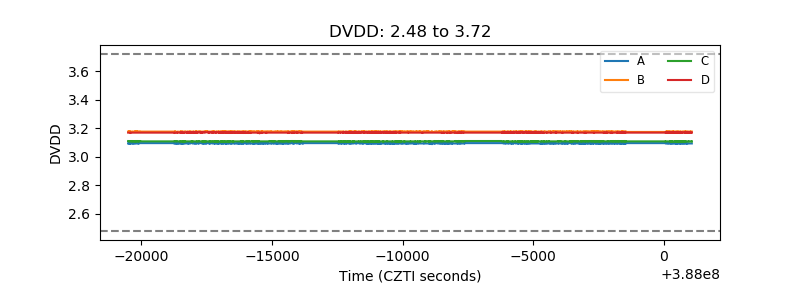 |
| Temperature 1 | 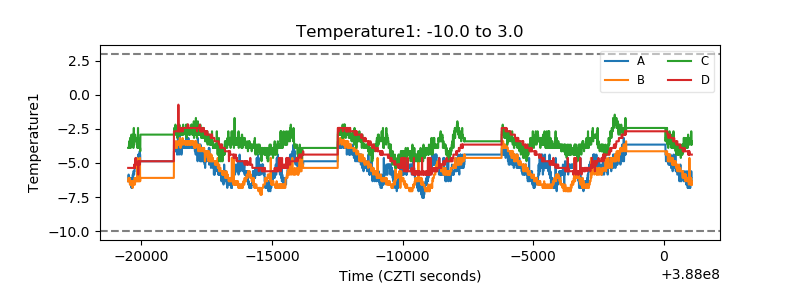 |
| Veto HV Monitor | 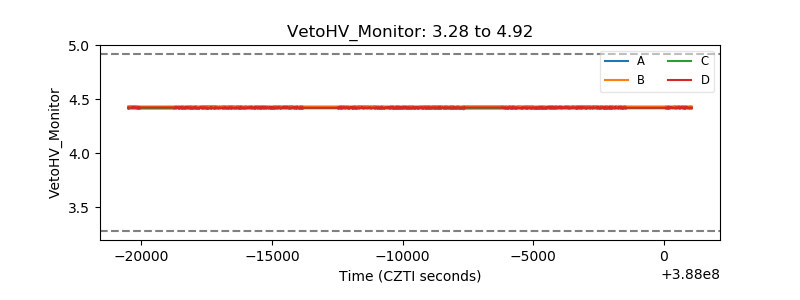 |
| Veto LLD | 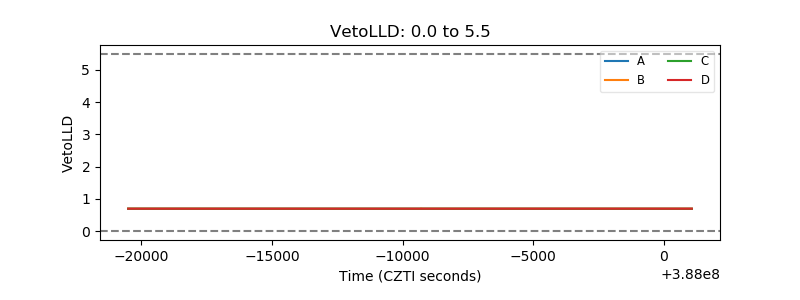 |
| Alpha Counter | 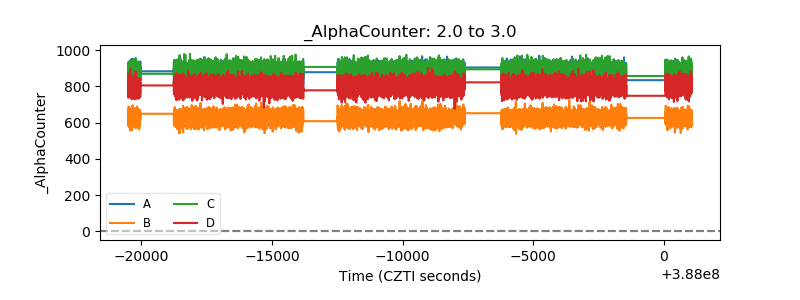 |
| _CPM_Rate | 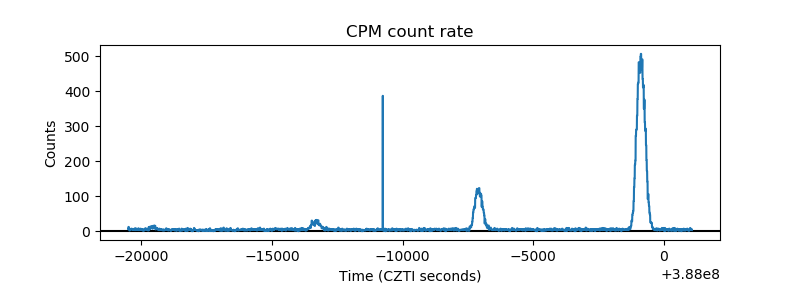 |
| CZT Counter | 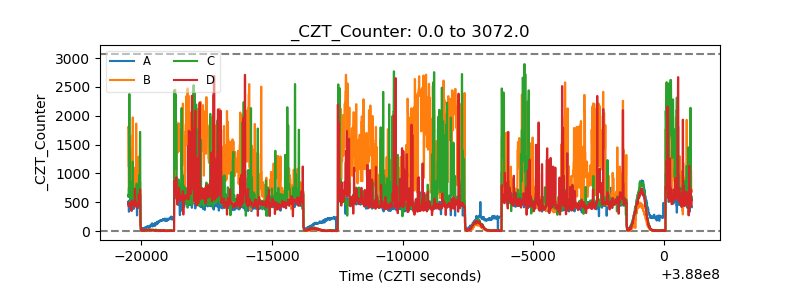 |
| +2.5 Volts monitor | 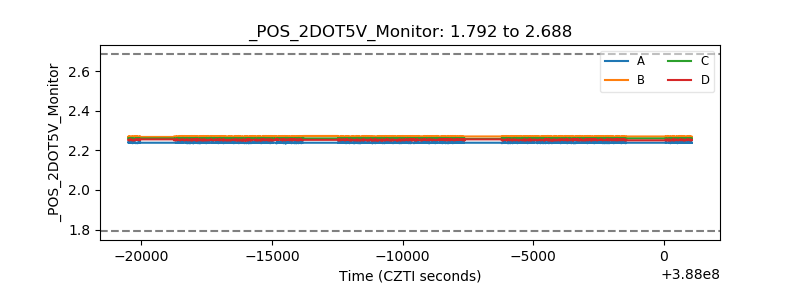 |
| +5 Volts monitor | 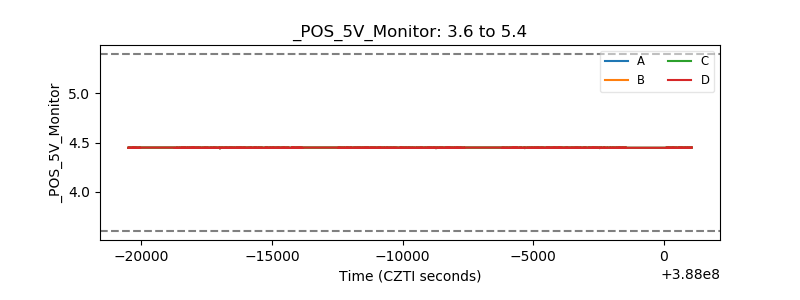 |
| _ROLL_ROT | 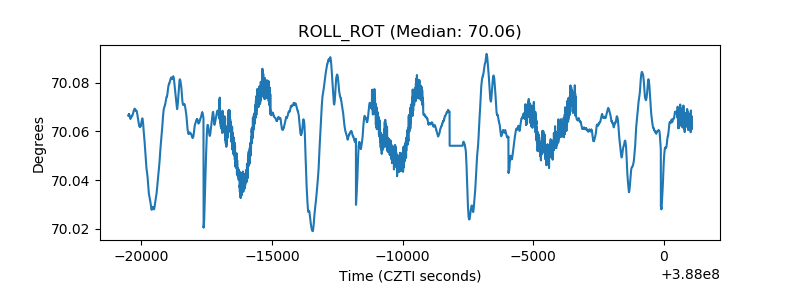 |
| _Roll_DEC | 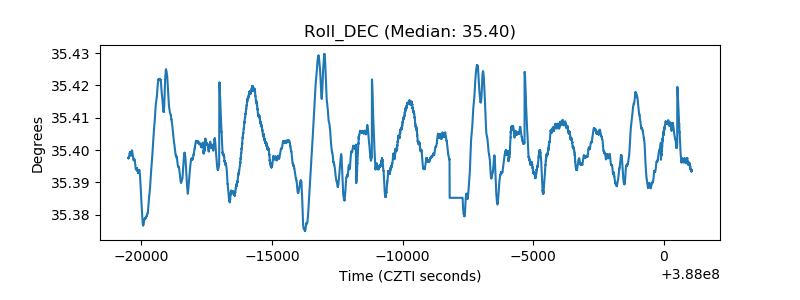 |
| _Roll_RA | 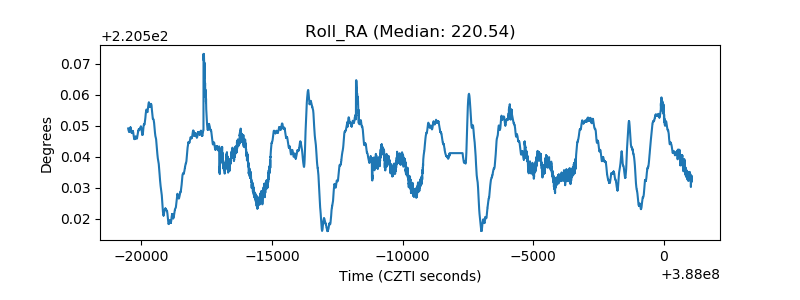 |
| Veto Counter | 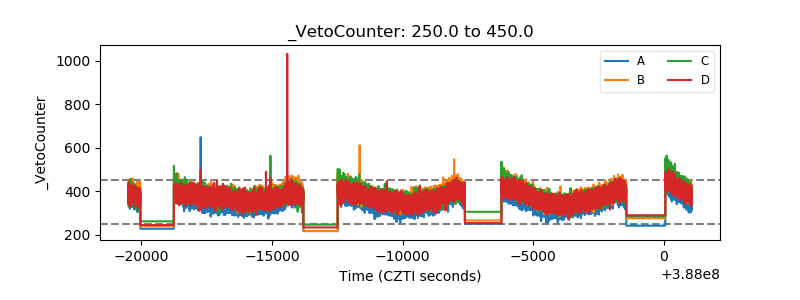 |