| Param | Original file | Final file |
|---|---|---|
| Filename | modeM0/AS1A11_097T17_9000005074_35440cztM0_level2.evt | modeM0/AS1A11_097T17_9000005074_35440cztM0_level2_quad_clean.evt |
| Size (bytes) | 598,017,600 | 62,501,760 |
| Size | 570.3 MB | 59.6 MB |
| Events in quadrant A | 2,686,890 | 382,995 |
| Events in quadrant B | 7,055,213 | 370,813 |
| Events in quadrant C | 3,923,028 | 378,982 |
| Events in quadrant D | 4,062,575 | 362,808 |
| Mode M9 | |||
|---|---|---|---|
| Quadrant | BADHDUFLAG | Total packets | Discarded packets |
| A | 0 | 20 | 0 |
| B | 0 | 20 | 0 |
| C | 0 | 20 | 0 |
| D | 0 | 21 | 0 |
| Mode M0 | |||
|---|---|---|---|
| Quadrant | BADHDUFLAG | Total packets | Discarded packets |
| A | 0 | 11568 | 3 |
| B | 0 | 24966 | 2 |
| C | 0 | 15115 | 2 |
| D | 0 | 15658 | 2 |
| Mode SS | |||
|---|---|---|---|
| Quadrant | BADHDUFLAG | Total packets | Discarded packets |
| A | 0 | 116 | 0 |
| B | 0 | 116 | 0 |
| C | 0 | 116 | 0 |
| D | 0 | 116 | 0 |
| Quadrant | Total seconds | Saturated seconds | Saturation percentage |
|---|---|---|---|
| A | 5670 | 9 | 0.158730% |
| B | 5670 | 686 | 12.098765% |
| C | 5670 | 227 | 4.003527% |
| D | 5670 | 305 | 5.379189% |
Noise dominated data is calculated using 1-second bins in cleaned event files. If a bin has >2000 counts, and if more than 50% of those come from <1% of pixels, then it is considered to be noise-dominated and hence unusable.
| Quadrant | # 1 sec bins | Bins with >0 counts | Bins with >2000 counts | High rate bins dominated by noise | Noise dominated (total time) | Noise dominated (detector-on time) | Marked lightcurve |
|---|---|---|---|---|---|---|---|
| A | 7074 | 5671 | 0 | 0 | 0.00% | 0.00% | 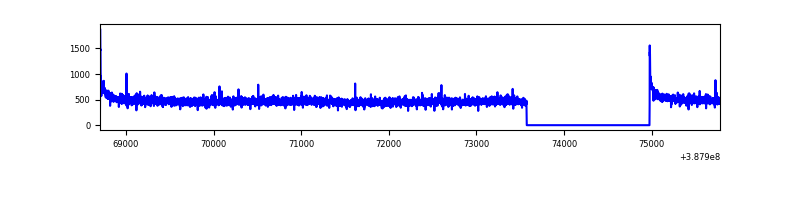 |
| B | 7074 | 5671 | 380 | 380 | 5.37% | 6.70% | 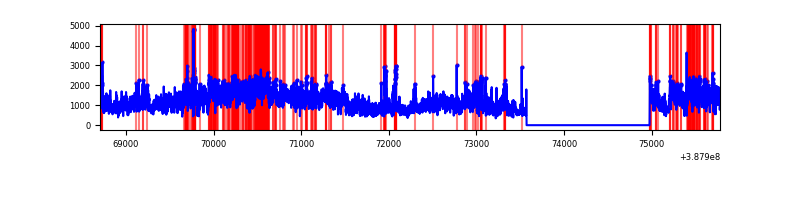 |
| C | 7074 | 5671 | 145 | 145 | 2.05% | 2.56% | 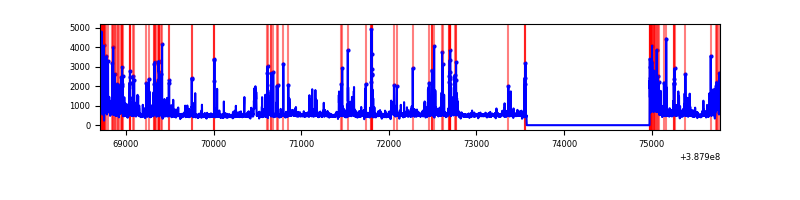 |
| D | 7074 | 5671 | 247 | 247 | 3.49% | 4.36% | 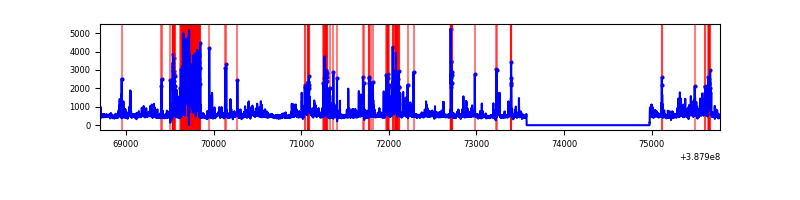 |
Top three noisy pixels from each quadrant. If the there are fewer than three noisy pixels in the level2.evt file, extra rows are filled as -1
| Pixel properties | Quadrant properties | ||||||
|---|---|---|---|---|---|---|---|
| Quadrant | DetID | PixID | Counts | Sigma | Mean | Median | Sigma |
| A | 10 | 83 | 126517 | 954.81 | 656 | 642 | 131.8 |
| A | 13 | 6 | 17219 | 125.74 | 656 | 642 | 131.8 |
| A | 13 | 254 | 9193 | 64.86 | 656 | 642 | 131.8 |
| B | 4 | 251 | 4049290 | 32904.15 | 635 | 619 | 123.0 |
| B | 5 | 172 | 201162 | 1629.84 | 635 | 619 | 123.0 |
| B | 5 | 236 | 127116 | 1028.06 | 635 | 619 | 123.0 |
| C | 4 | 254 | 644554 | 4380.9 | 630 | 634 | 147.0 |
| C | 0 | 207 | 282106 | 1914.99 | 630 | 634 | 147.0 |
| C | 0 | 10 | 279977 | 1900.51 | 630 | 634 | 147.0 |
| D | 12 | 6 | 861771 | 5649.44 | 624 | 609 | 152.4 |
| D | 13 | 249 | 219990 | 1439.19 | 624 | 609 | 152.4 |
| D | 1 | 52 | 144933 | 946.8 | 624 | 609 | 152.4 |
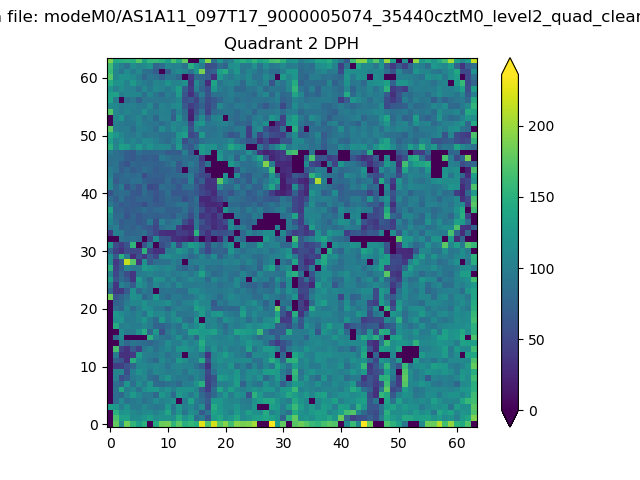
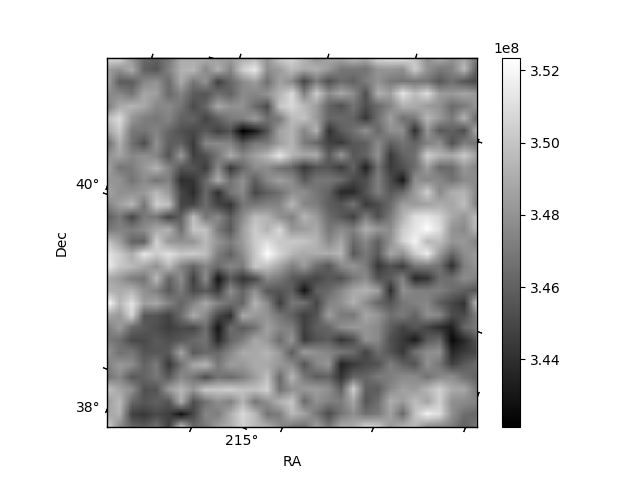
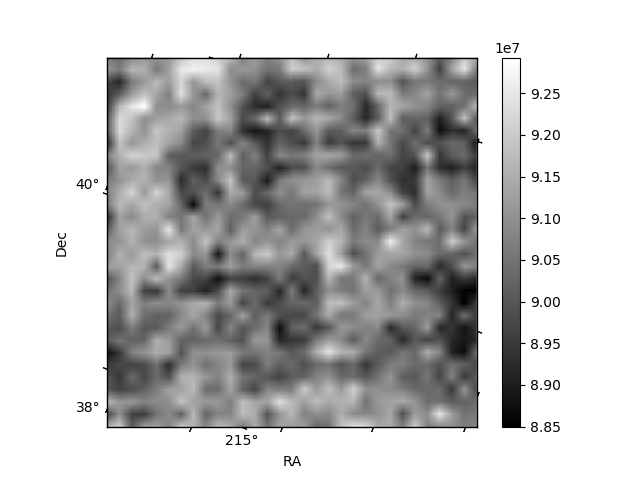
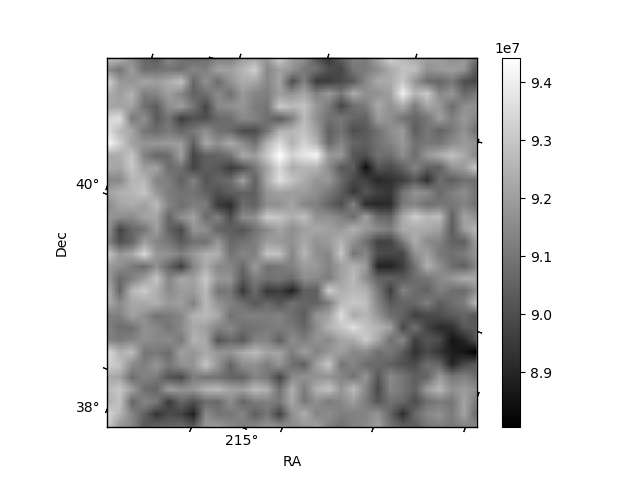
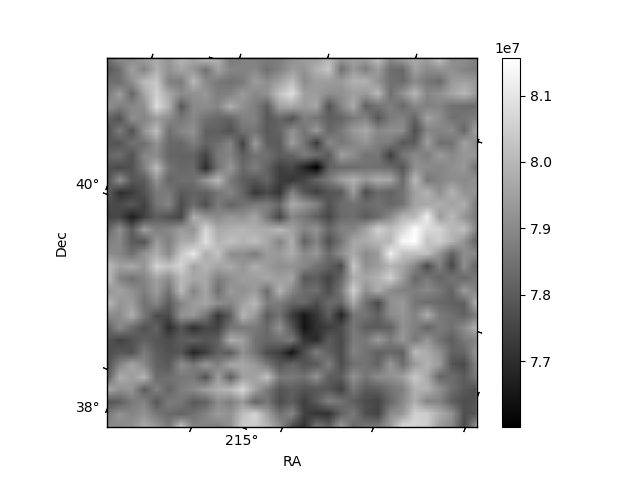
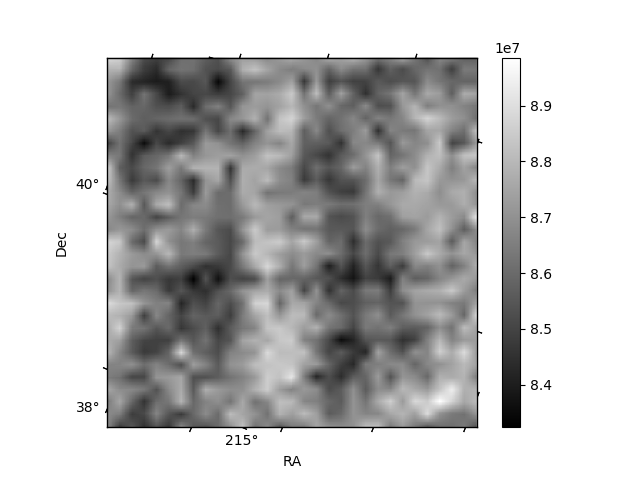
Histogram calculated using DETX and DETY for each event in the final _common_clean file
| Quadrant A | 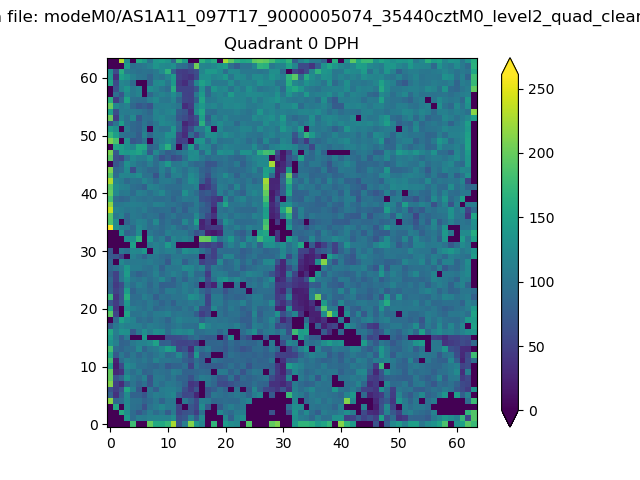 |
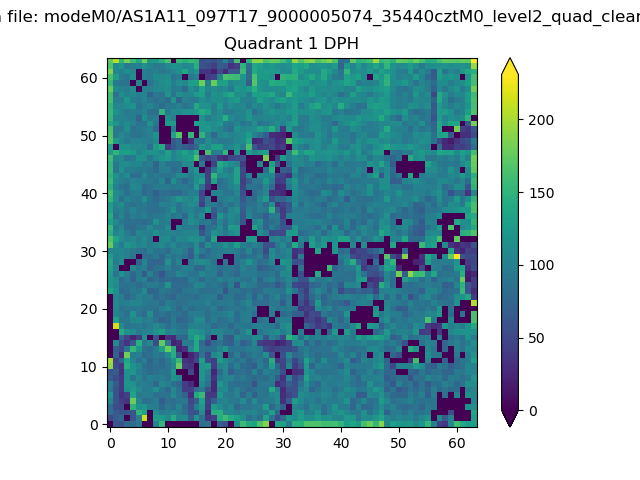 |
Quadrant B |
|---|---|---|---|
| Quadrant D | 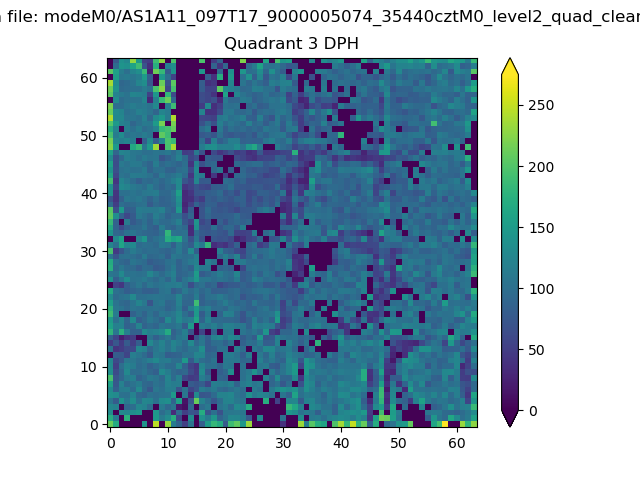 |
 |
Quadrant C |
| Plot type | Count rate plots | Images |
|---|---|---|
| Comparison with Poisson distribution Blue bars denote a histogram of data divided into 1 sec bins. Red curve is a Poisson curve with rate = median count rate of data. |
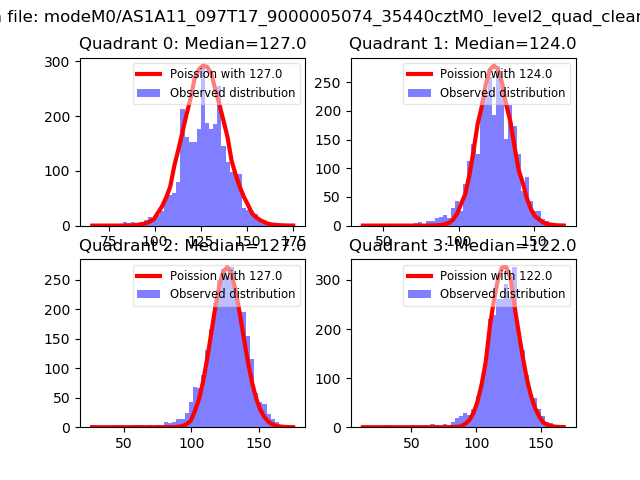 |
 |
| Quadrant-wise count rates Data is divided into 100 sec bins |
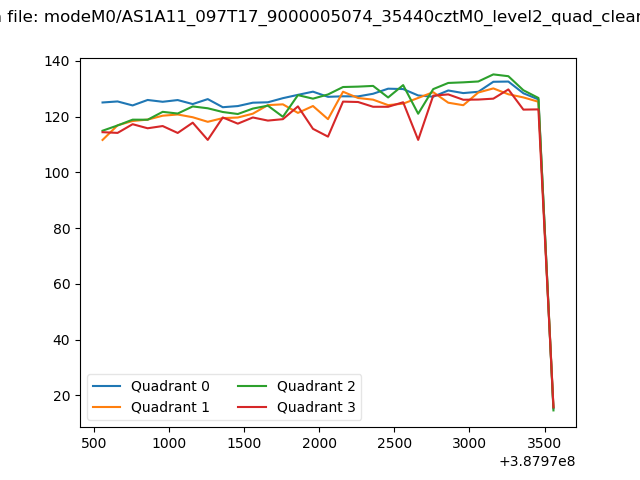 |
|
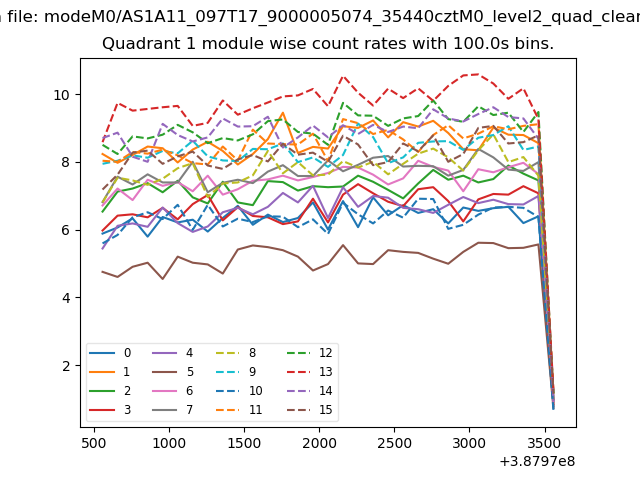
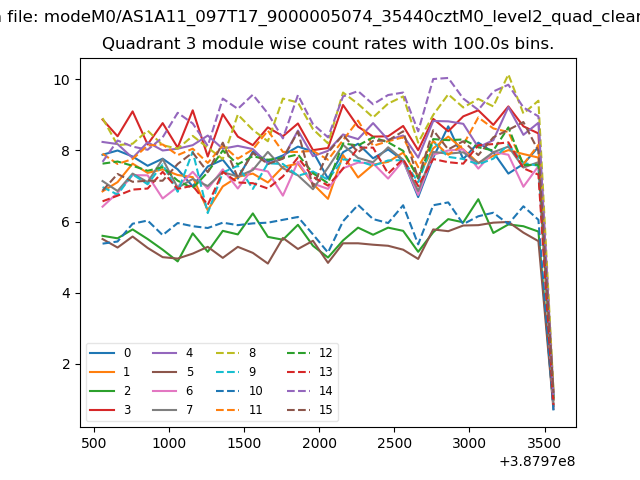
| Module-wise count rates for Quadrant A Data is divided into 100 sec bins |
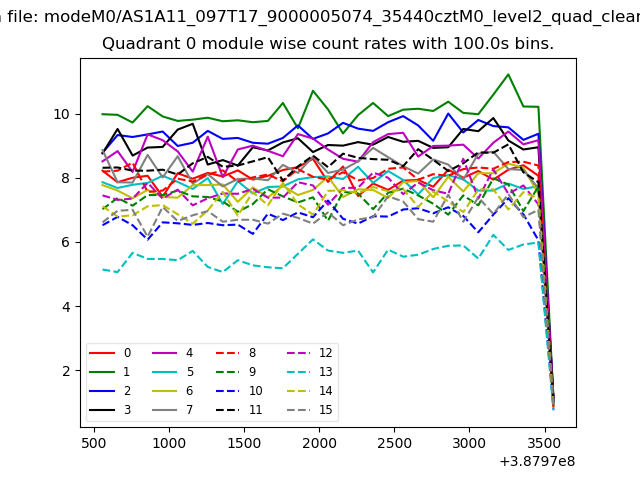 |
 |
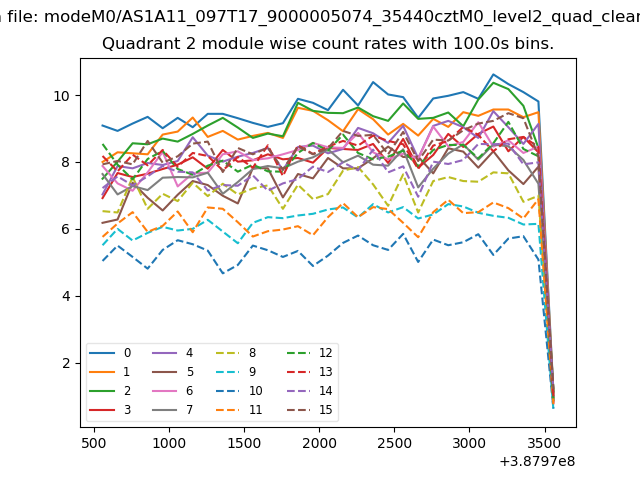
| Module-wise count rates for Quadrant B Data is divided into 100 sec bins |
 |
 |
| Module-wise count rates for Quadrant C Data is divided into 100 sec bins |
 |
 |
| Module-wise count rates for Quadrant D Data is divided into 100 sec bins |
 |
 |
| Parameter | Plot |
|---|---|
| CZT HV Monitor | 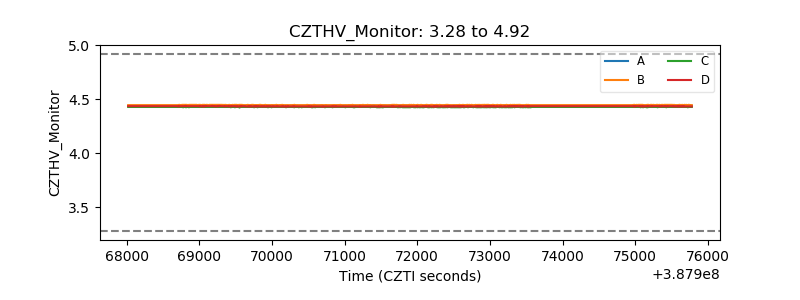 |
| D_VDD | 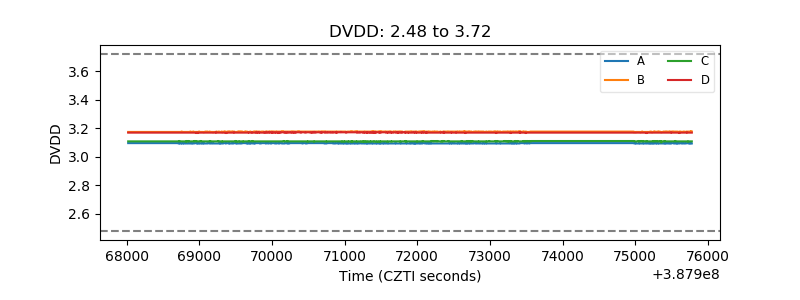 |
| Temperature 1 | 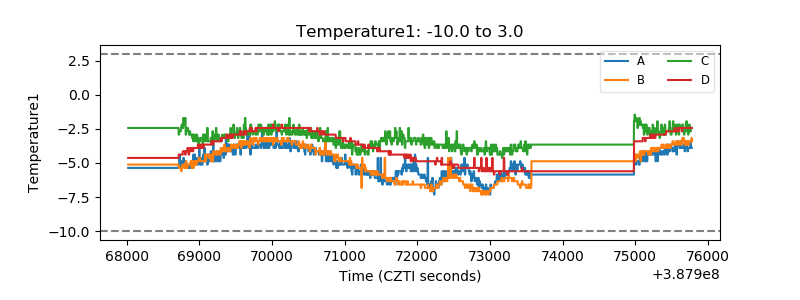 |
| Veto HV Monitor | 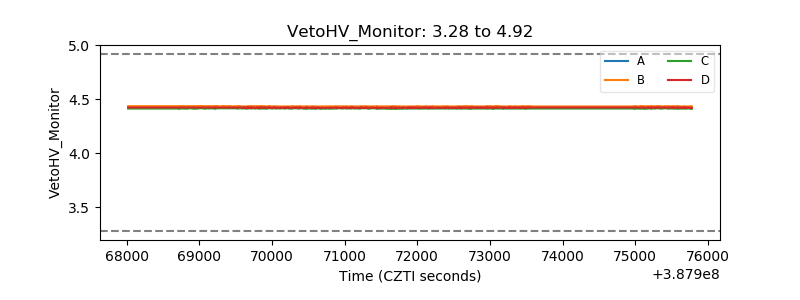 |
| Veto LLD | 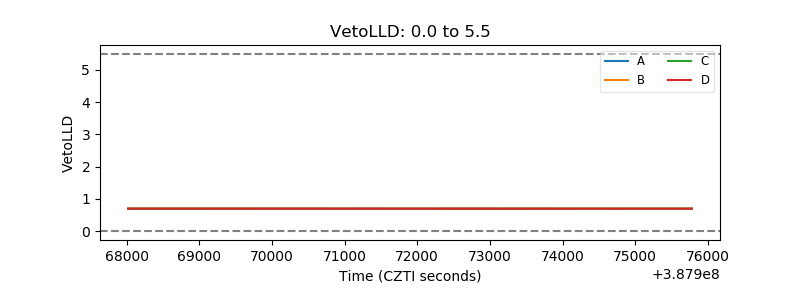 |
| Alpha Counter | 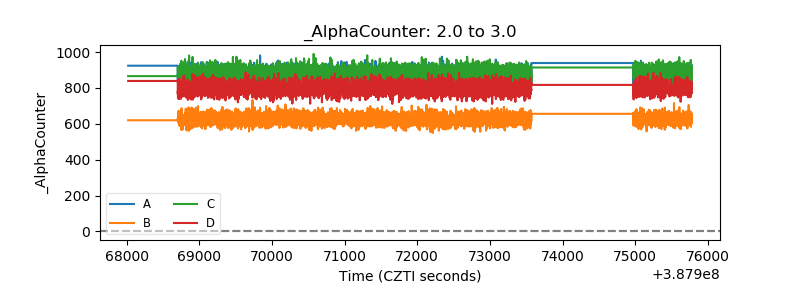 |
| _CPM_Rate | 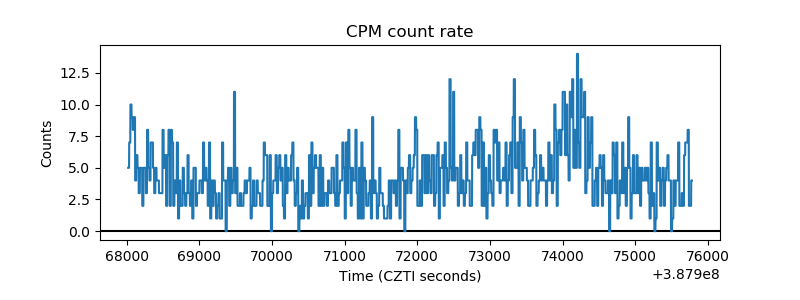 |
| CZT Counter | 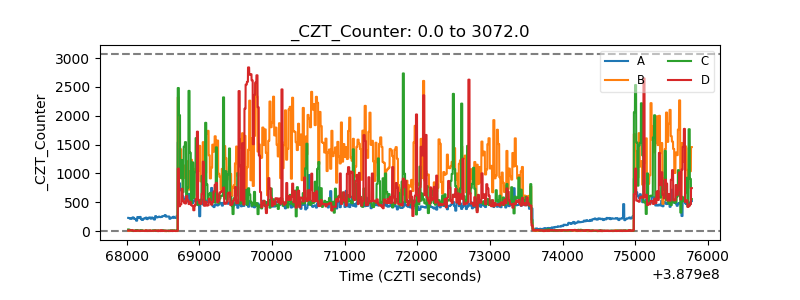 |
| +2.5 Volts monitor | 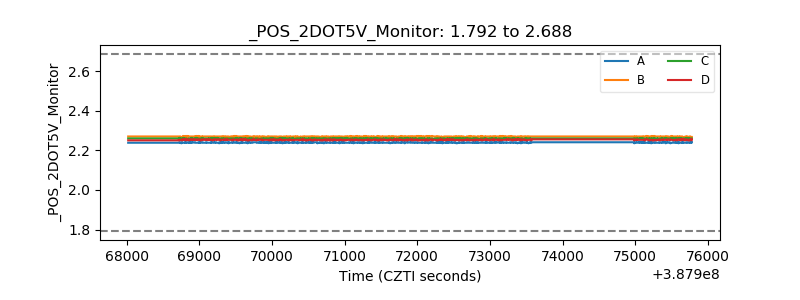 |
| +5 Volts monitor | 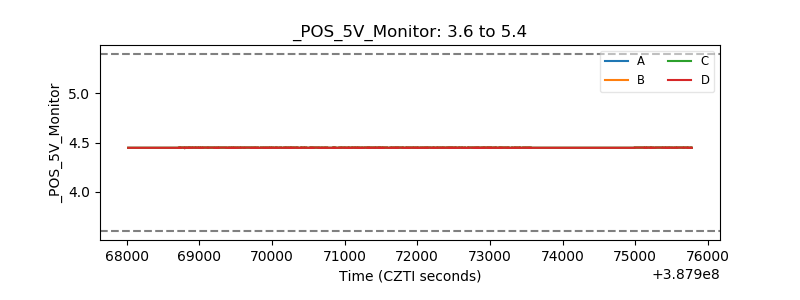 |
| _ROLL_ROT | 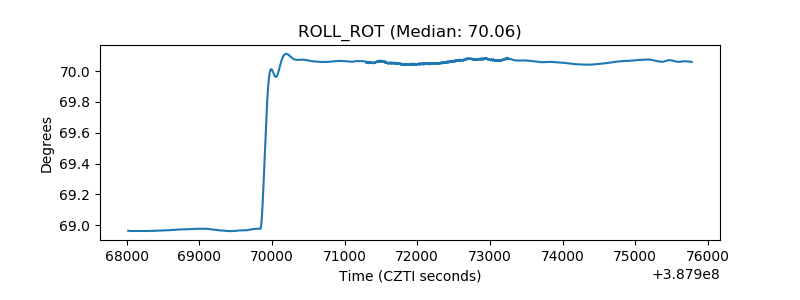 |
| _Roll_DEC | 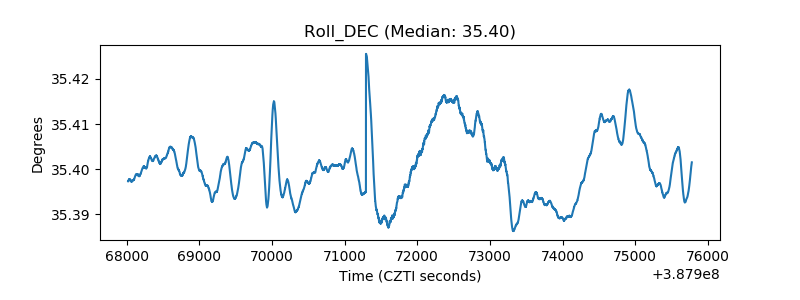 |
| _Roll_RA | 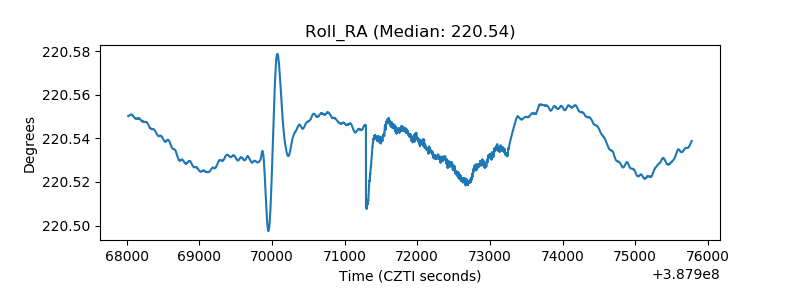 |
| Veto Counter | 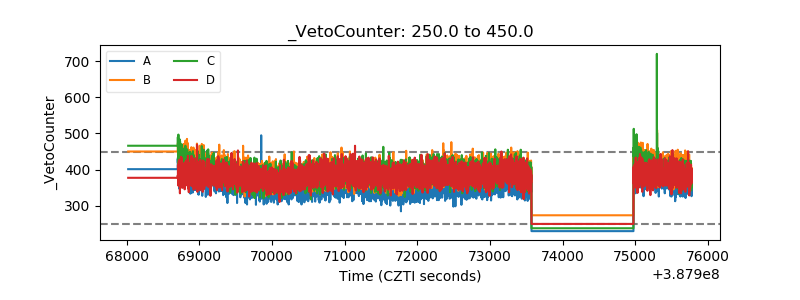 |