| Param | Original file | Final file |
|---|---|---|
| Filename | modeM0/AS1A11_097T17_9000005074_35439cztM0_level2.evt | modeM0/AS1A11_097T17_9000005074_35439cztM0_level2_quad_clean.evt |
| Size (bytes) | 609,252,480 | 52,009,920 |
| Size | 581.0 MB | 49.6 MB |
| Events in quadrant A | 2,571,246 | 322,541 |
| Events in quadrant B | 8,365,400 | 258,497 |
| Events in quadrant C | 3,977,539 | 306,709 |
| Events in quadrant D | 3,171,223 | 307,545 |
| Mode M9 | |||
|---|---|---|---|
| Quadrant | BADHDUFLAG | Total packets | Discarded packets |
| A | 0 | 23 | 0 |
| B | 0 | 23 | 0 |
| C | 0 | 23 | 0 |
| D | 0 | 24 | 0 |
| Mode M0 | |||
|---|---|---|---|
| Quadrant | BADHDUFLAG | Total packets | Discarded packets |
| A | 0 | 11037 | 3 |
| B | 0 | 28584 | 2 |
| C | 0 | 15241 | 2 |
| D | 0 | 12806 | 2 |
| Mode SS | |||
|---|---|---|---|
| Quadrant | BADHDUFLAG | Total packets | Discarded packets |
| A | 0 | 110 | 0 |
| B | 0 | 110 | 0 |
| C | 0 | 110 | 0 |
| D | 0 | 110 | 0 |
| Quadrant | Total seconds | Saturated seconds | Saturation percentage |
|---|---|---|---|
| A | 5406 | 5 | 0.092490% |
| B | 5406 | 2120 | 39.215686% |
| C | 5406 | 286 | 5.290418% |
| D | 5406 | 34 | 0.628931% |
Noise dominated data is calculated using 1-second bins in cleaned event files. If a bin has >2000 counts, and if more than 50% of those come from <1% of pixels, then it is considered to be noise-dominated and hence unusable.
| Quadrant | # 1 sec bins | Bins with >0 counts | Bins with >2000 counts | High rate bins dominated by noise | Noise dominated (total time) | Noise dominated (detector-on time) | Marked lightcurve |
|---|---|---|---|---|---|---|---|
| A | 7078 | 5407 | 0 | 0 | 0.00% | 0.00% | 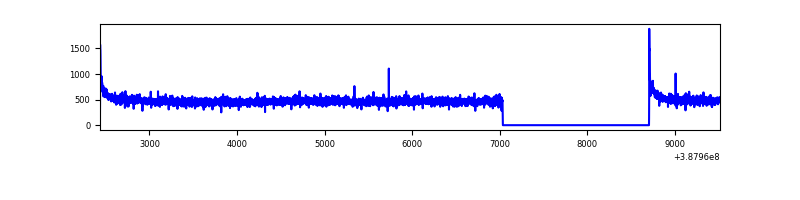 |
| B | 7078 | 5407 | 1586 | 1586 | 22.41% | 29.33% | 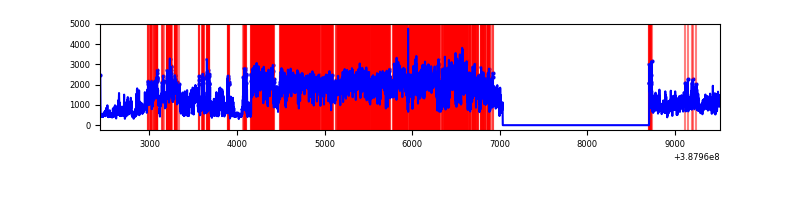 |
| C | 7078 | 5407 | 230 | 230 | 3.25% | 4.25% | 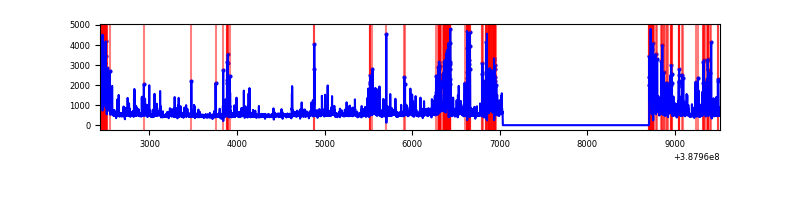 |
| D | 7078 | 5407 | 24 | 24 | 0.34% | 0.44% | 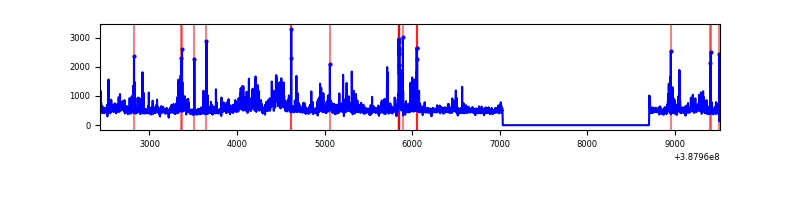 |
Top three noisy pixels from each quadrant. If the there are fewer than three noisy pixels in the level2.evt file, extra rows are filled as -1
| Pixel properties | Quadrant properties | ||||||
|---|---|---|---|---|---|---|---|
| Quadrant | DetID | PixID | Counts | Sigma | Mean | Median | Sigma |
| A | 10 | 83 | 125810 | 988.27 | 628 | 614 | 126.7 |
| A | 13 | 6 | 15286 | 115.82 | 628 | 614 | 126.7 |
| A | 13 | 254 | 8666 | 63.56 | 628 | 614 | 126.7 |
| B | 4 | 251 | 5001320 | 45743.85 | 563 | 549 | 109.3 |
| B | 5 | 236 | 641692 | 5864.77 | 563 | 549 | 109.3 |
| B | 5 | 31 | 165974 | 1513.2 | 563 | 549 | 109.3 |
| C | 4 | 254 | 828526 | 5989.01 | 597 | 600 | 138.2 |
| C | 0 | 10 | 345277 | 2493.31 | 597 | 600 | 138.2 |
| C | 0 | 207 | 242958 | 1753.16 | 597 | 600 | 138.2 |
| D | 1 | 52 | 272078 | 1849.1 | 609 | 593 | 146.8 |
| D | 8 | 195 | 142008 | 963.19 | 609 | 593 | 146.8 |
| D | 12 | 6 | 82817 | 560.03 | 609 | 593 | 146.8 |
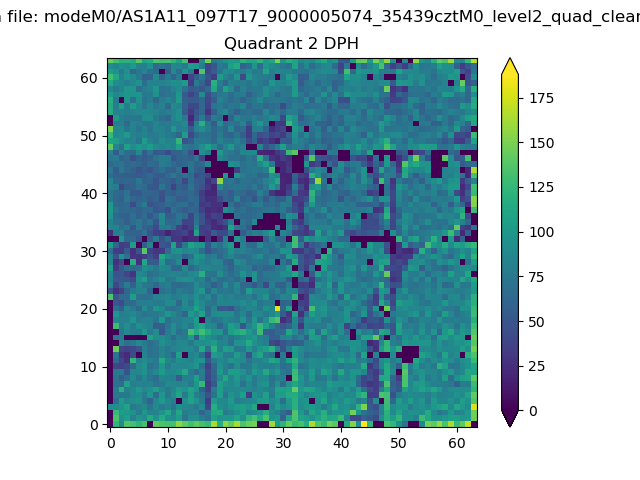
Histogram calculated using DETX and DETY for each event in the final _common_clean file
| Quadrant A | 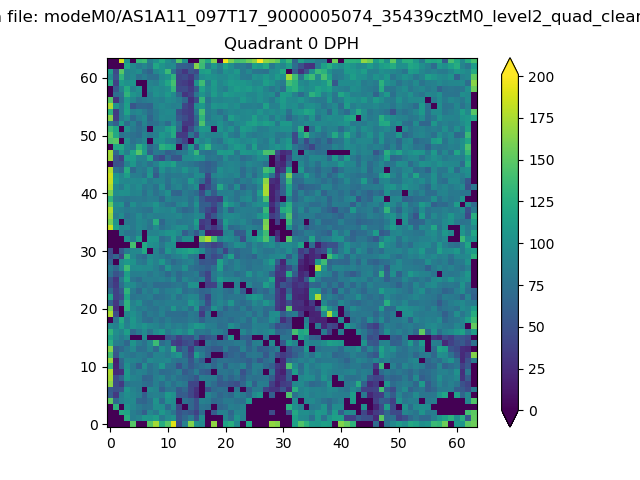 |
 |
Quadrant B |
|---|---|---|---|
| Quadrant D | 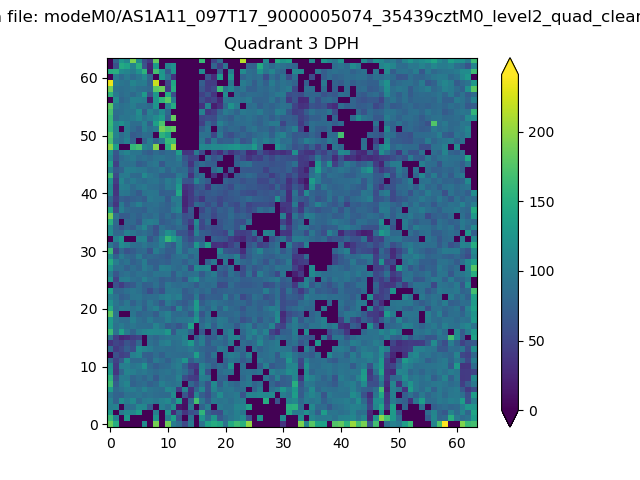 |
 |
Quadrant C |
| Plot type | Count rate plots | Images |
|---|---|---|
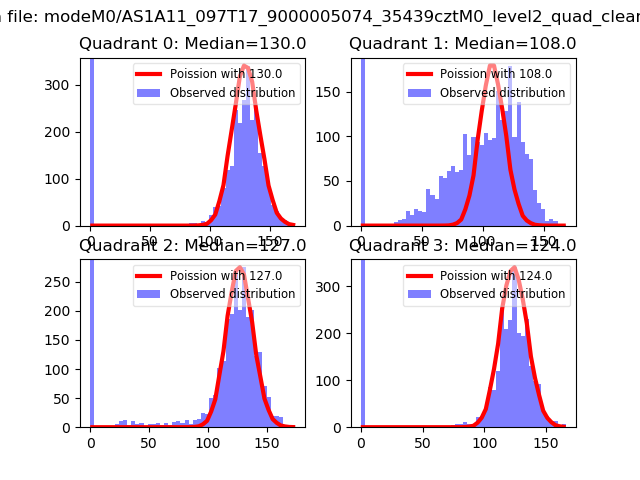
| Comparison with Poisson distribution Blue bars denote a histogram of data divided into 1 sec bins. Red curve is a Poisson curve with rate = median count rate of data. |
 |
 |
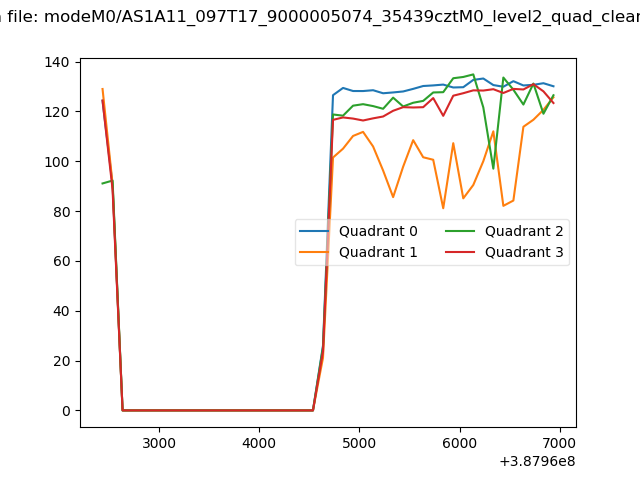
| Quadrant-wise count rates Data is divided into 100 sec bins |
 |
|
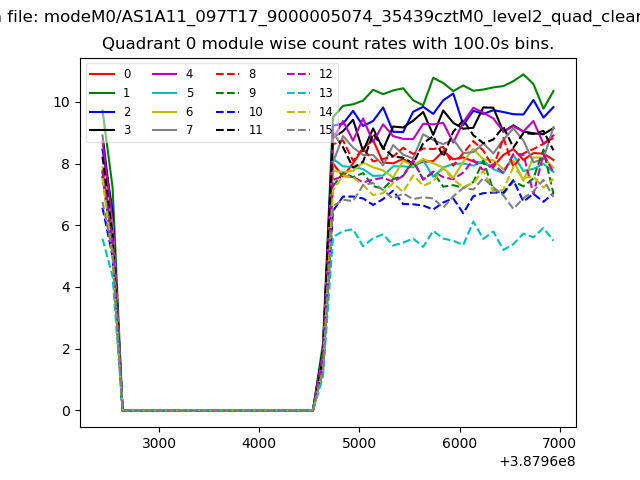
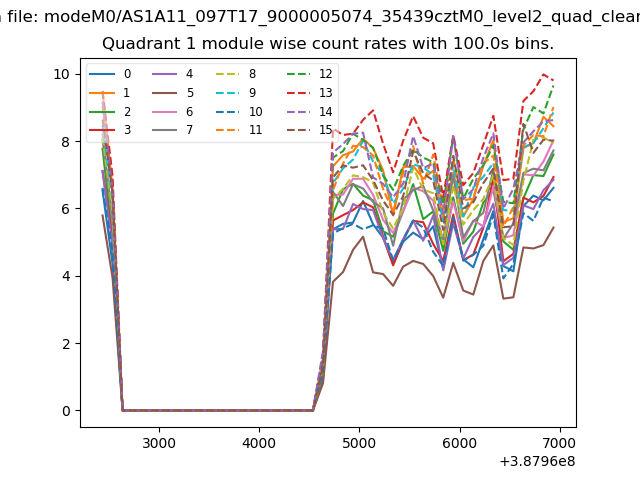
| Module-wise count rates for Quadrant A Data is divided into 100 sec bins |
 |
 |
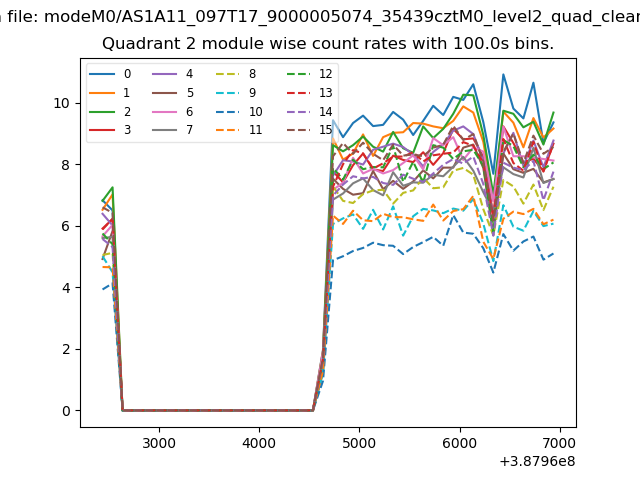
| Module-wise count rates for Quadrant B Data is divided into 100 sec bins |
 |
 |
| Module-wise count rates for Quadrant C Data is divided into 100 sec bins |
 |
 |
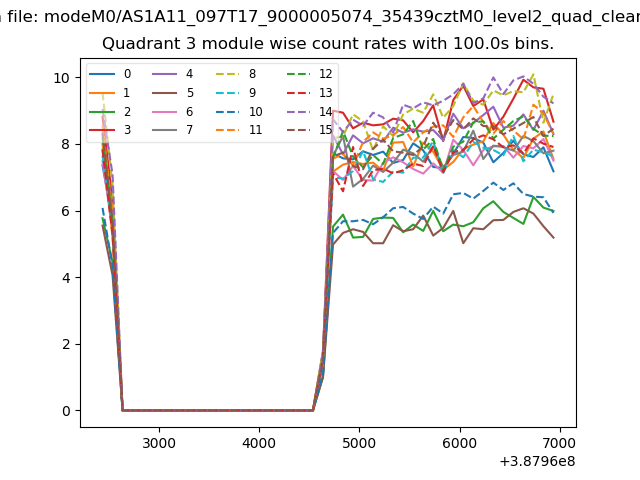
| Module-wise count rates for Quadrant D Data is divided into 100 sec bins |
 |
 |
| Parameter | Plot |
|---|---|
| CZT HV Monitor |  |
| D_VDD | 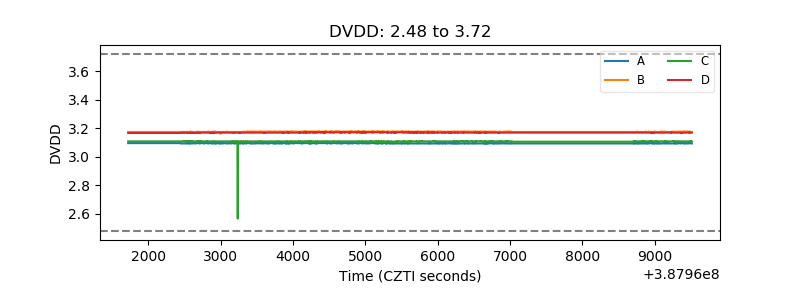 |
| Temperature 1 | 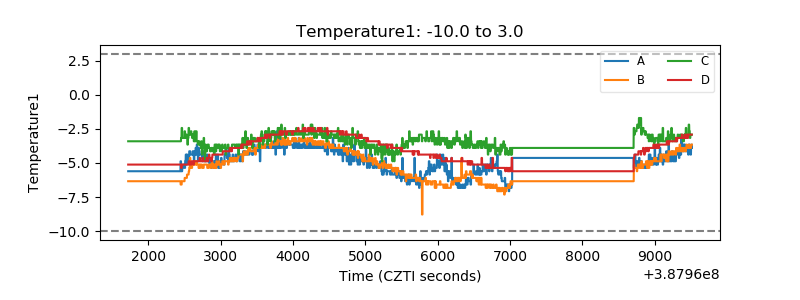 |
| Veto HV Monitor | 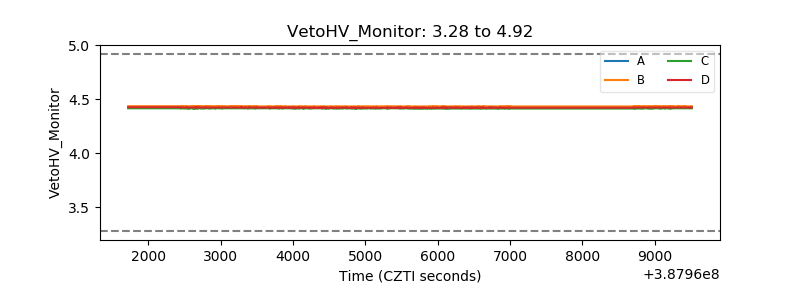 |
| Veto LLD | 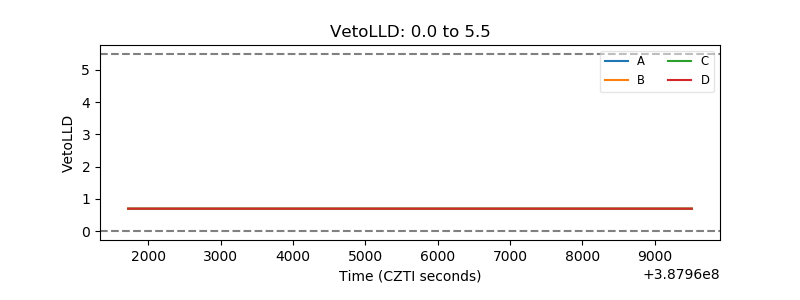 |
| Alpha Counter | 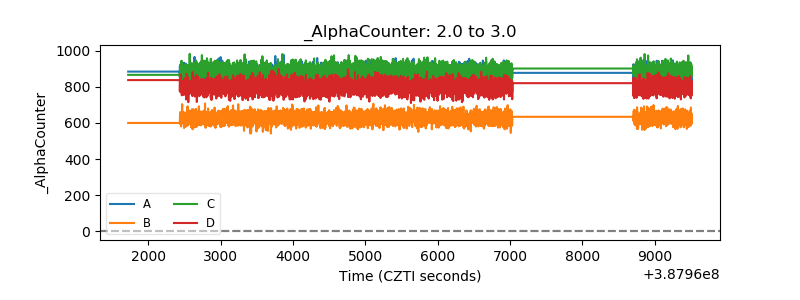 |
| _CPM_Rate | 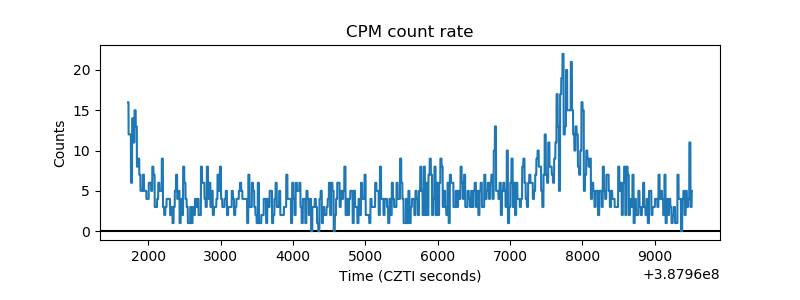 |
| CZT Counter | 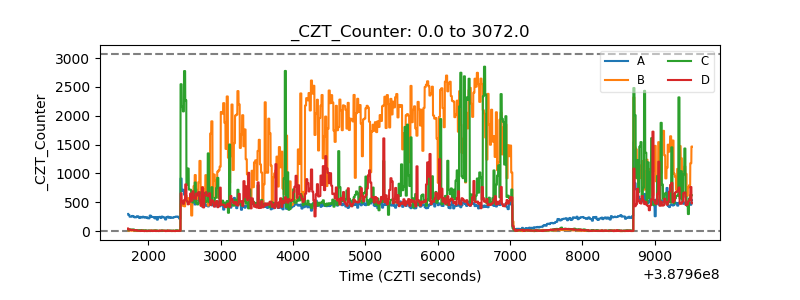 |
| +2.5 Volts monitor | 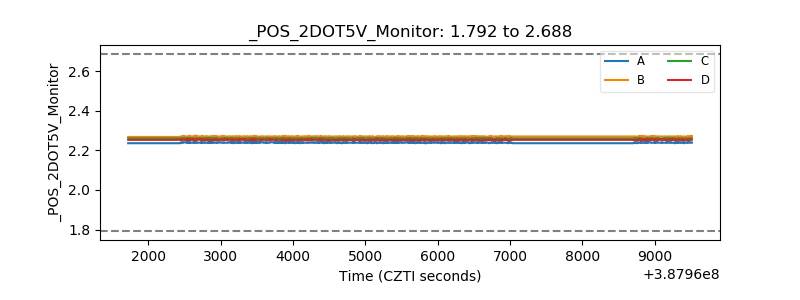 |
| +5 Volts monitor | 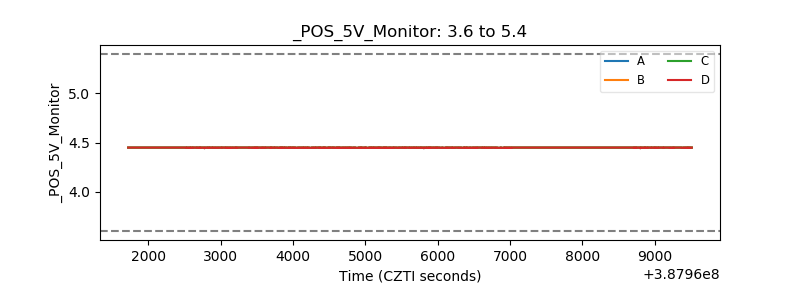 |
| _ROLL_ROT | 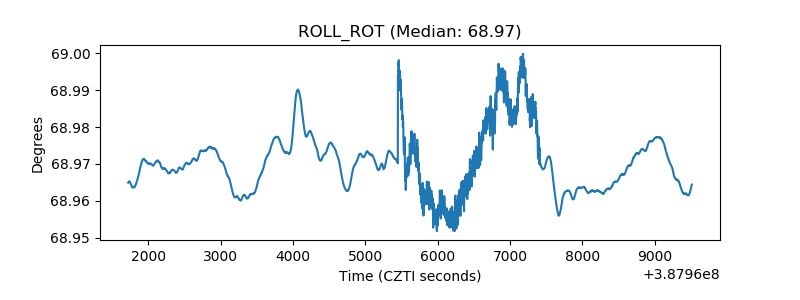 |
| _Roll_DEC | 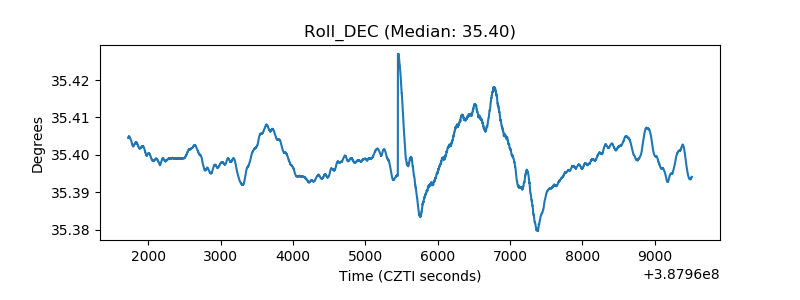 |
| _Roll_RA | 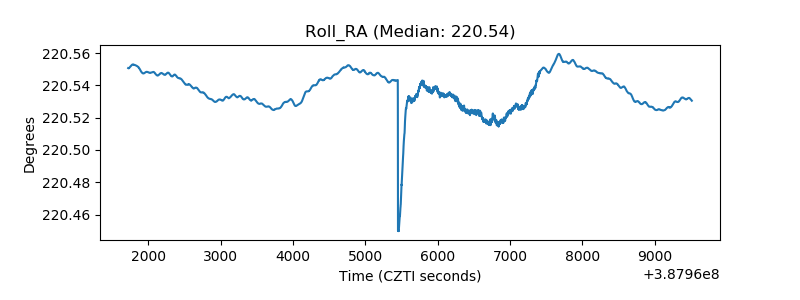 |
| Veto Counter | 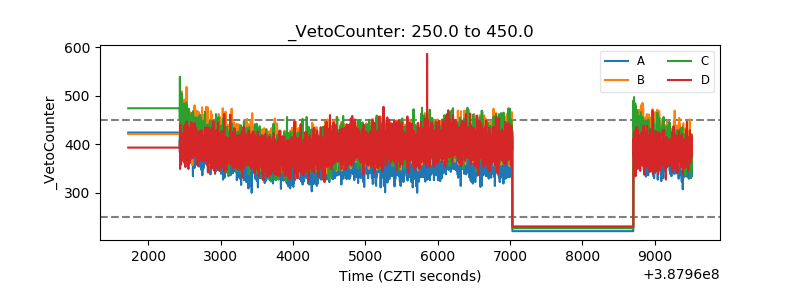 |