| Param | Original file | Final file |
|---|---|---|
| Filename | modeM0/AS1A11_097T17_9000005074_35435cztM0_level2.evt | modeM0/AS1A11_097T17_9000005074_35435cztM0_level2_quad_clean.evt |
| Size (bytes) | 437,676,480 | 68,598,720 |
| Size | 417.4 MB | 65.4 MB |
| Events in quadrant A | 2,564,521 | 435,691 |
| Events in quadrant B | 3,633,137 | 442,537 |
| Events in quadrant C | 3,976,430 | 425,062 |
| Events in quadrant D | 2,736,749 | 418,396 |
| Mode M9 | |||
|---|---|---|---|
| Quadrant | BADHDUFLAG | Total packets | Discarded packets |
| A | 0 | 31 | 0 |
| B | 0 | 31 | 0 |
| C | 0 | 31 | 0 |
| D | 0 | 32 | 0 |
| Mode M0 | |||
|---|---|---|---|
| Quadrant | BADHDUFLAG | Total packets | Discarded packets |
| A | 0 | 10610 | 3 |
| B | 0 | 14185 | 2 |
| C | 0 | 15094 | 2 |
| D | 0 | 11481 | 2 |
| Mode SS | |||
|---|---|---|---|
| Quadrant | BADHDUFLAG | Total packets | Discarded packets |
| A | 0 | 102 | 0 |
| B | 0 | 102 | 0 |
| C | 0 | 102 | 0 |
| D | 0 | 102 | 0 |
| Quadrant | Total seconds | Saturated seconds | Saturation percentage |
|---|---|---|---|
| A | 5074 | 3 | 0.059125% |
| B | 5074 | 167 | 3.291289% |
| C | 5074 | 332 | 6.543161% |
| D | 5074 | 59 | 1.162791% |
Noise dominated data is calculated using 1-second bins in cleaned event files. If a bin has >2000 counts, and if more than 50% of those come from <1% of pixels, then it is considered to be noise-dominated and hence unusable.
| Quadrant | # 1 sec bins | Bins with >0 counts | Bins with >2000 counts | High rate bins dominated by noise | Noise dominated (total time) | Noise dominated (detector-on time) | Marked lightcurve |
|---|---|---|---|---|---|---|---|
| A | 7107 | 5075 | 0 | 0 | 0.00% | 0.00% | 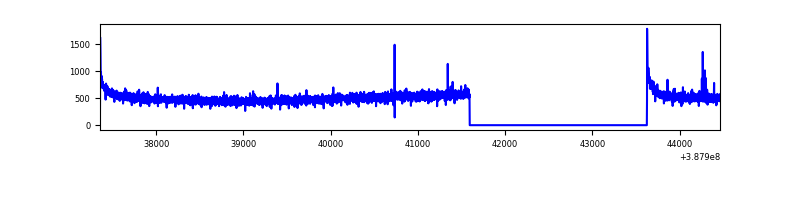 |
| B | 7107 | 5074 | 116 | 116 | 1.63% | 2.29% | 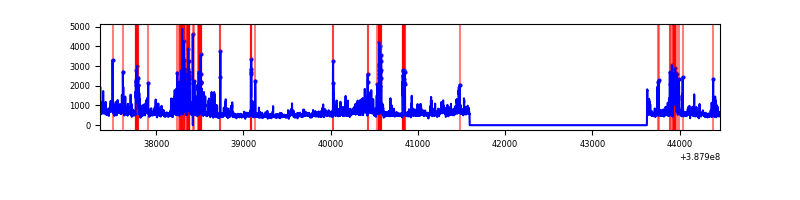 |
| C | 7107 | 5074 | 255 | 255 | 3.59% | 5.03% | 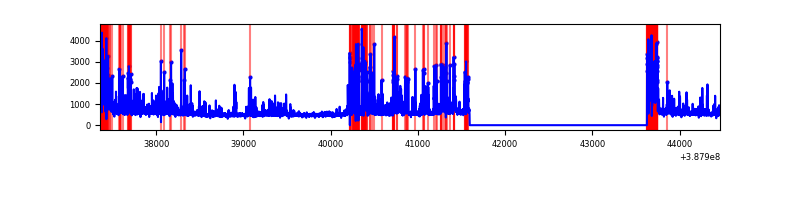 |
| D | 7107 | 5075 | 40 | 40 | 0.56% | 0.79% | 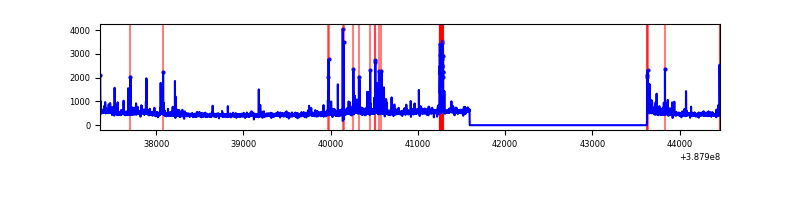 |
Top three noisy pixels from each quadrant. If the there are fewer than three noisy pixels in the level2.evt file, extra rows are filled as -1
| Pixel properties | Quadrant properties | ||||||
|---|---|---|---|---|---|---|---|
| Quadrant | DetID | PixID | Counts | Sigma | Mean | Median | Sigma |
| A | 10 | 83 | 121544 | 963.06 | 625 | 614 | 125.6 |
| A | 13 | 6 | 15915 | 121.85 | 625 | 614 | 125.6 |
| A | 13 | 254 | 7315 | 53.37 | 625 | 614 | 125.6 |
| B | 5 | 236 | 579199 | 4992.04 | 618 | 604 | 115.9 |
| B | 4 | 251 | 415635 | 3580.83 | 618 | 604 | 115.9 |
| B | 5 | 200 | 86832 | 743.96 | 618 | 604 | 115.9 |
| C | 4 | 254 | 747749 | 5497.61 | 590 | 594 | 135.9 |
| C | 0 | 10 | 594342 | 4368.83 | 590 | 594 | 135.9 |
| C | 15 | 214 | 206137 | 1512.4 | 590 | 594 | 135.9 |
| D | 13 | 249 | 142579 | 972.5 | 599 | 583 | 146.0 |
| D | 1 | 52 | 86328 | 587.25 | 599 | 583 | 146.0 |
| D | 7 | 80 | 57489 | 389.74 | 599 | 583 | 146.0 |
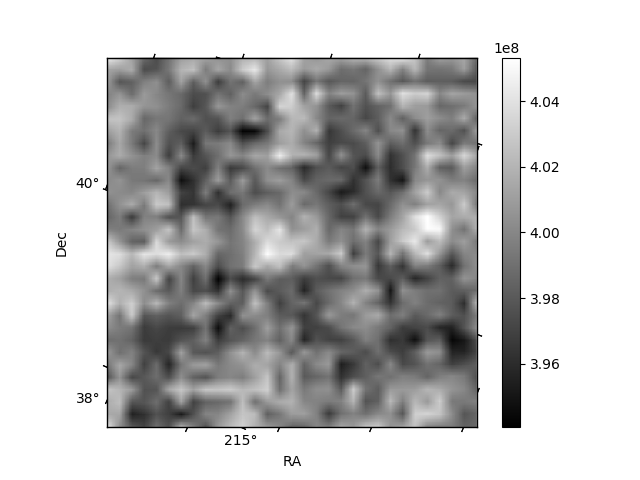
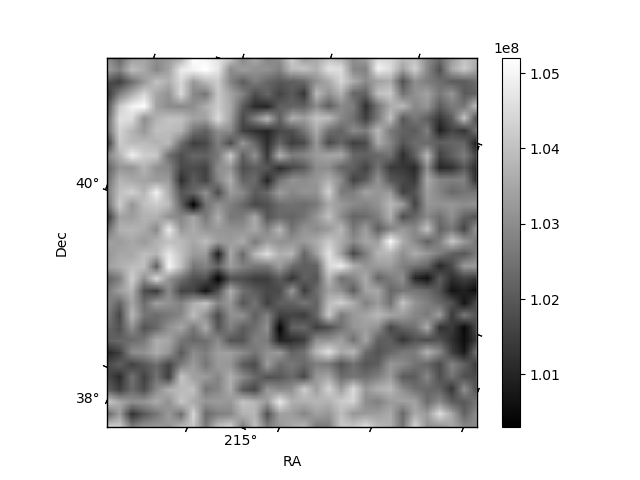
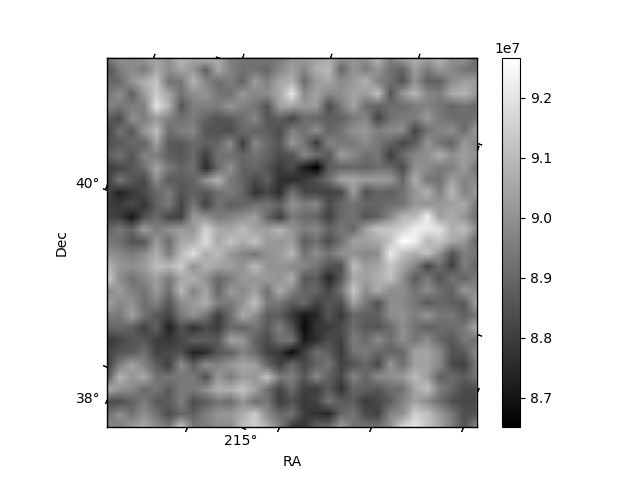
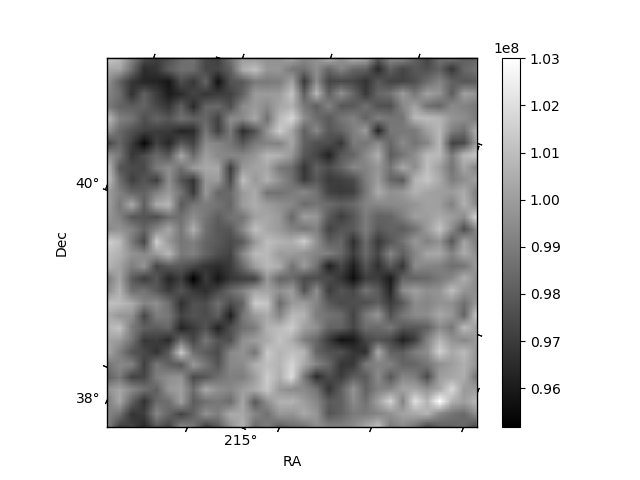
Histogram calculated using DETX and DETY for each event in the final _common_clean file
| Quadrant A | 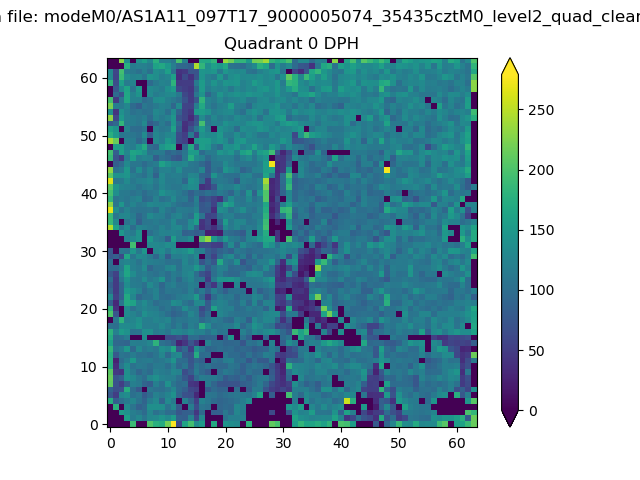 |
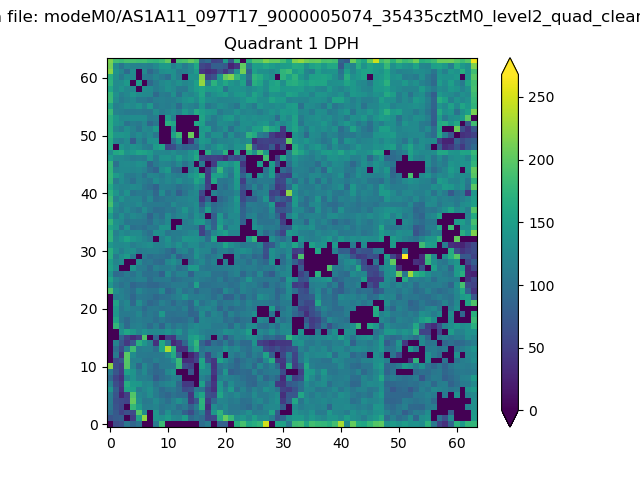 |
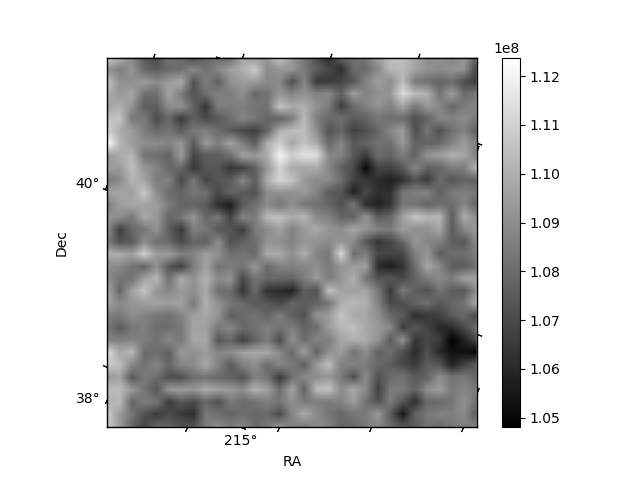
Quadrant B |
|---|---|---|---|
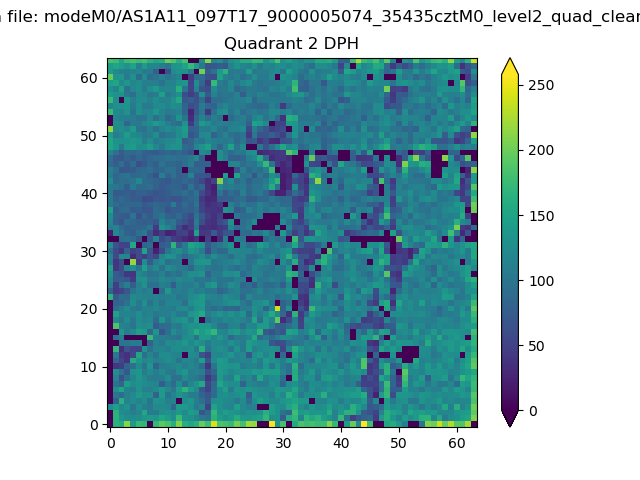
| Quadrant D | 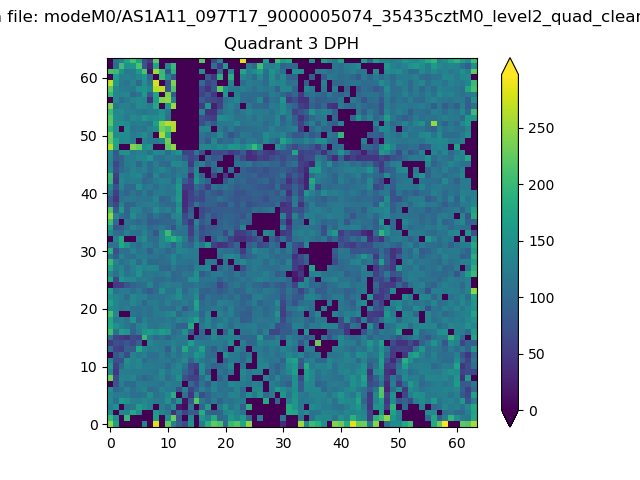 |
 |
Quadrant C |
| Plot type | Count rate plots | Images |
|---|---|---|
| Comparison with Poisson distribution Blue bars denote a histogram of data divided into 1 sec bins. Red curve is a Poisson curve with rate = median count rate of data. |
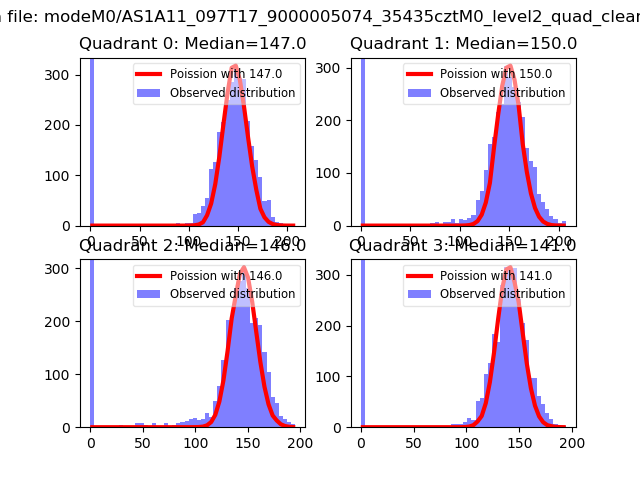 |
 |
| Quadrant-wise count rates Data is divided into 100 sec bins |
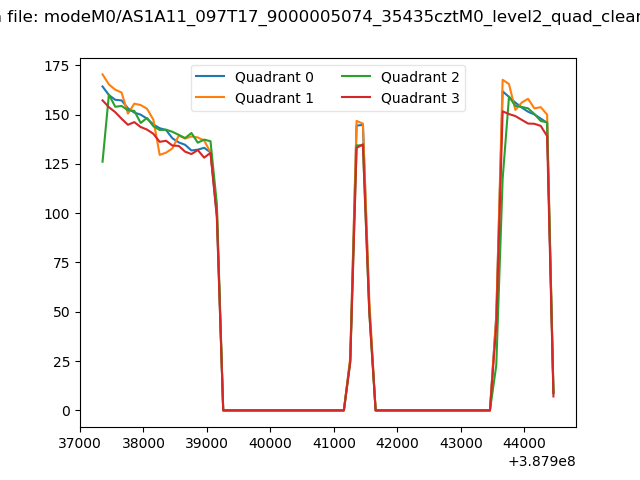 |
|
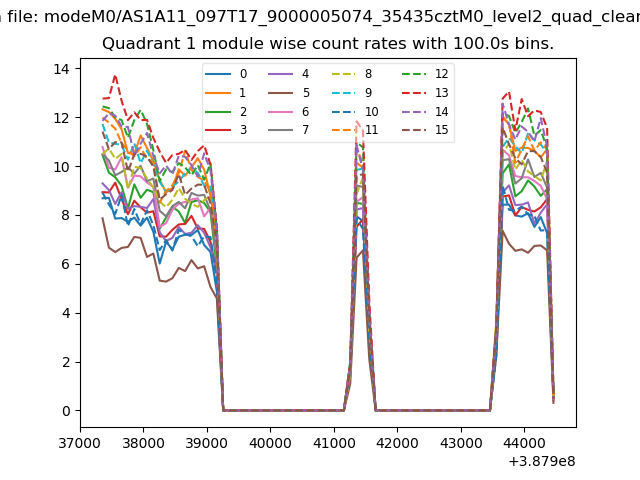
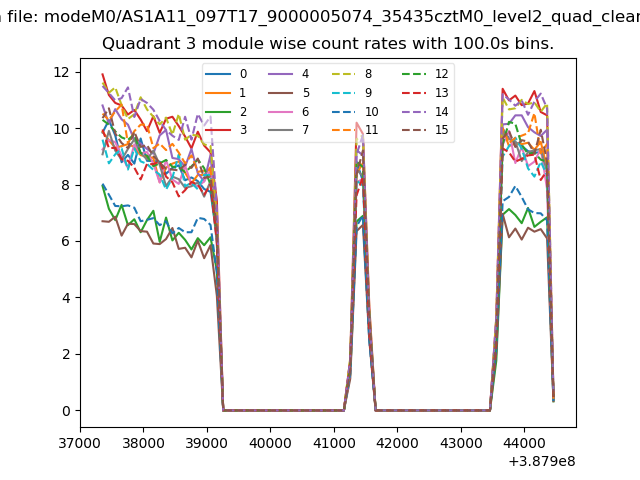
| Module-wise count rates for Quadrant A Data is divided into 100 sec bins |
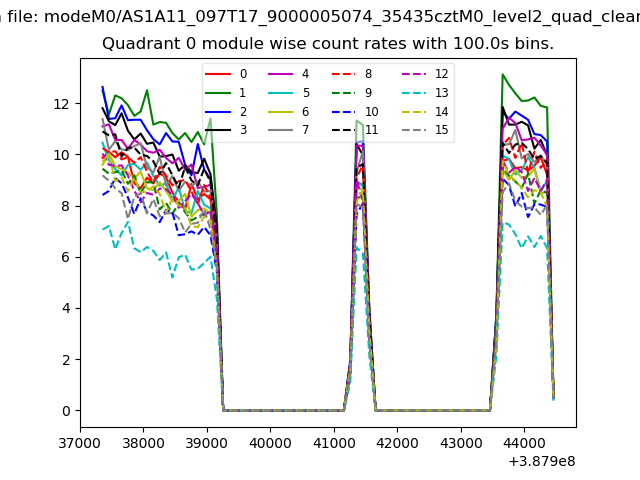 |
 |
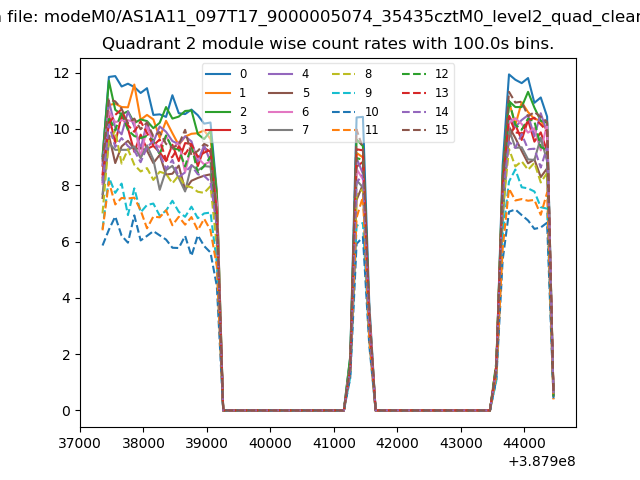
| Module-wise count rates for Quadrant B Data is divided into 100 sec bins |
 |
 |
| Module-wise count rates for Quadrant C Data is divided into 100 sec bins |
 |
 |
| Module-wise count rates for Quadrant D Data is divided into 100 sec bins |
 |
 |
| Parameter | Plot |
|---|---|
| CZT HV Monitor | 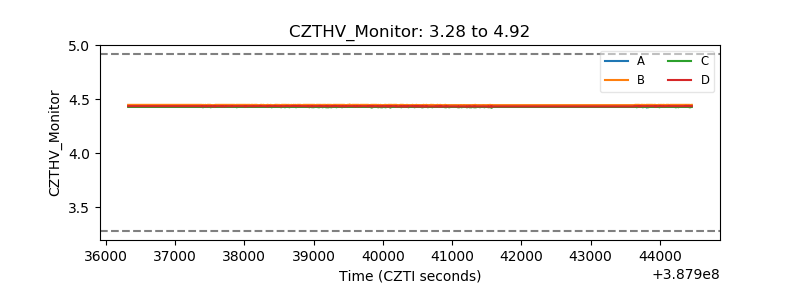 |
| D_VDD | 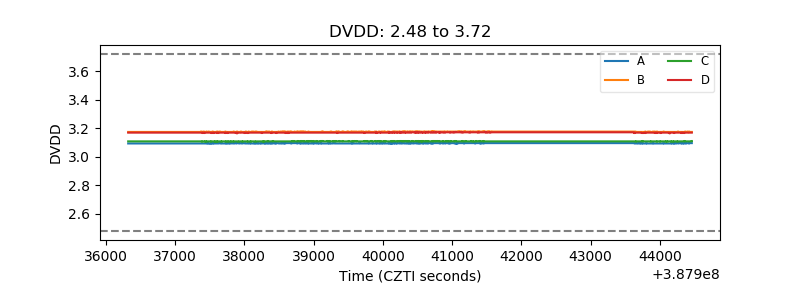 |
| Temperature 1 | 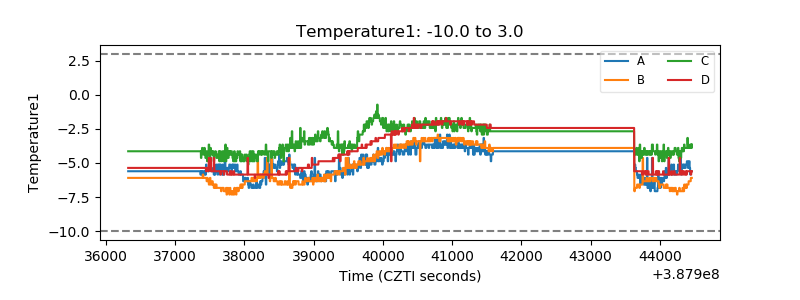 |
| Veto HV Monitor | 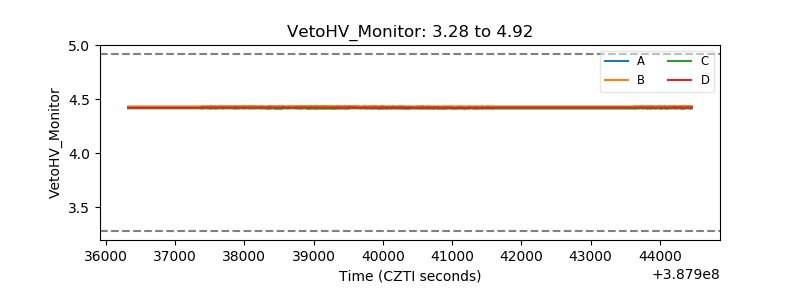 |
| Veto LLD | 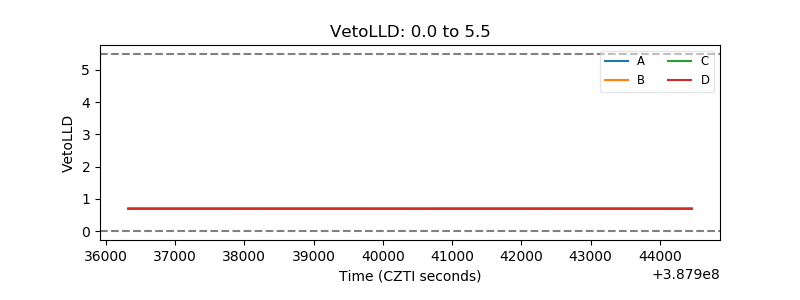 |
| Alpha Counter | 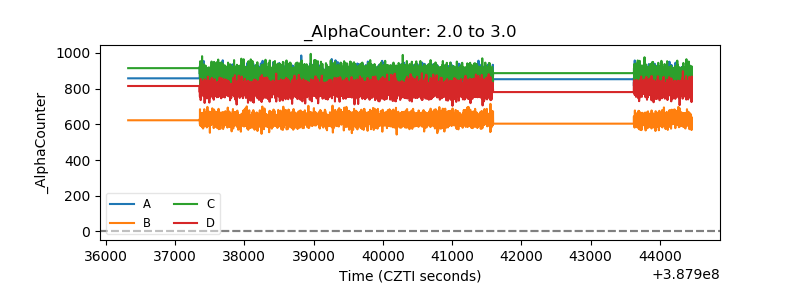 |
| _CPM_Rate | 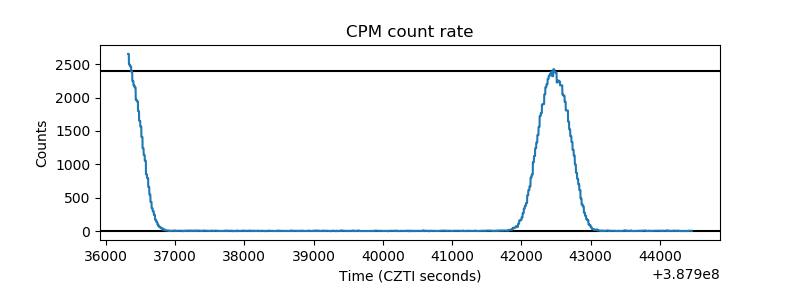 |
| CZT Counter | 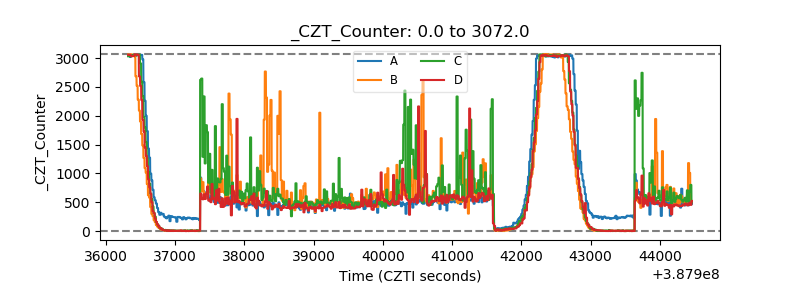 |
| +2.5 Volts monitor | 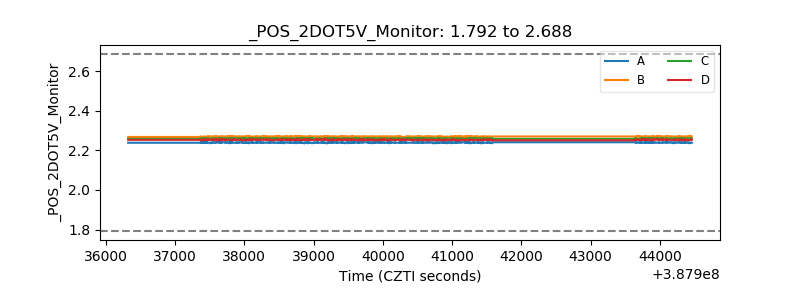 |
| +5 Volts monitor | 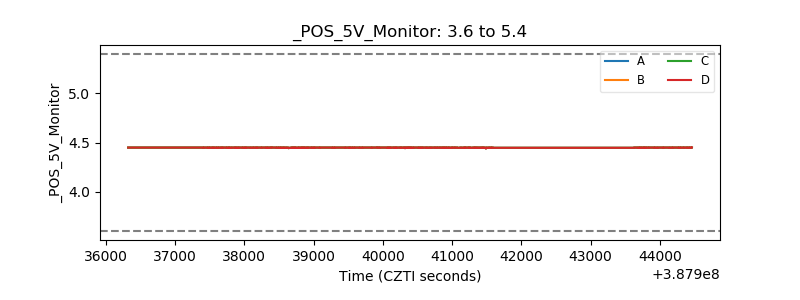 |
| _ROLL_ROT | 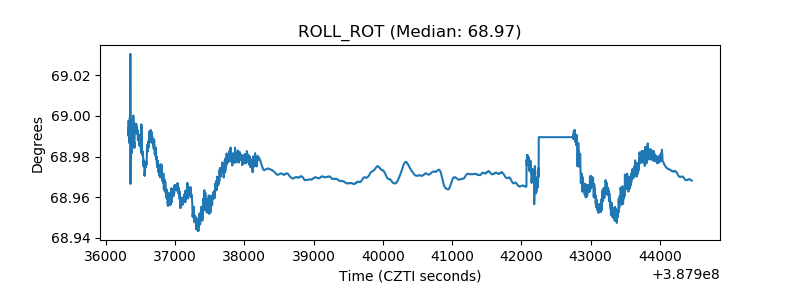 |
| _Roll_DEC | 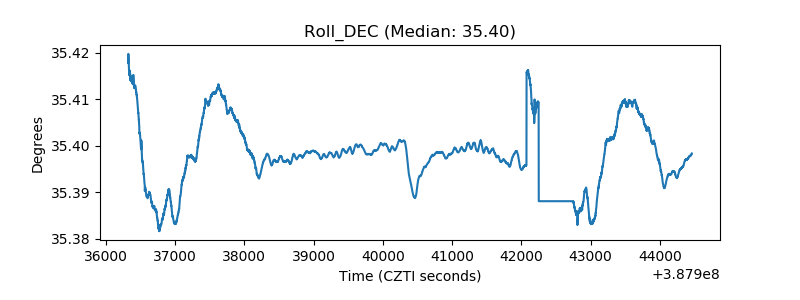 |
| _Roll_RA | 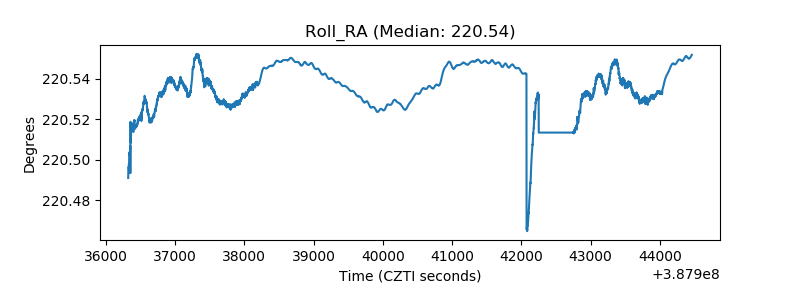 |
| Veto Counter | 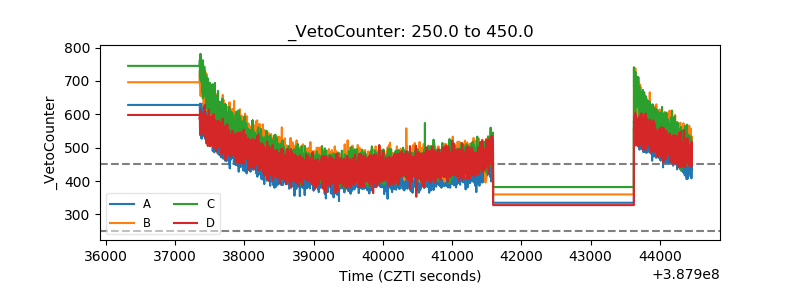 |