| Param | Original file | Final file |
|---|---|---|
| Filename | modeM0/AS1A11_097T17_9000005074cztM0_level2_bc.evt | modeM0/AS1A11_097T17_9000005074cztM0_level2_quad_clean.evt |
| Size (bytes) | 3,403,584,000 | 745,920,000 |
| Size | 3.2 GB | 711.4 MB |
| Events in quadrant A | 12,899,924 | 4,767,418 |
| Events in quadrant B | 43,302,054 | 4,564,995 |
| Events in quadrant C | 22,143,508 | 4,685,833 |
| Events in quadrant D | 20,731,747 | 4,531,947 |
| Mode M9 | |||
|---|---|---|---|
| Quadrant | BADHDUFLAG | Total packets | Discarded packets |
| A | 0 | 222 | 0 |
| B | 0 | 222 | 0 |
| C | 0 | 222 | 0 |
| D | 0 | 222 | 0 |
| Mode M0 | |||
|---|---|---|---|
| Quadrant | BADHDUFLAG | Total packets | Discarded packets |
| A | 0 | 120350 | 0 |
| B | 0 | 230224 | 0 |
| C | 0 | 153417 | 0 |
| D | 0 | 148646 | 0 |
| Mode SS | |||
|---|---|---|---|
| Quadrant | BADHDUFLAG | Total packets | Discarded packets |
| A | 0 | 1204 | 0 |
| B | 0 | 1204 | 0 |
| C | 0 | 1204 | 0 |
| D | 0 | 1204 | 0 |
| Quadrant | Total seconds | Saturated seconds | Saturation percentage |
|---|---|---|---|
| A | 58911 | 61 | 0.103546% |
| B | 58911 | 8251 | 14.005873% |
| C | 58907 | 2476 | 4.203236% |
| D | 58909 | 1591 | 2.700776% |
Noise dominated data is calculated using 1-second bins in cleaned event files. If a bin has >2000 counts, and if more than 50% of those come from <1% of pixels, then it is considered to be noise-dominated and hence unusable.
| Quadrant | # 1 sec bins | Bins with >0 counts | Bins with >2000 counts | High rate bins dominated by noise | Noise dominated (total time) | Noise dominated (detector-on time) | Marked lightcurve |
|---|---|---|---|---|---|---|---|
| A | 81083 | 58925 | 0 | 0 | 0.00% | 0.00% | 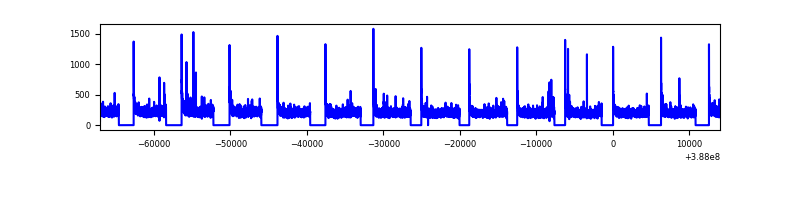 |
| B | 81083 | 58915 | 422 | 422 | 0.52% | 0.72% | 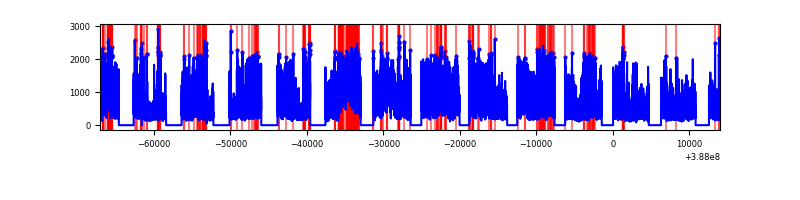 |
| C | 81083 | 58911 | 271 | 271 | 0.33% | 0.46% | 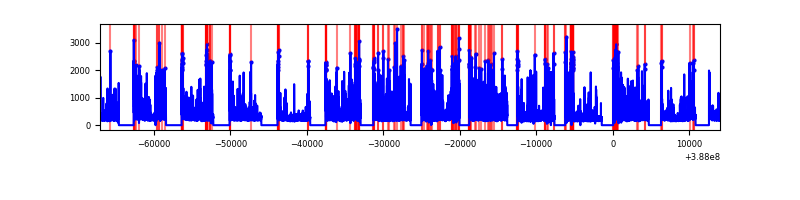 |
| D | 81083 | 58908 | 222 | 222 | 0.27% | 0.38% |  |
Top three noisy pixels from each quadrant. If the there are fewer than three noisy pixels in the level2.evt file, extra rows are filled as -1
| Pixel properties | Quadrant properties | ||||||
|---|---|---|---|---|---|---|---|
| Quadrant | DetID | PixID | Counts | Sigma | Mean | Median | Sigma |
| A | 10 | 83 | 1011463 | 1510.82 | 3023 | 2977 | 667.5 |
| A | 13 | 6 | 120242 | 175.68 | 3023 | 2977 | 667.5 |
| A | 13 | 254 | 81943 | 118.3 | 3023 | 2977 | 667.5 |
| B | 4 | 251 | 26599225 | 45621.98 | 2930 | 2867 | 583.0 |
| B | 5 | 236 | 3558418 | 6099.0 | 2930 | 2867 | 583.0 |
| B | 5 | 172 | 834949 | 1427.31 | 2930 | 2867 | 583.0 |
| C | 4 | 254 | 3993655 | 5943.21 | 2926 | 2902 | 671.5 |
| C | 0 | 10 | 2305061 | 3428.48 | 2926 | 2902 | 671.5 |
| C | 15 | 214 | 2235851 | 3325.41 | 2926 | 2902 | 671.5 |
| D | 1 | 52 | 1665149 | 2382.99 | 2956 | 2865 | 697.6 |
| D | 13 | 249 | 1661588 | 2377.89 | 2956 | 2865 | 697.6 |
| D | 12 | 6 | 1265481 | 1810.04 | 2956 | 2865 | 697.6 |
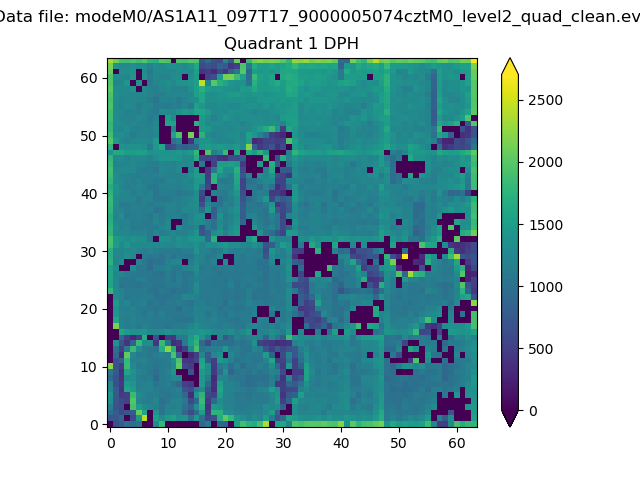
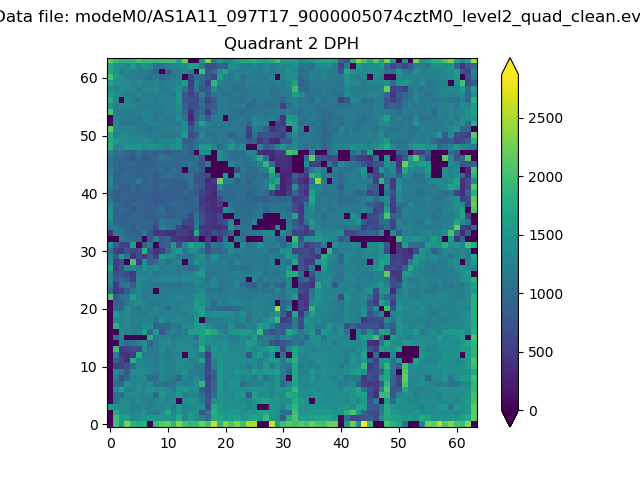
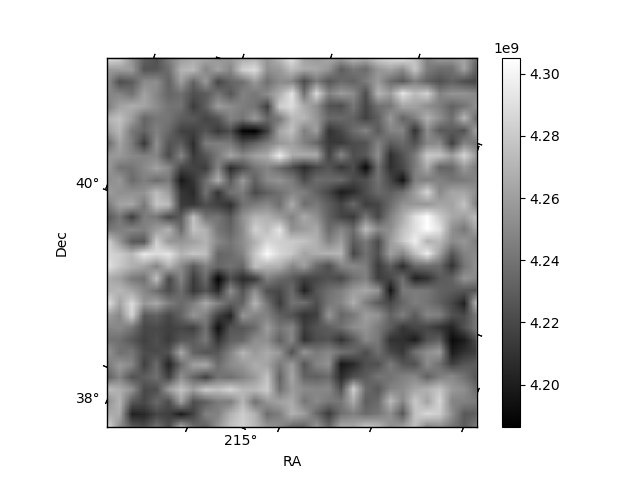
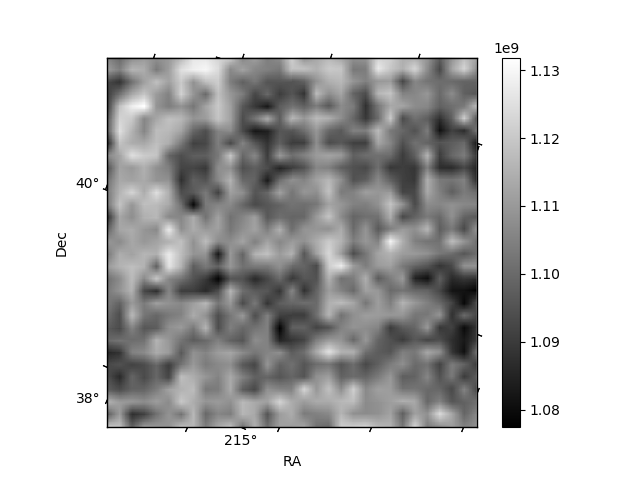
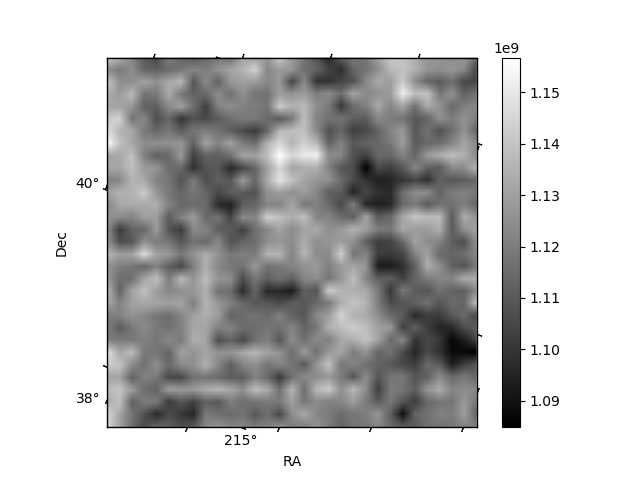
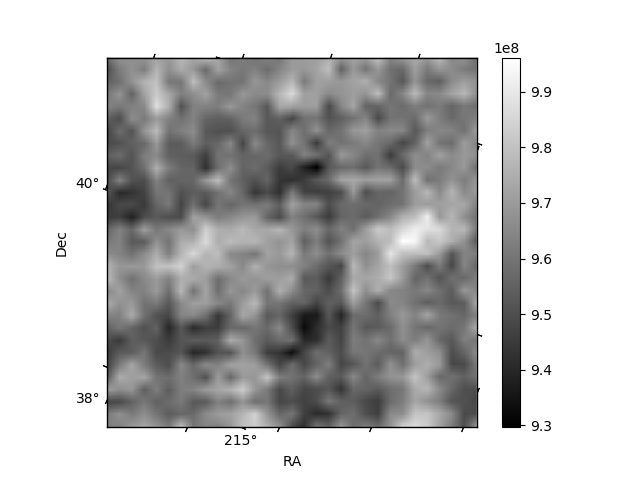
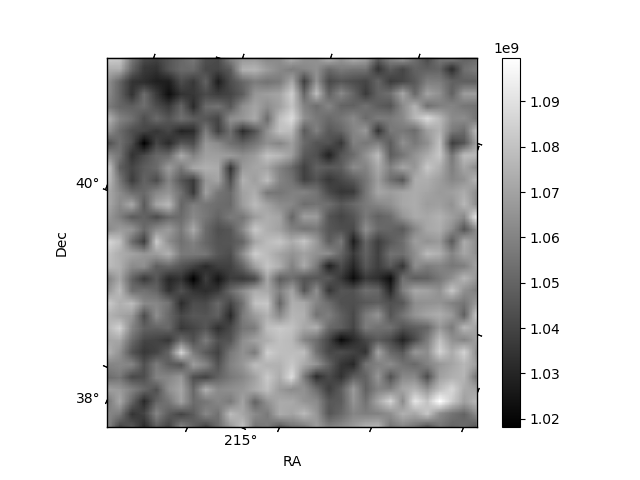
Histogram calculated using DETX and DETY for each event in the final _common_clean file
| Quadrant A | 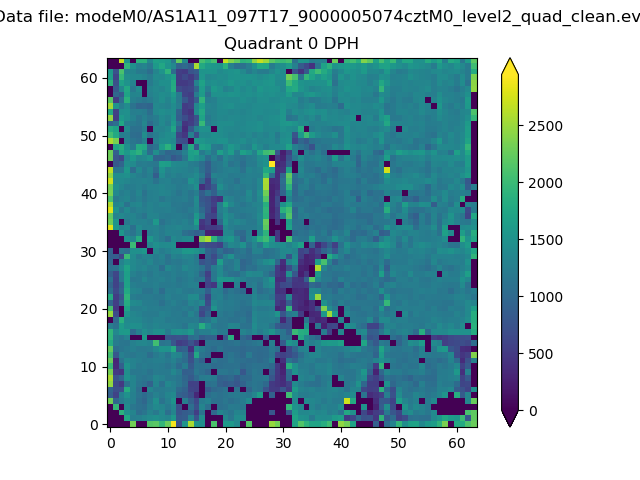 |
 |
Quadrant B |
|---|---|---|---|
| Quadrant D | 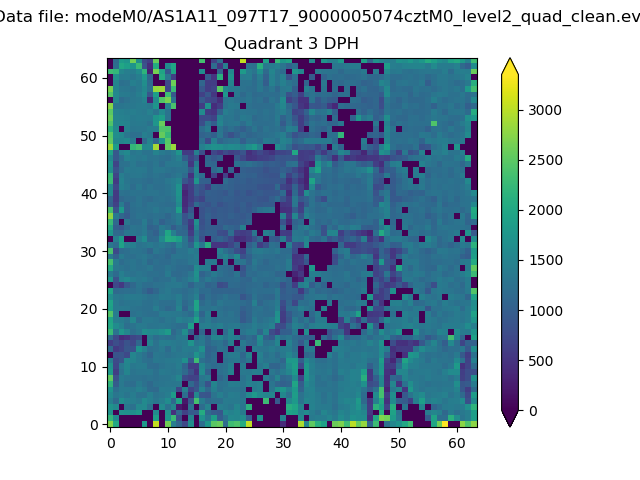 |
 |
Quadrant C |
| Plot type | Count rate plots | Images |
|---|---|---|
| Comparison with Poisson distribution Blue bars denote a histogram of data divided into 1 sec bins. Red curve is a Poisson curve with rate = median count rate of data. |
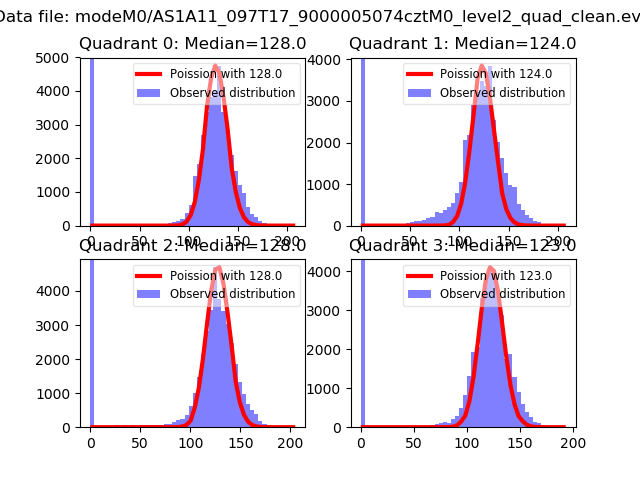 |
 |
| Quadrant-wise count rates Data is divided into 100 sec bins |
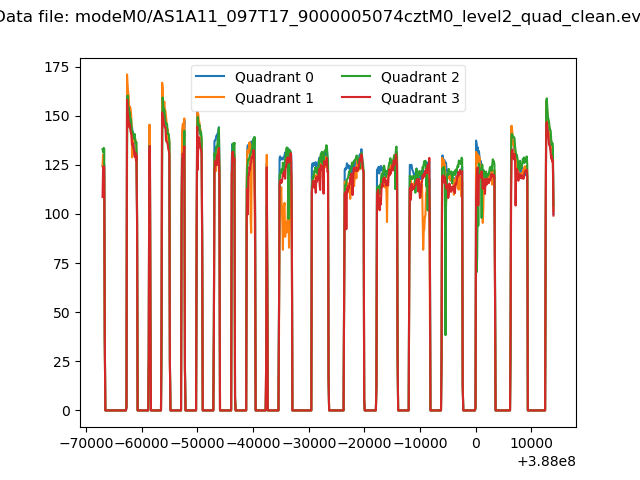 |
|
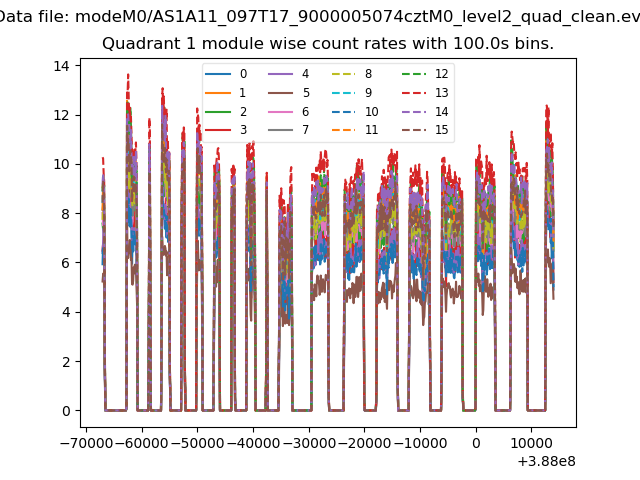
| Module-wise count rates for Quadrant A Data is divided into 100 sec bins |
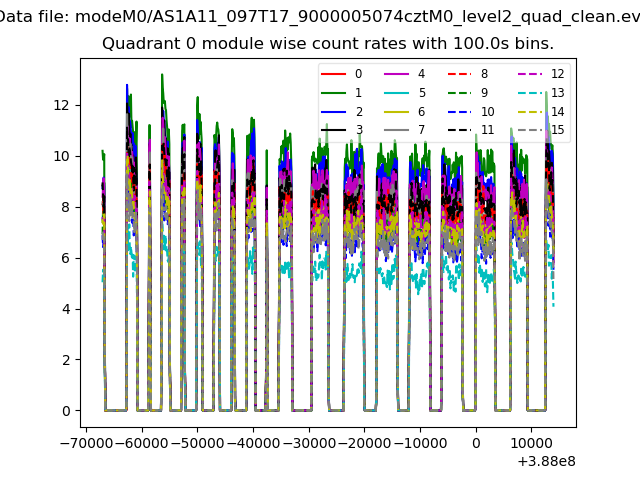 |
 |
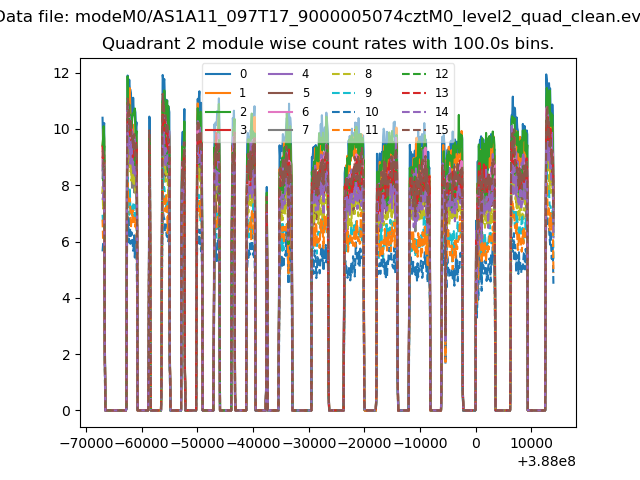
| Module-wise count rates for Quadrant B Data is divided into 100 sec bins |
 |
 |
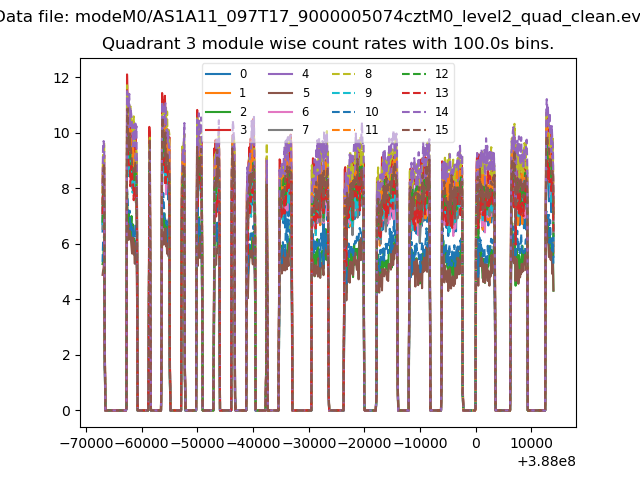
| Module-wise count rates for Quadrant C Data is divided into 100 sec bins |
 |
 |
| Module-wise count rates for Quadrant D Data is divided into 100 sec bins |
 |
 |
| Parameter | Plot |
|---|---|
| CZT HV Monitor | 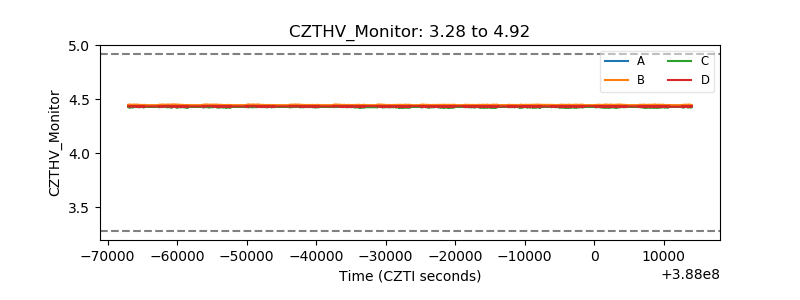 |
| D_VDD | 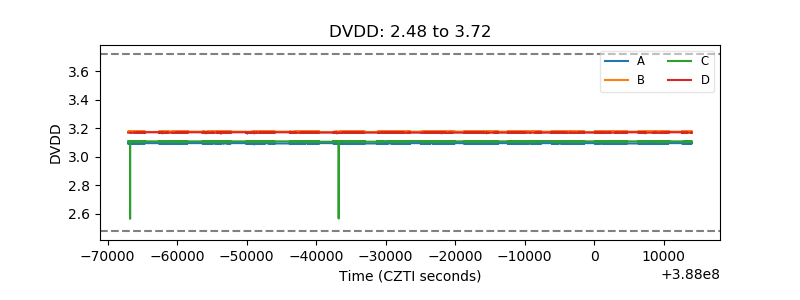 |
| Temperature 1 | 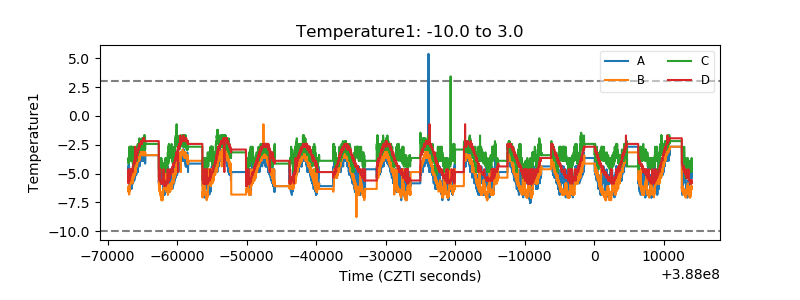 |
| Veto HV Monitor | 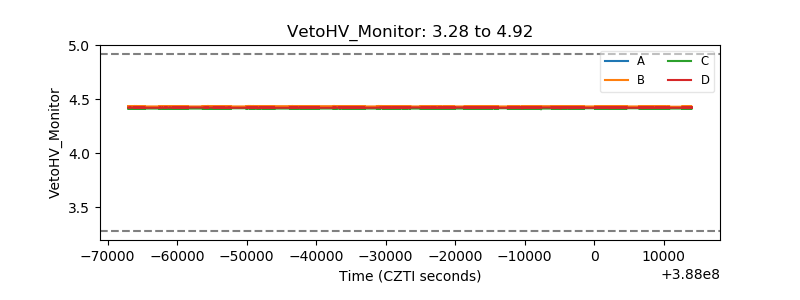 |
| Veto LLD | 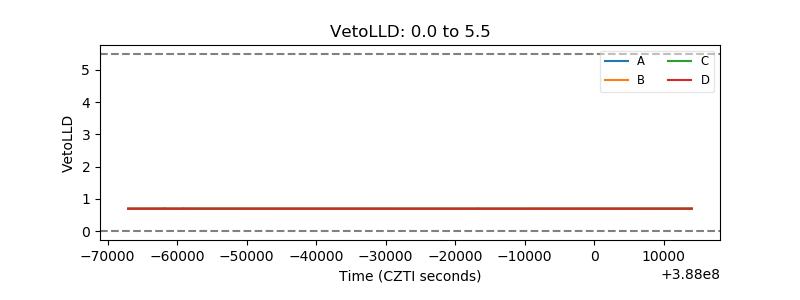 |
| Alpha Counter | 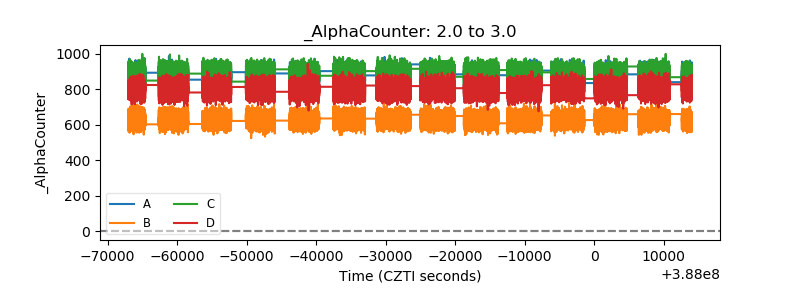 |
| _CPM_Rate | 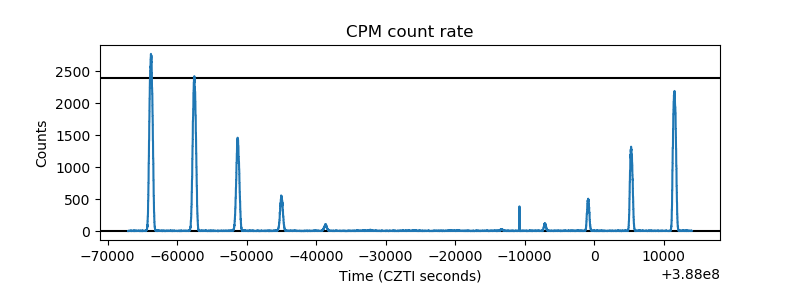 |
| CZT Counter | 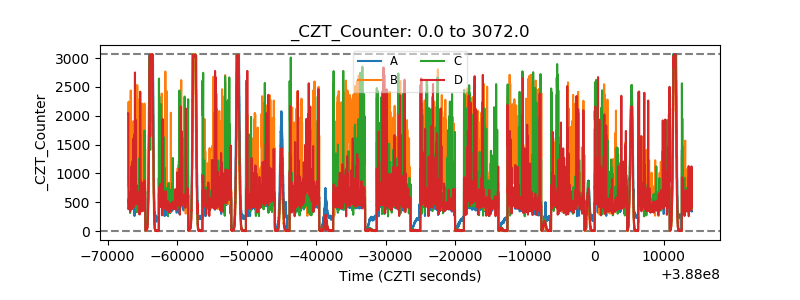 |
| +2.5 Volts monitor | 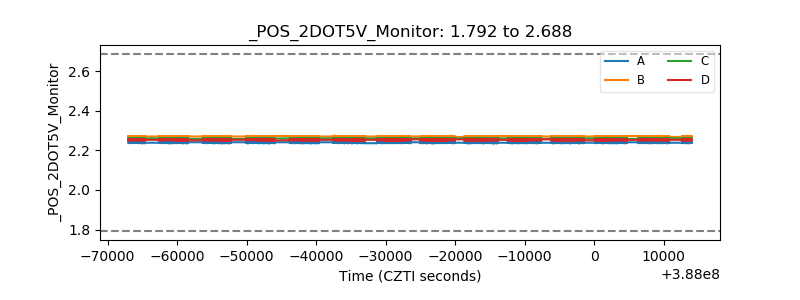 |
| +5 Volts monitor | 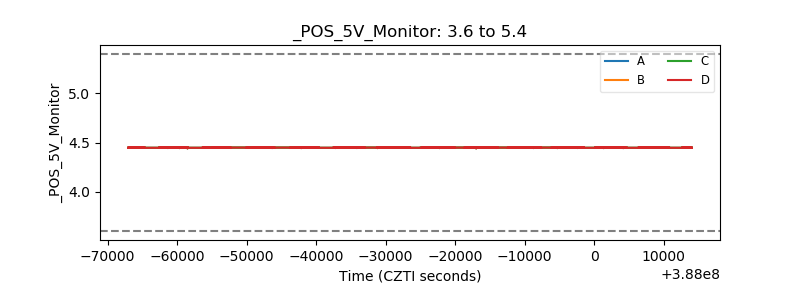 |
| _ROLL_ROT | 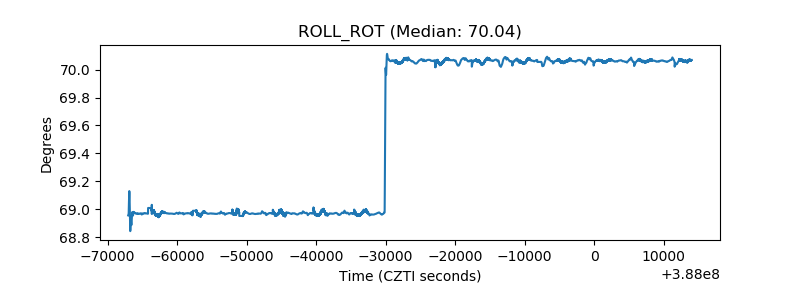 |
| _Roll_DEC | 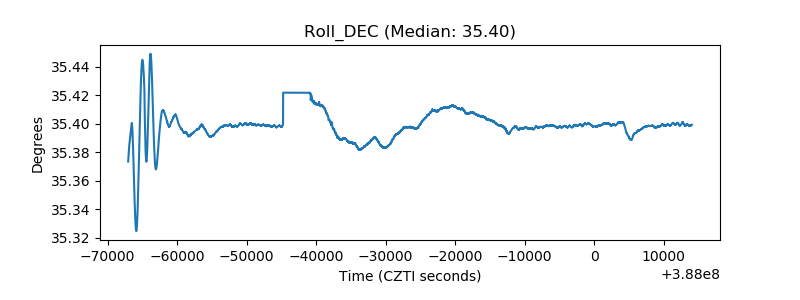 |
| _Roll_RA | 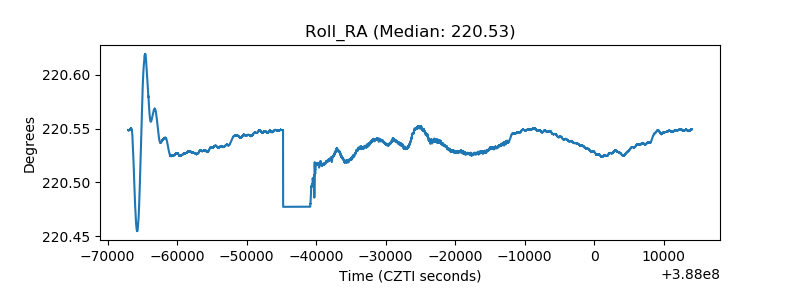 |
| Veto Counter | 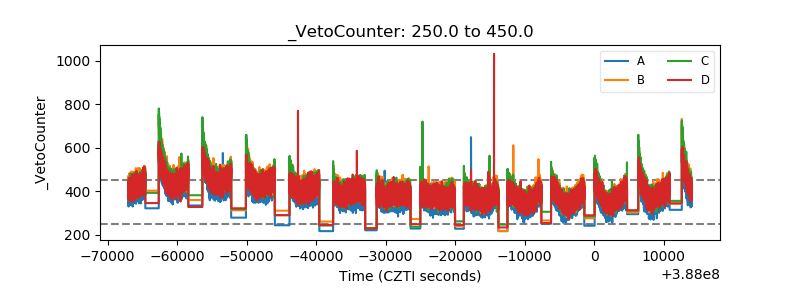 |