| Param | Original file | Final file |
|---|---|---|
| Filename | modeM0/AS1A11_097T07_9000005072_35423cztM0_level2.evt | modeM0/AS1A11_097T07_9000005072_35423cztM0_level2_quad_clean.evt |
| Size (bytes) | 541,054,080 | 48,355,200 |
| Size | 516.0 MB | 46.1 MB |
| Events in quadrant A | 2,477,772 | 301,098 |
| Events in quadrant B | 7,392,987 | 245,732 |
| Events in quadrant C | 2,898,713 | 293,932 |
| Events in quadrant D | 3,281,345 | 275,487 |
| Mode M0 | |||
|---|---|---|---|
| Quadrant | BADHDUFLAG | Total packets | Discarded packets |
| A | 0 | 10210 | 3 |
| B | 0 | 25459 | 2 |
| C | 0 | 11323 | 2 |
| D | 0 | 12892 | 2 |
| Mode M9 | |||
|---|---|---|---|
| Quadrant | BADHDUFLAG | Total packets | Discarded packets |
| A | 0 | 30 | 0 |
| B | 0 | 30 | 0 |
| C | 0 | 30 | 0 |
| D | 0 | 31 | 0 |
| Mode SS | |||
|---|---|---|---|
| Quadrant | BADHDUFLAG | Total packets | Discarded packets |
| A | 0 | 102 | 0 |
| B | 0 | 102 | 0 |
| C | 0 | 102 | 0 |
| D | 0 | 102 | 0 |
| Quadrant | Total seconds | Saturated seconds | Saturation percentage |
|---|---|---|---|
| A | 4943 | 9 | 0.182076% |
| B | 4943 | 1558 | 31.519320% |
| C | 4943 | 138 | 2.791827% |
| D | 4943 | 101 | 2.043294% |
Noise dominated data is calculated using 1-second bins in cleaned event files. If a bin has >2000 counts, and if more than 50% of those come from <1% of pixels, then it is considered to be noise-dominated and hence unusable.
| Quadrant | # 1 sec bins | Bins with >0 counts | Bins with >2000 counts | High rate bins dominated by noise | Noise dominated (total time) | Noise dominated (detector-on time) | Marked lightcurve |
|---|---|---|---|---|---|---|---|
| A | 7035 | 4944 | 0 | 0 | 0.00% | 0.00% | 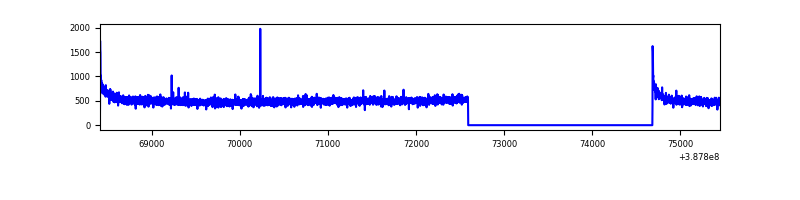 |
| B | 7035 | 4944 | 1175 | 1175 | 16.70% | 23.77% | 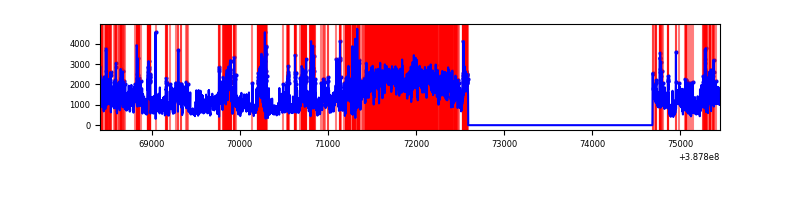 |
| C | 7035 | 4943 | 104 | 104 | 1.48% | 2.10% | 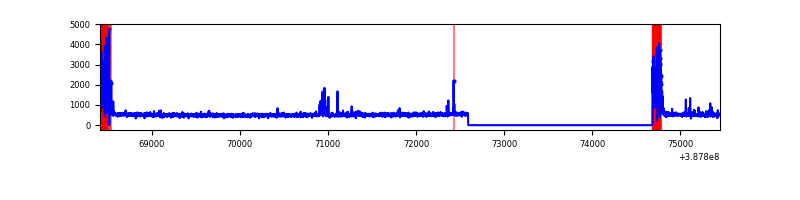 |
| D | 7035 | 4943 | 96 | 96 | 1.36% | 1.94% | 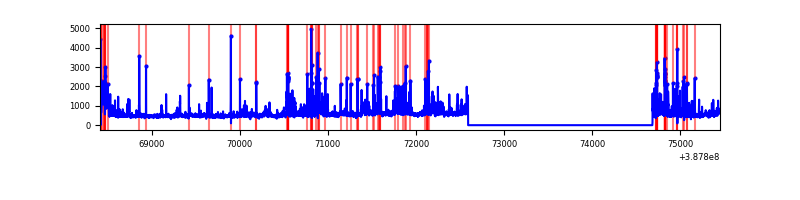 |
Top three noisy pixels from each quadrant. If the there are fewer than three noisy pixels in the level2.evt file, extra rows are filled as -1
| Pixel properties | Quadrant properties | ||||||
|---|---|---|---|---|---|---|---|
| Quadrant | DetID | PixID | Counts | Sigma | Mean | Median | Sigma |
| A | 10 | 83 | 123885 | 1011.25 | 606 | 596 | 121.9 |
| A | 13 | 6 | 12754 | 99.72 | 606 | 596 | 121.9 |
| A | 13 | 254 | 7320 | 55.15 | 606 | 596 | 121.9 |
| B | 4 | 251 | 3099693 | 30083.87 | 541 | 529 | 103.0 |
| B | 5 | 236 | 510722 | 4952.49 | 541 | 529 | 103.0 |
| B | 5 | 31 | 362346 | 3512.19 | 541 | 529 | 103.0 |
| C | 0 | 10 | 374832 | 2782.53 | 576 | 580 | 134.5 |
| C | 15 | 214 | 204506 | 1516.17 | 576 | 580 | 134.5 |
| C | 15 | 208 | 42575 | 312.23 | 576 | 580 | 134.5 |
| D | 13 | 249 | 192430 | 1352.92 | 578 | 563 | 141.8 |
| D | 7 | 80 | 176836 | 1242.96 | 578 | 563 | 141.8 |
| D | 12 | 217 | 161739 | 1136.51 | 578 | 563 | 141.8 |
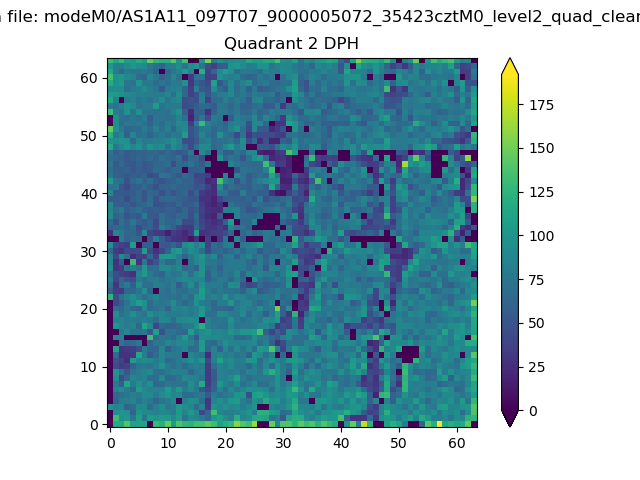
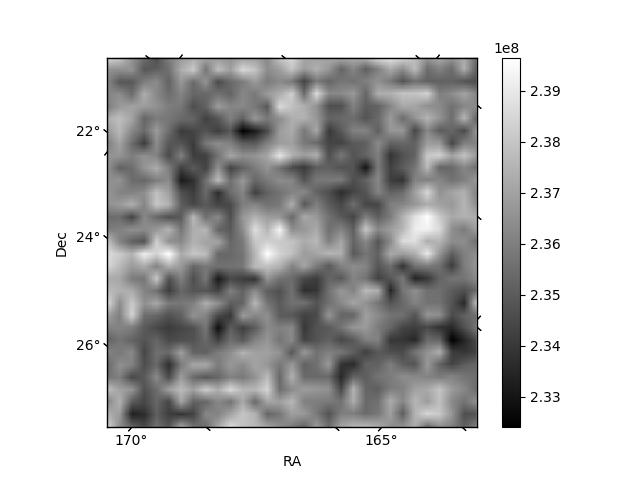
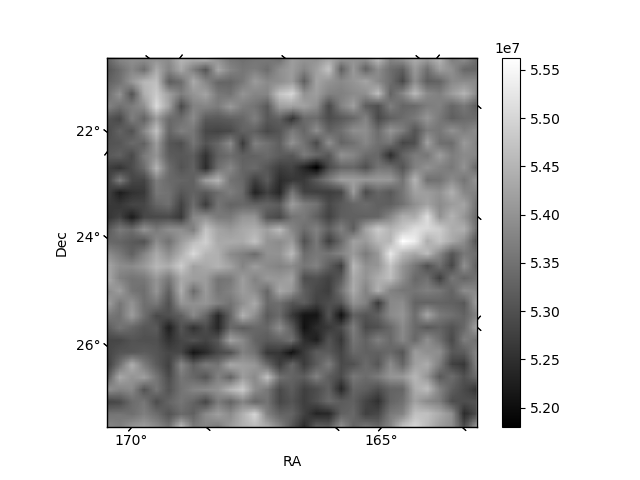
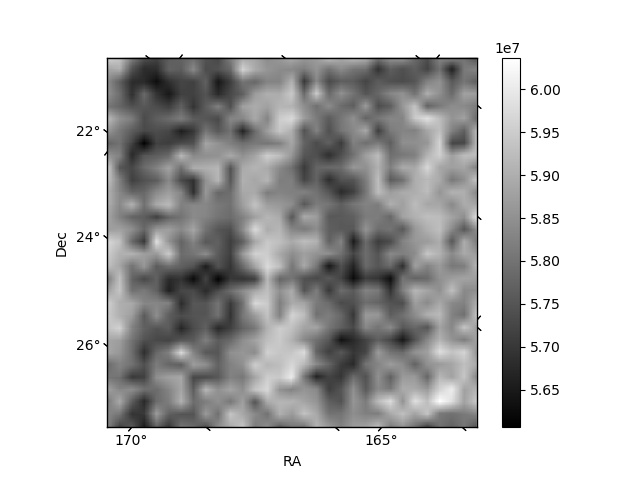
Histogram calculated using DETX and DETY for each event in the final _common_clean file
| Quadrant A | 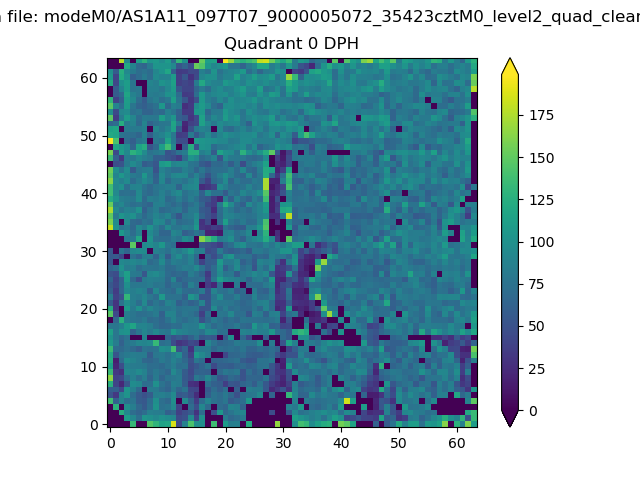 |
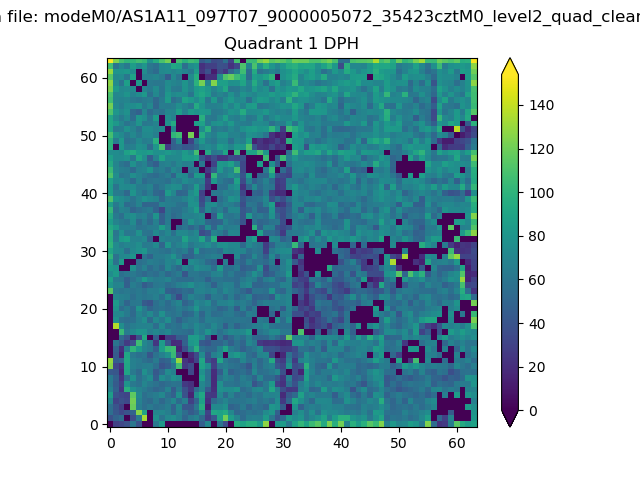 |
Quadrant B |
|---|---|---|---|
| Quadrant D | 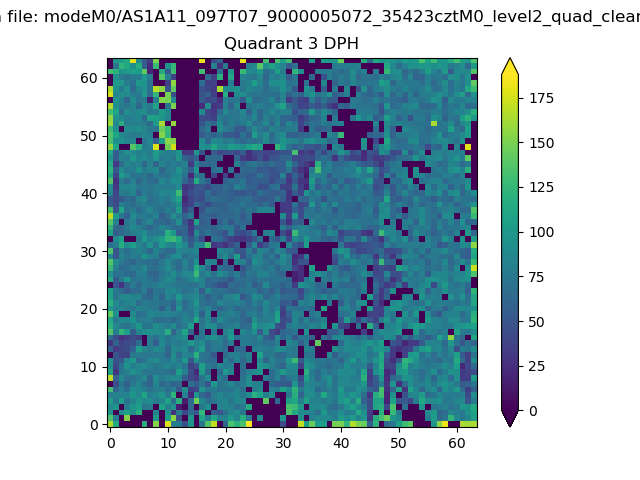 |
 |
Quadrant C |
| Plot type | Count rate plots | Images |
|---|---|---|
| Comparison with Poisson distribution Blue bars denote a histogram of data divided into 1 sec bins. Red curve is a Poisson curve with rate = median count rate of data. |
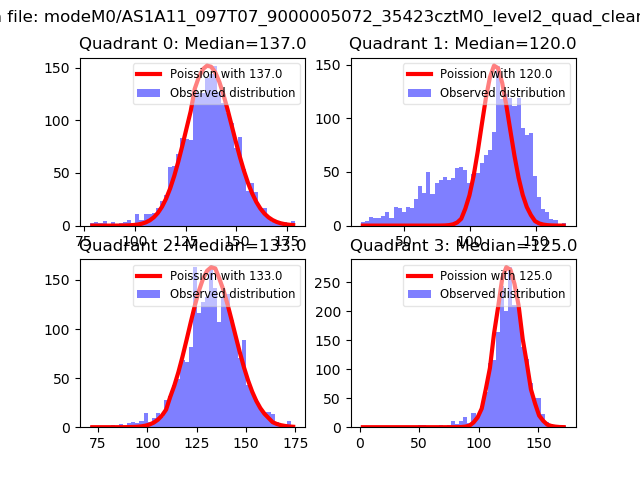 |
 |
| Quadrant-wise count rates Data is divided into 100 sec bins |
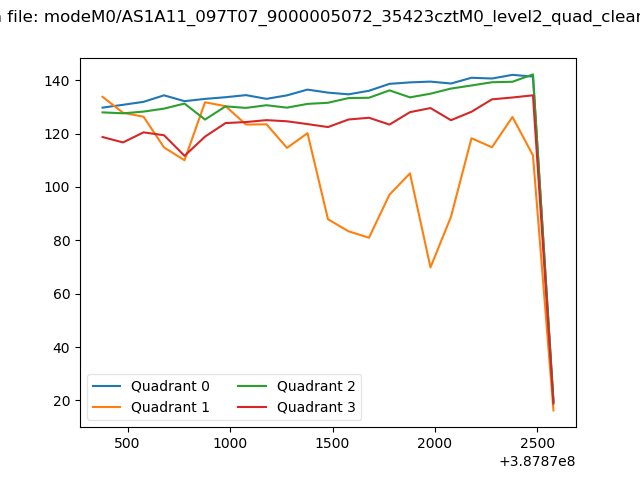 |
|
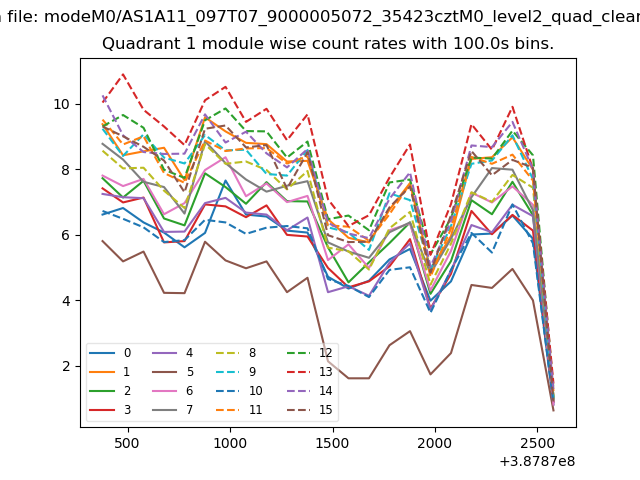
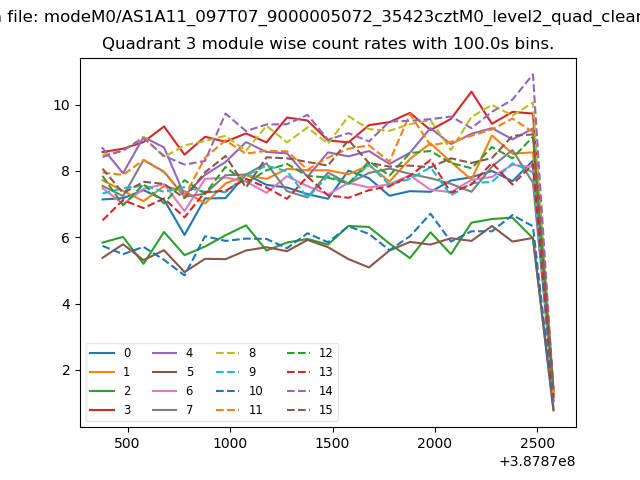
| Module-wise count rates for Quadrant A Data is divided into 100 sec bins |
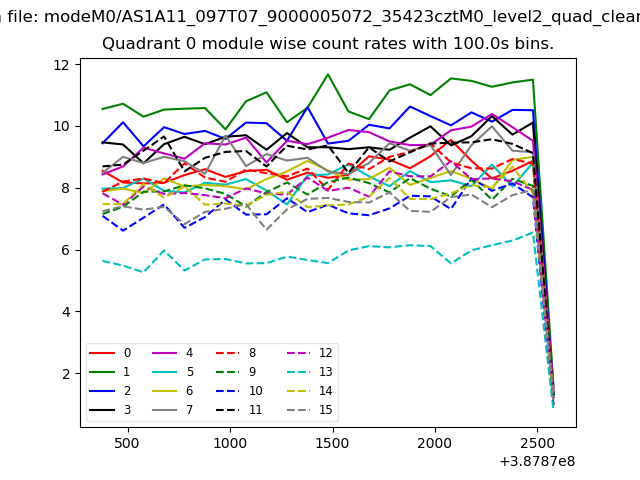 |
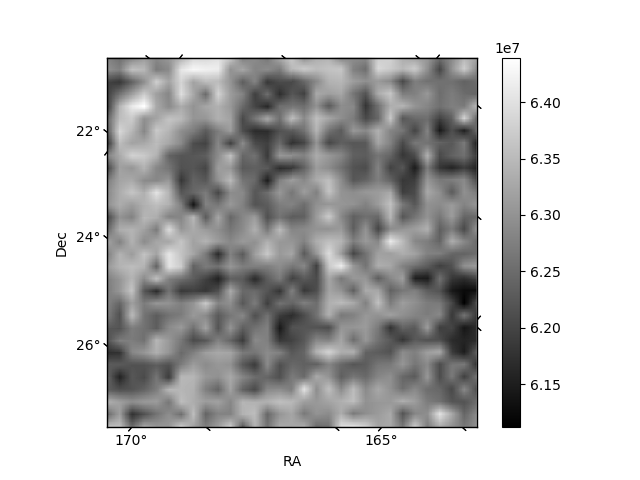 |
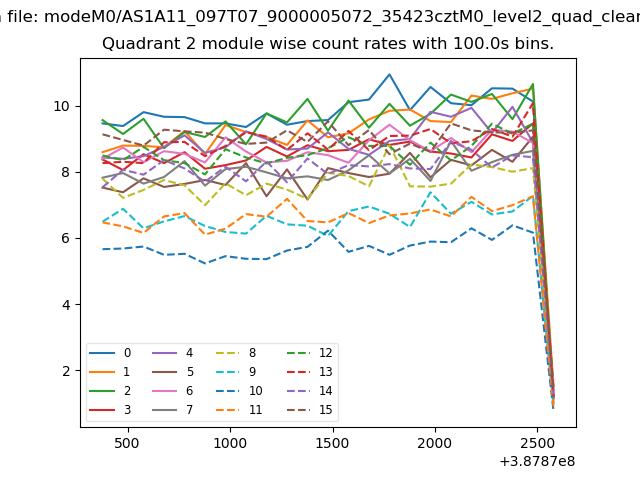
| Module-wise count rates for Quadrant B Data is divided into 100 sec bins |
 |
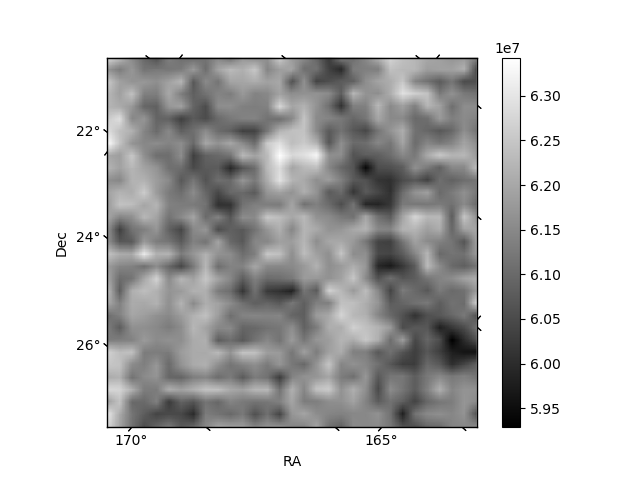 |
| Module-wise count rates for Quadrant C Data is divided into 100 sec bins |
 |
 |
| Module-wise count rates for Quadrant D Data is divided into 100 sec bins |
 |
 |
| Parameter | Plot |
|---|---|
| CZT HV Monitor | 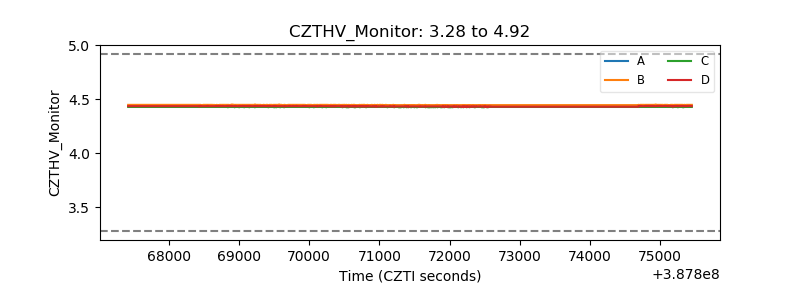 |
| D_VDD | 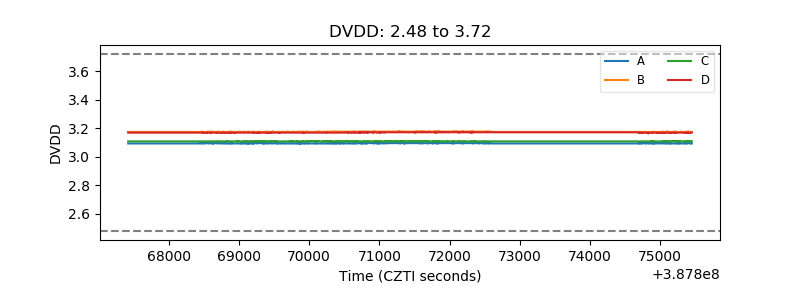 |
| Temperature 1 | 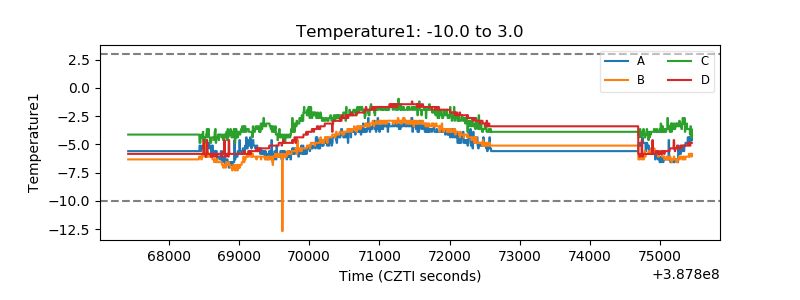 |
| Veto HV Monitor | 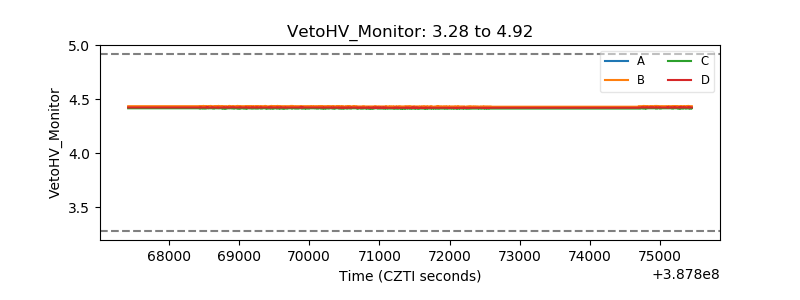 |
| Veto LLD | 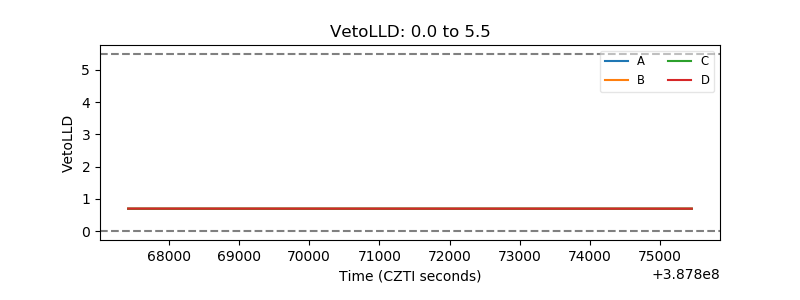 |
| Alpha Counter | 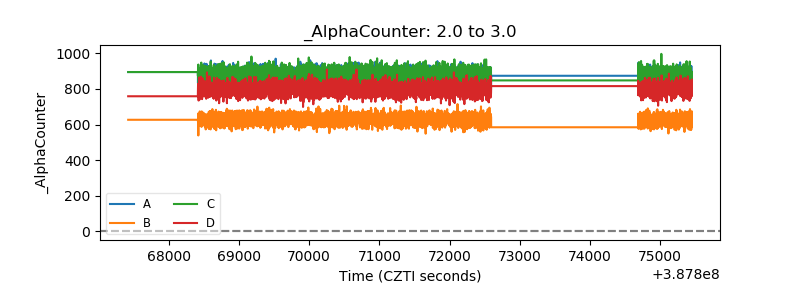 |
| _CPM_Rate | 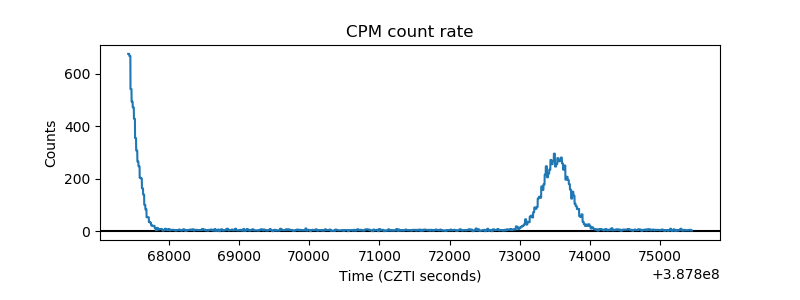 |
| CZT Counter | 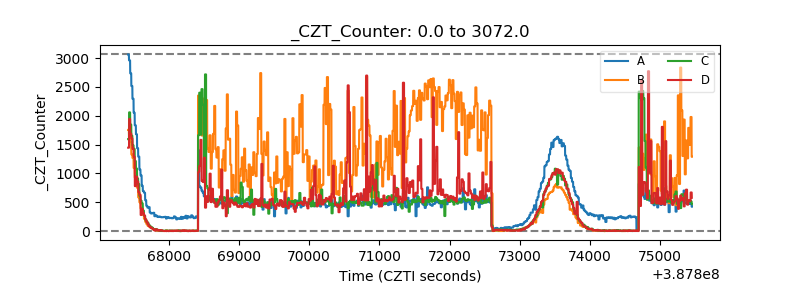 |
| +2.5 Volts monitor | 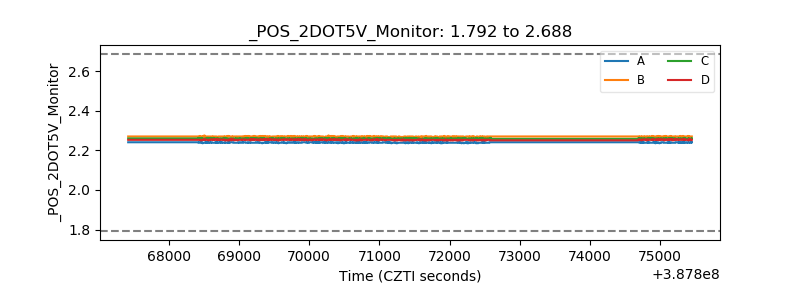 |
| +5 Volts monitor | 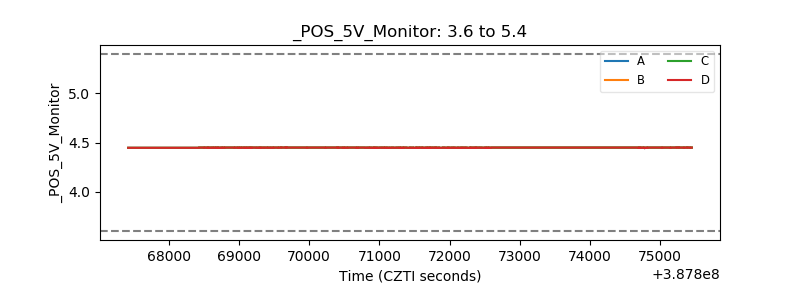 |
| _ROLL_ROT | 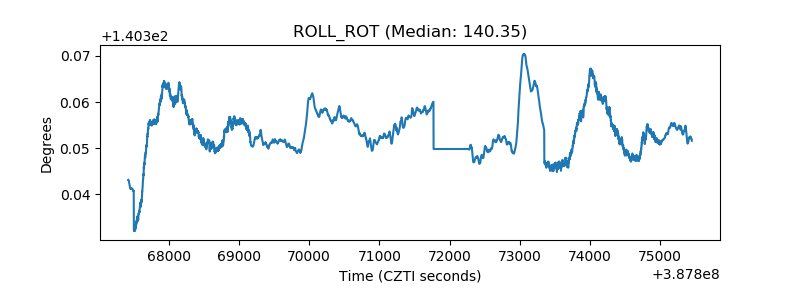 |
| _Roll_DEC | 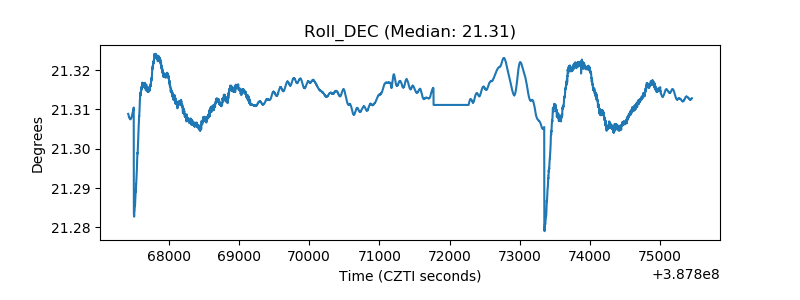 |
| _Roll_RA | 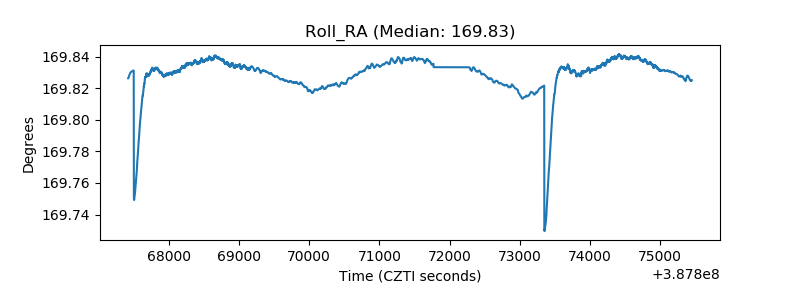 |
| Veto Counter | 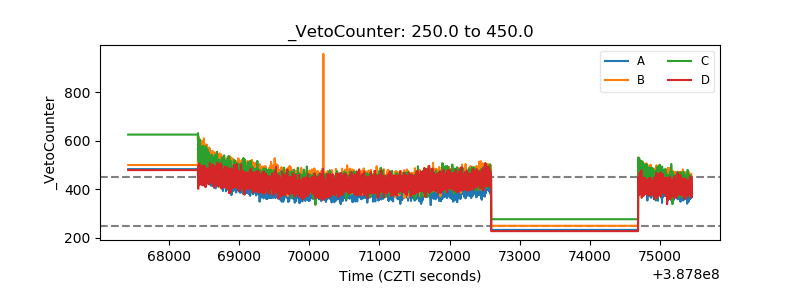 |