| Param | Original file | Final file |
|---|---|---|
| Filename | modeM0/AS1T05_022T01_9000005070_35416cztM0_level2.evt | modeM0/AS1T05_022T01_9000005070_35416cztM0_level2_quad_clean.evt |
| Size (bytes) | 550,926,720 | 84,836,160 |
| Size | 525.4 MB | 80.9 MB |
| Events in quadrant A | 2,679,462 | 573,984 |
| Events in quadrant B | 5,980,567 | 522,284 |
| Events in quadrant C | 3,405,830 | 562,024 |
| Events in quadrant D | 4,240,978 | 520,427 |
| Mode M0 | |||
|---|---|---|---|
| Quadrant | BADHDUFLAG | Total packets | Discarded packets |
| A | 0 | 11581 | 3 |
| B | 0 | 21569 | 2 |
| C | 0 | 13479 | 2 |
| D | 0 | 16343 | 2 |
| Mode SS | |||
|---|---|---|---|
| Quadrant | BADHDUFLAG | Total packets | Discarded packets |
| A | 0 | 116 | 0 |
| B | 0 | 116 | 0 |
| C | 0 | 116 | 0 |
| D | 0 | 116 | 0 |
| Mode M9 | |||
|---|---|---|---|
| Quadrant | BADHDUFLAG | Total packets | Discarded packets |
| A | 0 | 31 | 0 |
| B | 0 | 31 | 0 |
| C | 0 | 31 | 0 |
| D | 0 | 31 | 0 |
| Quadrant | Total seconds | Saturated seconds | Saturation percentage |
|---|---|---|---|
| A | 5572 | 13 | 0.233309% |
| B | 5572 | 1247 | 22.379756% |
| C | 5572 | 180 | 3.230438% |
| D | 5572 | 375 | 6.730079% |
Noise dominated data is calculated using 1-second bins in cleaned event files. If a bin has >2000 counts, and if more than 50% of those come from <1% of pixels, then it is considered to be noise-dominated and hence unusable.
| Quadrant | # 1 sec bins | Bins with >0 counts | Bins with >2000 counts | High rate bins dominated by noise | Noise dominated (total time) | Noise dominated (detector-on time) | Marked lightcurve |
|---|---|---|---|---|---|---|---|
| A | 8678 | 5574 | 1 | 1 | 0.01% | 0.02% | 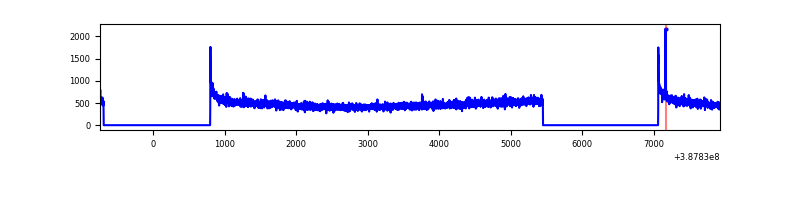 |
| B | 8678 | 5574 | 923 | 923 | 10.64% | 16.56% | 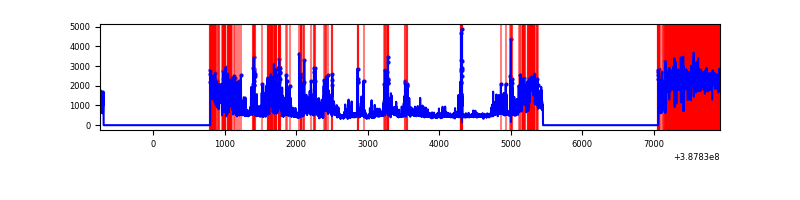 |
| C | 8678 | 5574 | 141 | 141 | 1.62% | 2.53% | 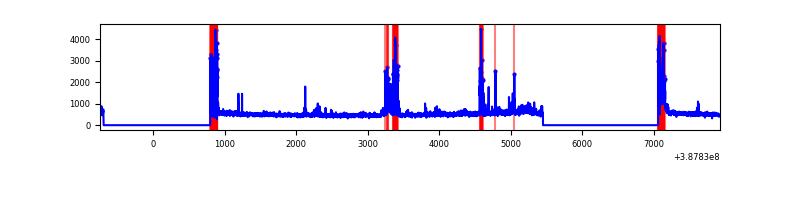 |
| D | 8678 | 5574 | 271 | 271 | 3.12% | 4.86% | 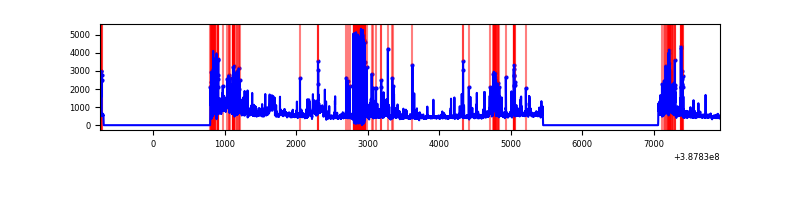 |
Top three noisy pixels from each quadrant. If the there are fewer than three noisy pixels in the level2.evt file, extra rows are filled as -1
| Pixel properties | Quadrant properties | ||||||
|---|---|---|---|---|---|---|---|
| Quadrant | DetID | PixID | Counts | Sigma | Mean | Median | Sigma |
| A | 10 | 83 | 131362 | 992.44 | 652 | 640 | 131.7 |
| A | 13 | 6 | 18302 | 134.09 | 652 | 640 | 131.7 |
| A | 9 | 143 | 8575 | 60.24 | 652 | 640 | 131.7 |
| B | 4 | 251 | 788481 | 6838.34 | 598 | 584 | 115.2 |
| B | 5 | 236 | 745932 | 6469.05 | 598 | 584 | 115.2 |
| B | 5 | 31 | 555605 | 4817.16 | 598 | 584 | 115.2 |
| C | 0 | 10 | 452190 | 3049.95 | 632 | 636 | 148.1 |
| C | 15 | 214 | 224358 | 1511.1 | 632 | 636 | 148.1 |
| C | 9 | 69 | 186892 | 1258.04 | 632 | 636 | 148.1 |
| D | 7 | 80 | 408320 | 2726.41 | 612 | 596 | 149.5 |
| D | 13 | 249 | 286553 | 1912.17 | 612 | 596 | 149.5 |
| D | 8 | 195 | 230192 | 1535.29 | 612 | 596 | 149.5 |
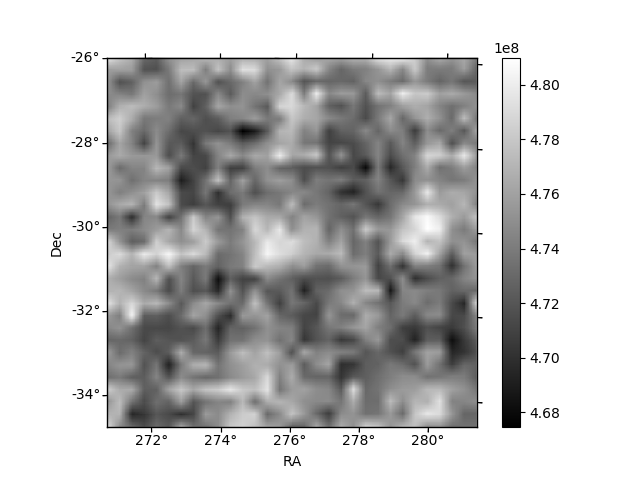
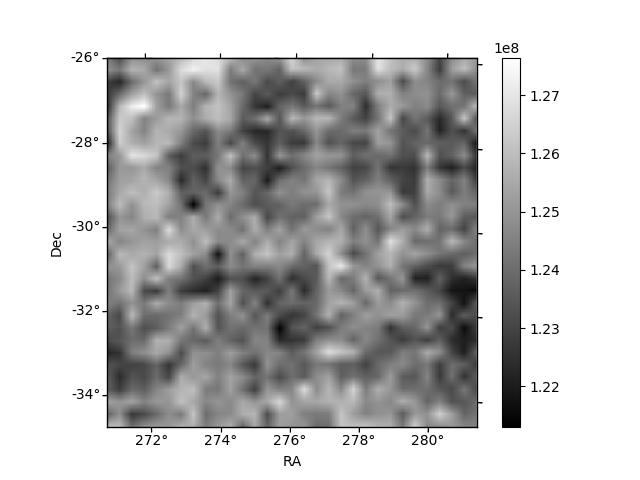
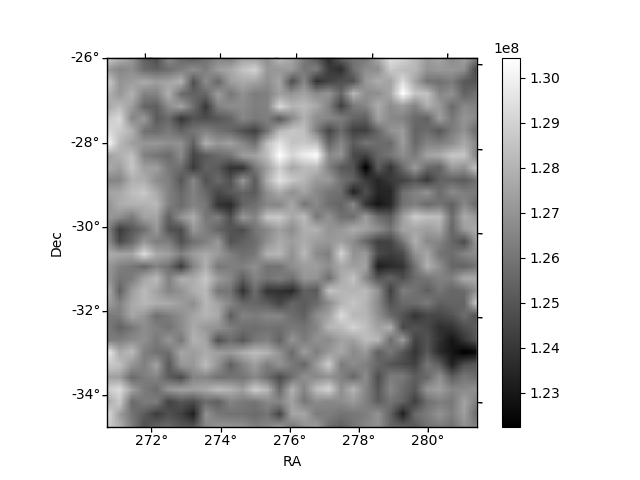
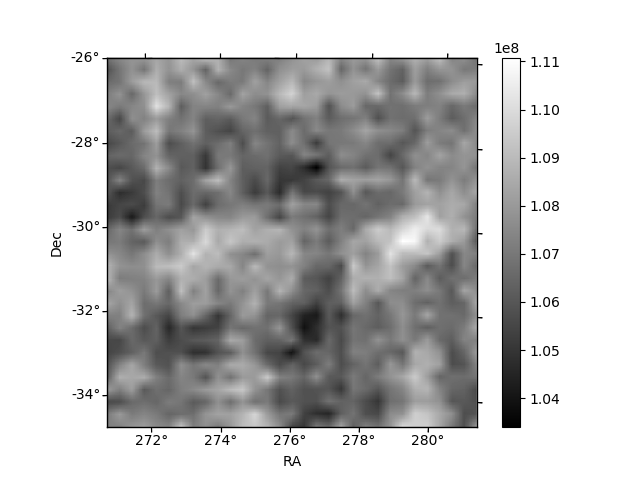
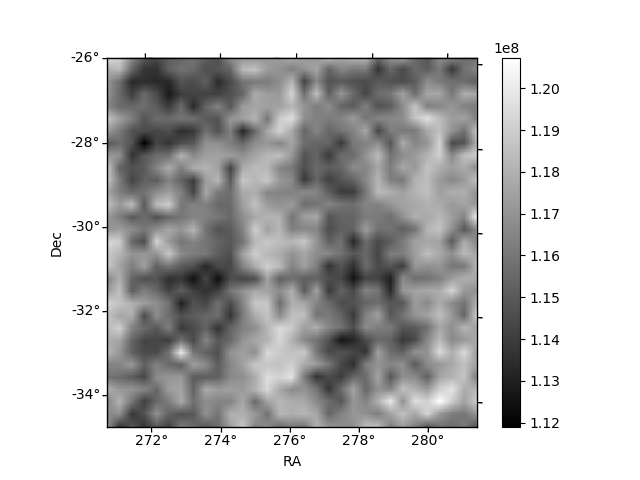
Histogram calculated using DETX and DETY for each event in the final _common_clean file
| Quadrant A | 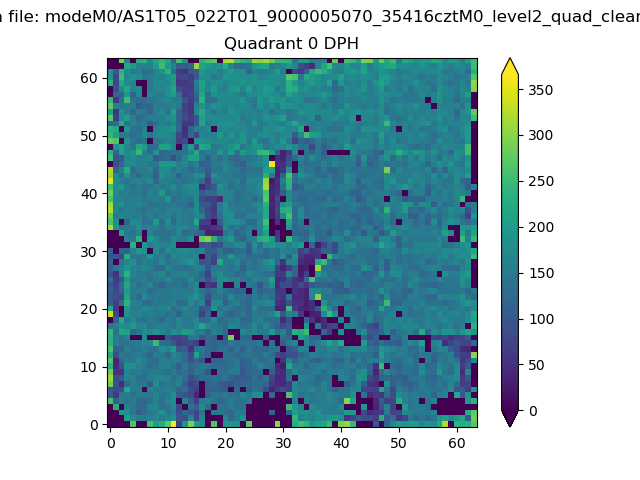 |
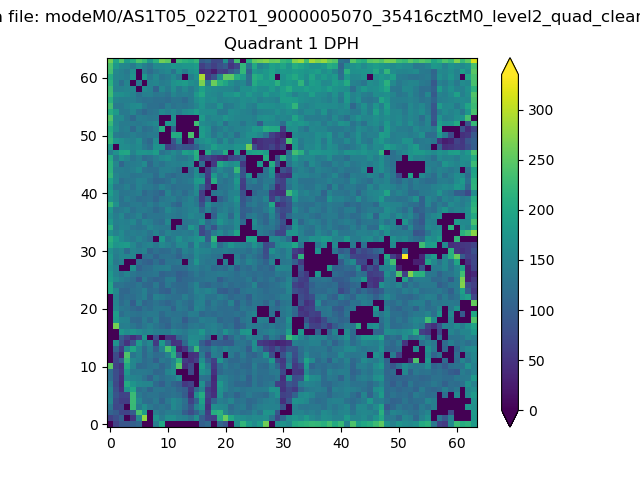 |
Quadrant B |
|---|---|---|---|
| Quadrant D | 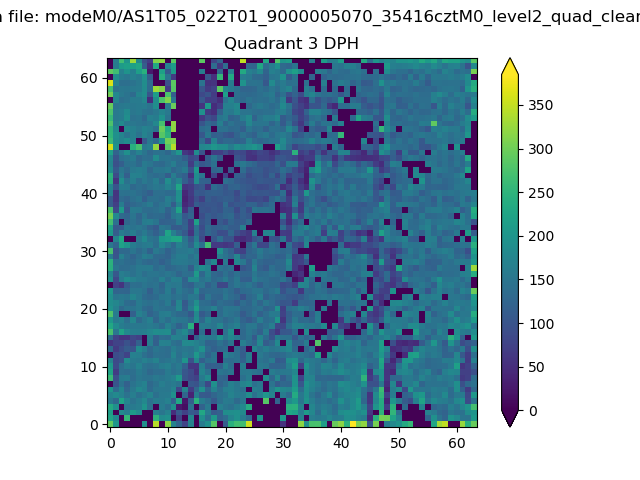 |
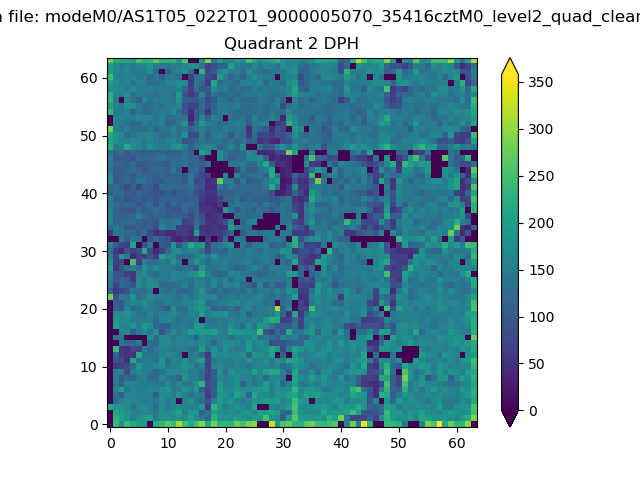 |
Quadrant C |
| Plot type | Count rate plots | Images |
|---|---|---|
| Comparison with Poisson distribution Blue bars denote a histogram of data divided into 1 sec bins. Red curve is a Poisson curve with rate = median count rate of data. |
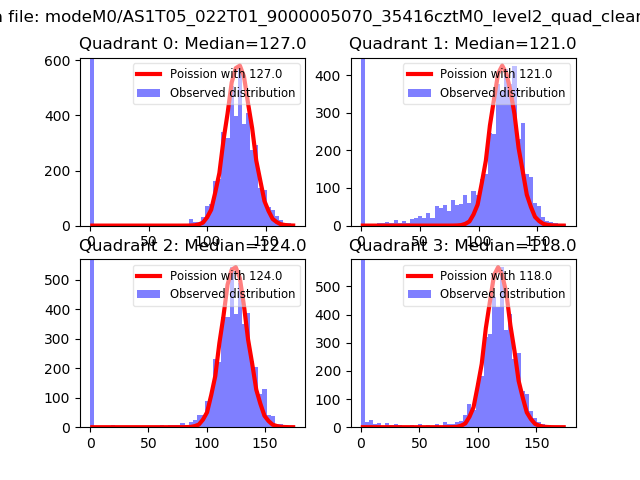 |
 |
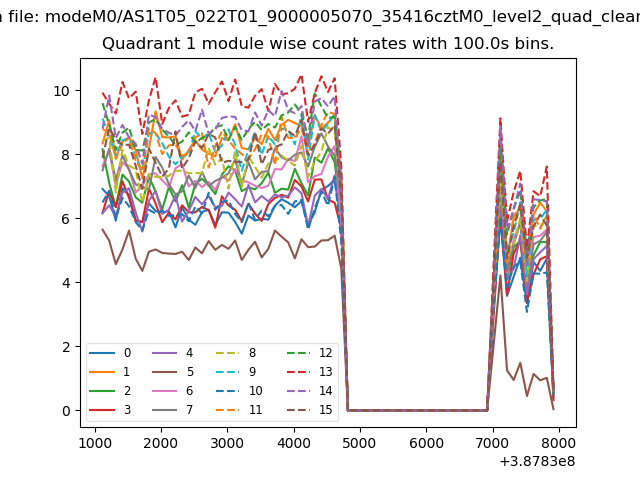
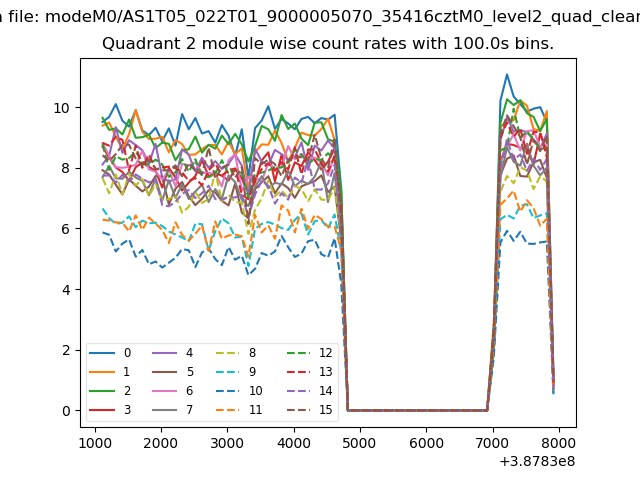
| Quadrant-wise count rates Data is divided into 100 sec bins |
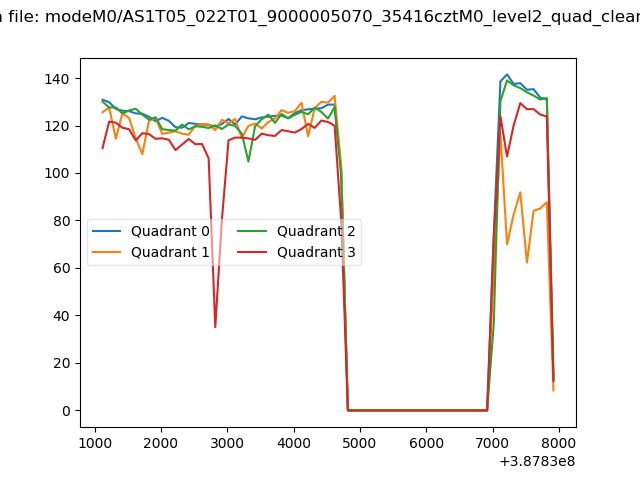 |
|
| Module-wise count rates for Quadrant A Data is divided into 100 sec bins |
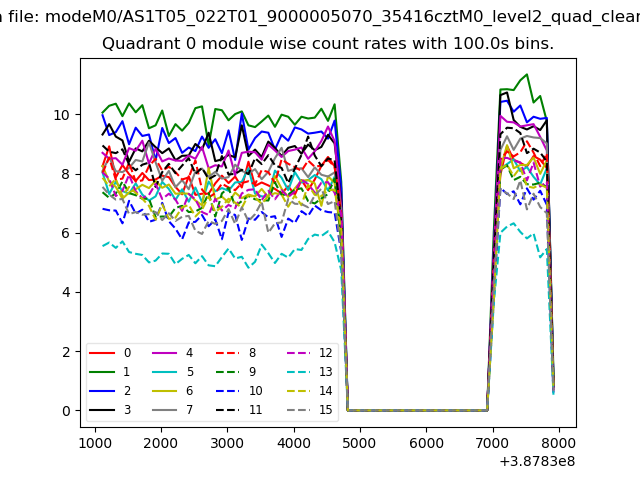 |
 |
| Module-wise count rates for Quadrant B Data is divided into 100 sec bins |
 |
 |
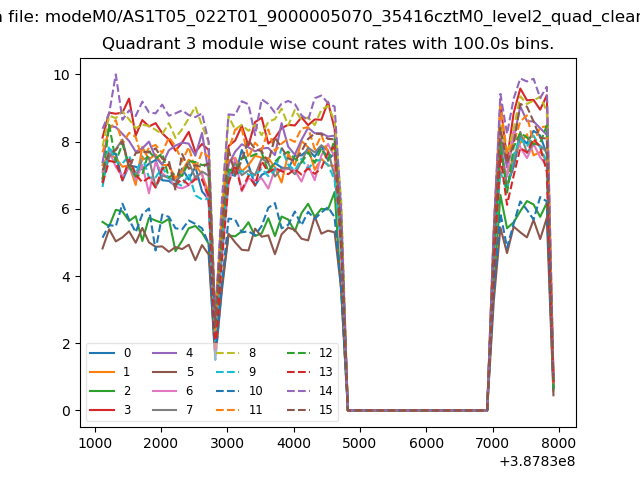
| Module-wise count rates for Quadrant C Data is divided into 100 sec bins |
 |
 |
| Module-wise count rates for Quadrant D Data is divided into 100 sec bins |
 |
 |
| Parameter | Plot |
|---|---|
| CZT HV Monitor | 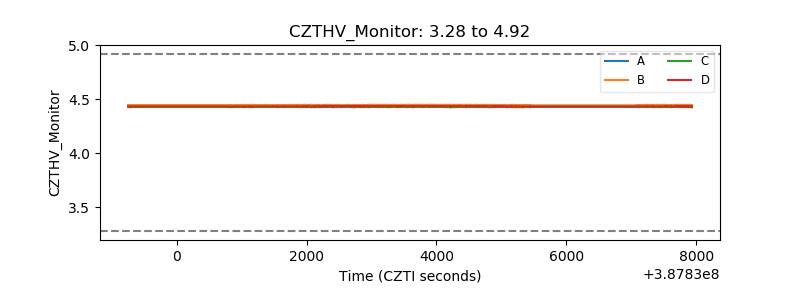 |
| D_VDD | 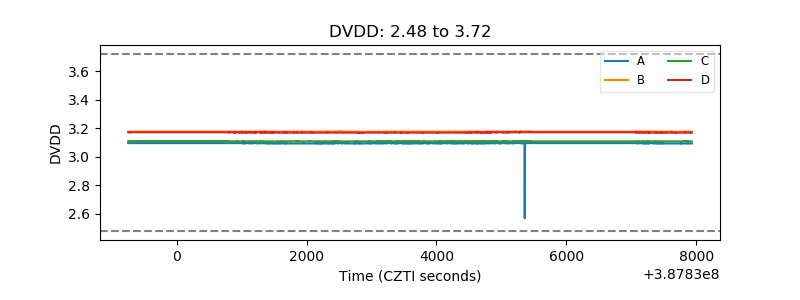 |
| Temperature 1 | 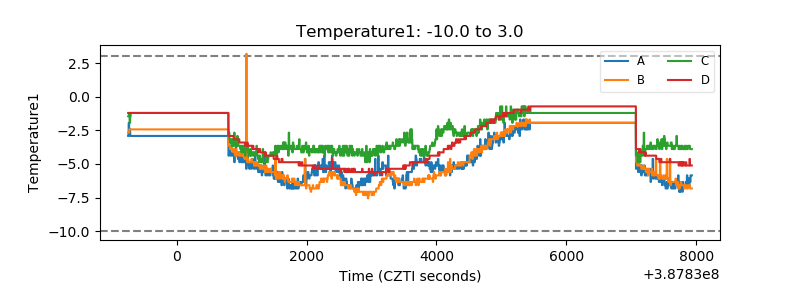 |
| Veto HV Monitor | 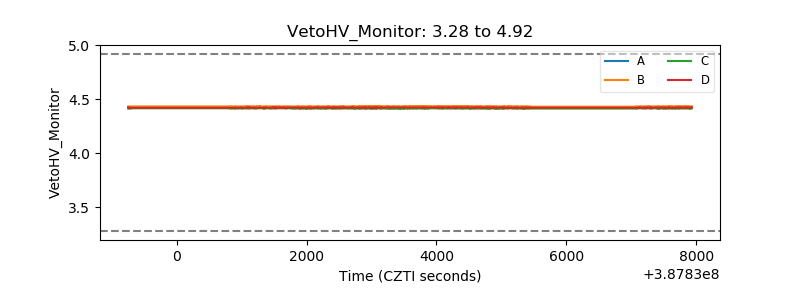 |
| Veto LLD | 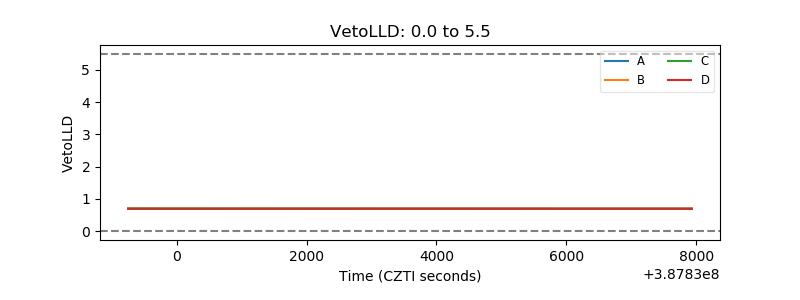 |
| Alpha Counter | 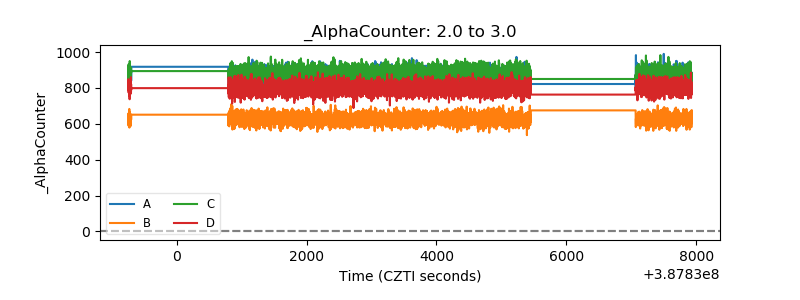 |
| _CPM_Rate | 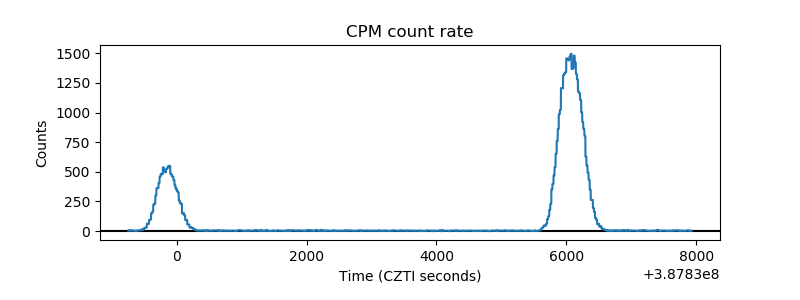 |
| CZT Counter | 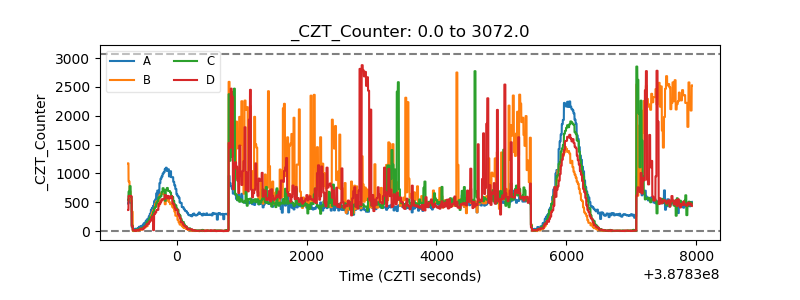 |
| +2.5 Volts monitor | 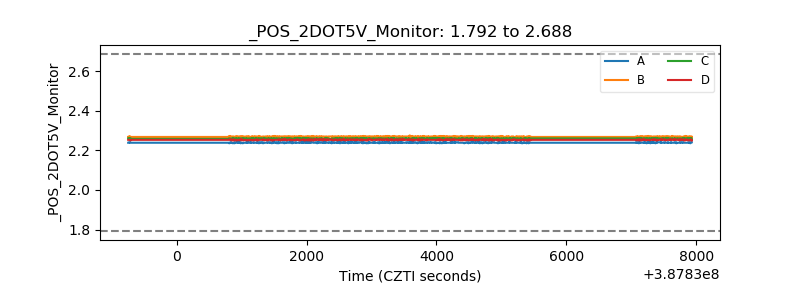 |
| +5 Volts monitor | 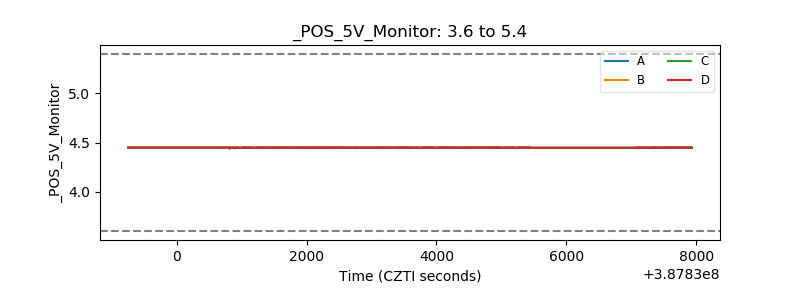 |
| _ROLL_ROT | 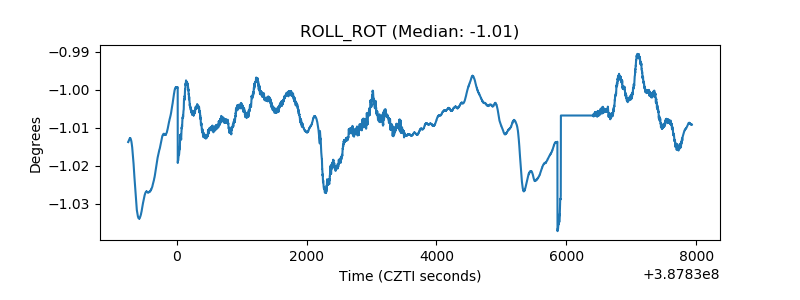 |
| _Roll_DEC | 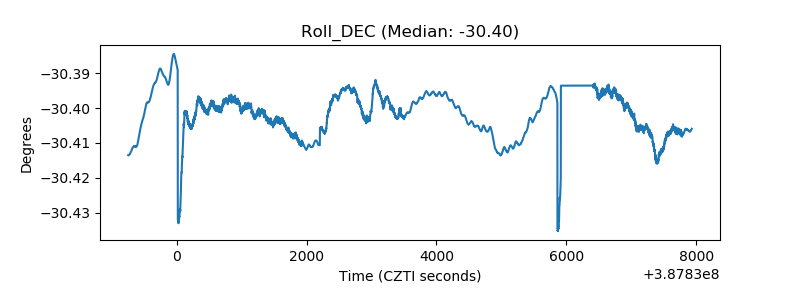 |
| _Roll_RA | 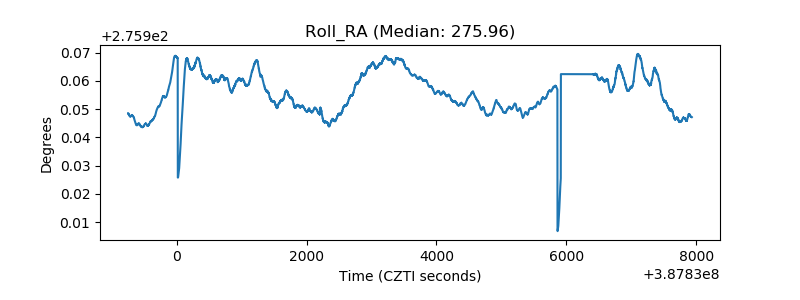 |
| Veto Counter | 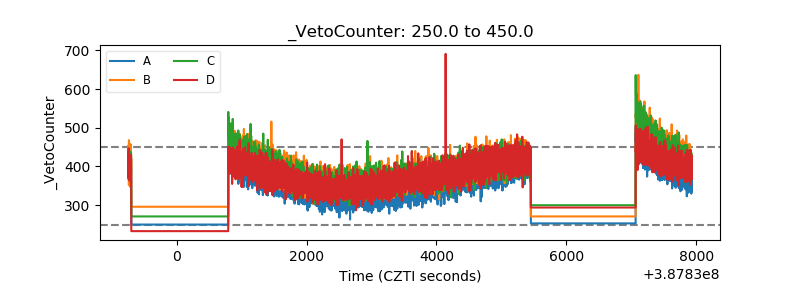 |