| Param | Original file | Final file |
|---|---|---|
| Filename | modeM0/AS1T05_022T01_9000005070_35408cztM0_level2.evt | modeM0/AS1T05_022T01_9000005070_35408cztM0_level2_quad_clean.evt |
| Size (bytes) | 704,197,440 | 58,665,600 |
| Size | 671.6 MB | 55.9 MB |
| Events in quadrant A | 2,555,048 | 396,691 |
| Events in quadrant B | 10,299,207 | 281,800 |
| Events in quadrant C | 3,325,907 | 392,500 |
| Events in quadrant D | 4,809,894 | 355,232 |
| Mode M0 | |||
|---|---|---|---|
| Quadrant | BADHDUFLAG | Total packets | Discarded packets |
| A | 0 | 10443 | 3 |
| B | 0 | 33948 | 2 |
| C | 0 | 12788 | 2 |
| D | 0 | 17693 | 2 |
| Mode SS | |||
|---|---|---|---|
| Quadrant | BADHDUFLAG | Total packets | Discarded packets |
| A | 0 | 102 | 0 |
| B | 0 | 102 | 0 |
| C | 0 | 102 | 0 |
| D | 0 | 102 | 0 |
| Mode M9 | |||
|---|---|---|---|
| Quadrant | BADHDUFLAG | Total packets | Discarded packets |
| A | 0 | 31 | 0 |
| B | 0 | 31 | 0 |
| C | 0 | 31 | 0 |
| D | 0 | 32 | 0 |
| Quadrant | Total seconds | Saturated seconds | Saturation percentage |
|---|---|---|---|
| A | 4976 | 10 | 0.200965% |
| B | 4976 | 3712 | 74.598071% |
| C | 4976 | 123 | 2.471865% |
| D | 4976 | 733 | 14.730707% |
Noise dominated data is calculated using 1-second bins in cleaned event files. If a bin has >2000 counts, and if more than 50% of those come from <1% of pixels, then it is considered to be noise-dominated and hence unusable.
| Quadrant | # 1 sec bins | Bins with >0 counts | Bins with >2000 counts | High rate bins dominated by noise | Noise dominated (total time) | Noise dominated (detector-on time) | Marked lightcurve |
|---|---|---|---|---|---|---|---|
| A | 7098 | 4977 | 1 | 1 | 0.01% | 0.02% | 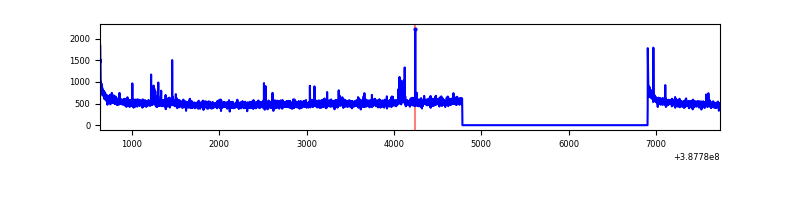 |
| B | 7098 | 4977 | 3145 | 3145 | 44.31% | 63.19% | 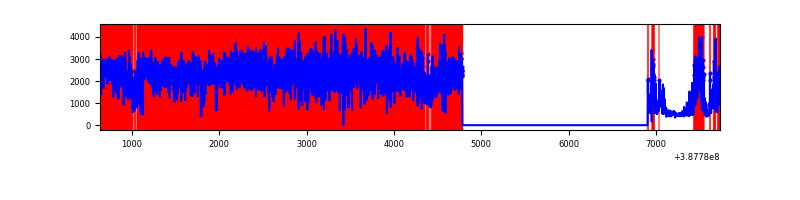 |
| C | 7098 | 4977 | 98 | 98 | 1.38% | 1.97% | 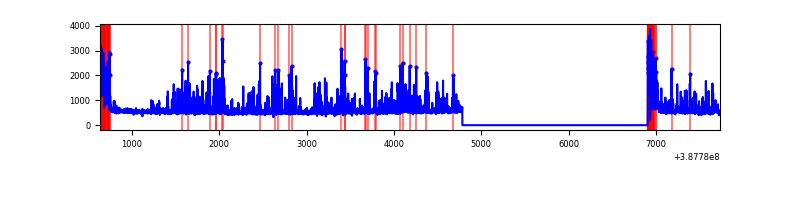 |
| D | 7097 | 4976 | 589 | 589 | 8.30% | 11.84% | 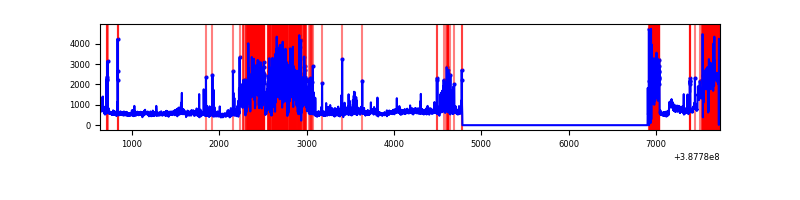 |
Top three noisy pixels from each quadrant. If the there are fewer than three noisy pixels in the level2.evt file, extra rows are filled as -1
| Pixel properties | Quadrant properties | ||||||
|---|---|---|---|---|---|---|---|
| Quadrant | DetID | PixID | Counts | Sigma | Mean | Median | Sigma |
| A | 10 | 83 | 125157 | 1009.89 | 614 | 603 | 123.3 |
| A | 9 | 143 | 18314 | 143.6 | 614 | 603 | 123.3 |
| A | 7 | 3 | 18137 | 142.17 | 614 | 603 | 123.3 |
| B | 4 | 251 | 7410025 | 97457.56 | 400 | 389 | 76.0 |
| B | 5 | 236 | 1000655 | 13156.31 | 400 | 389 | 76.0 |
| B | 5 | 172 | 91578 | 1199.39 | 400 | 389 | 76.0 |
| C | 0 | 10 | 748546 | 5398.06 | 597 | 603 | 138.6 |
| C | 15 | 214 | 208904 | 1503.35 | 597 | 603 | 138.6 |
| C | 3 | 233 | 35180 | 249.55 | 597 | 603 | 138.6 |
| D | 7 | 80 | 1653343 | 12112.32 | 560 | 545 | 136.5 |
| D | 12 | 233 | 357394 | 2615.12 | 560 | 545 | 136.5 |
| D | 8 | 195 | 307105 | 2246.59 | 560 | 545 | 136.5 |
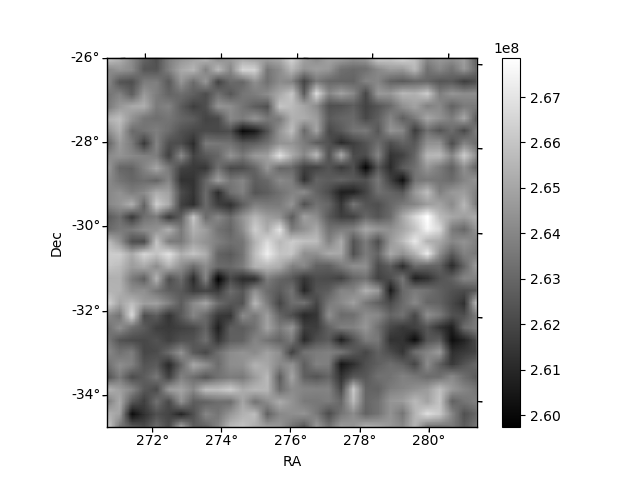
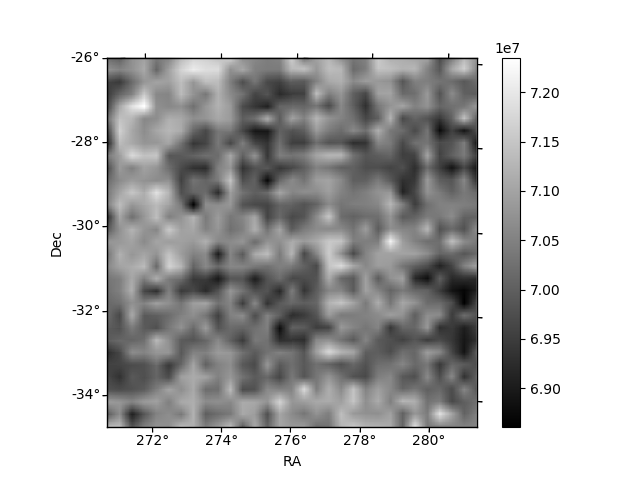
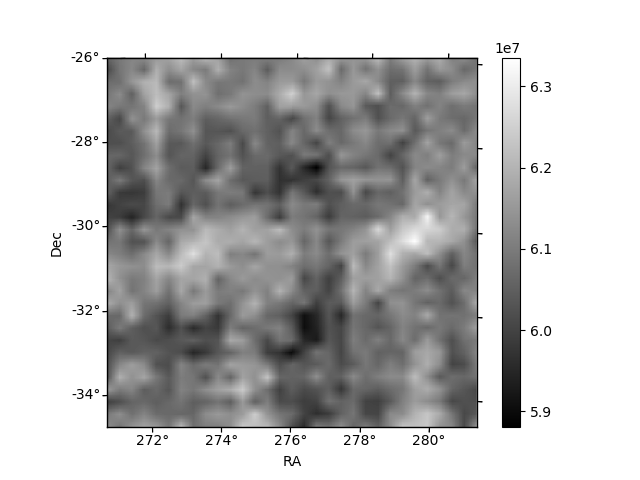
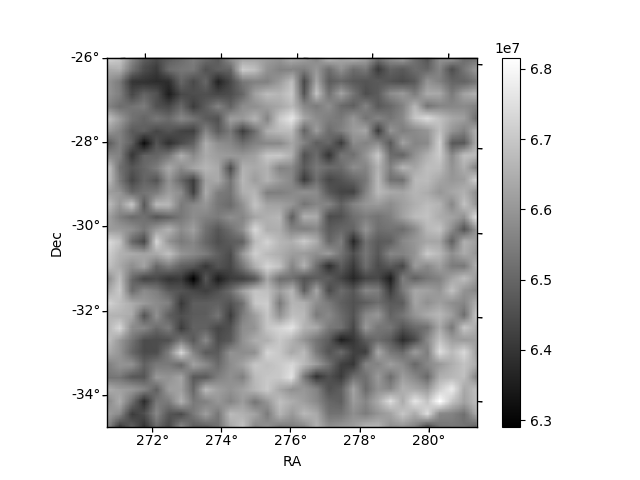
Histogram calculated using DETX and DETY for each event in the final _common_clean file
| Quadrant A | 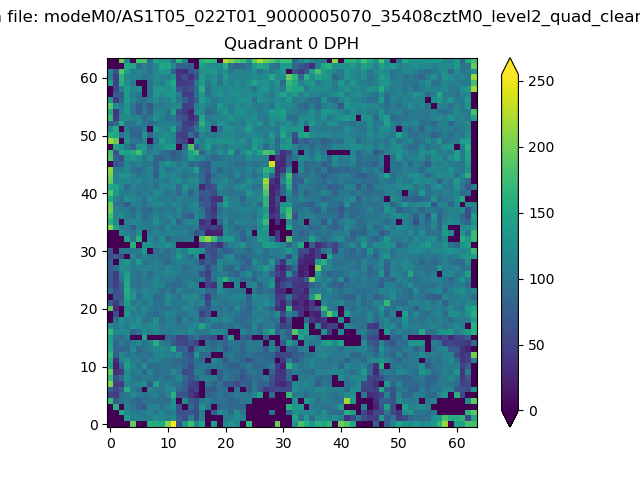 |
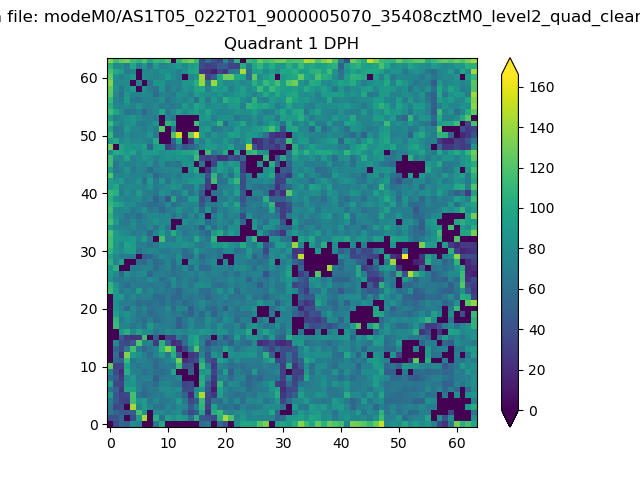 |
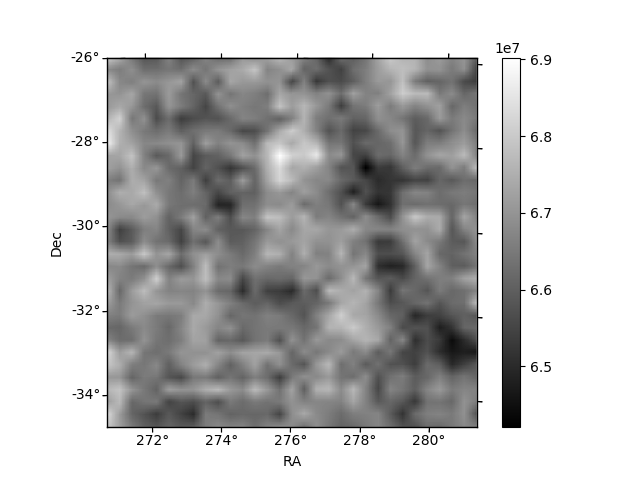
Quadrant B |
|---|---|---|---|
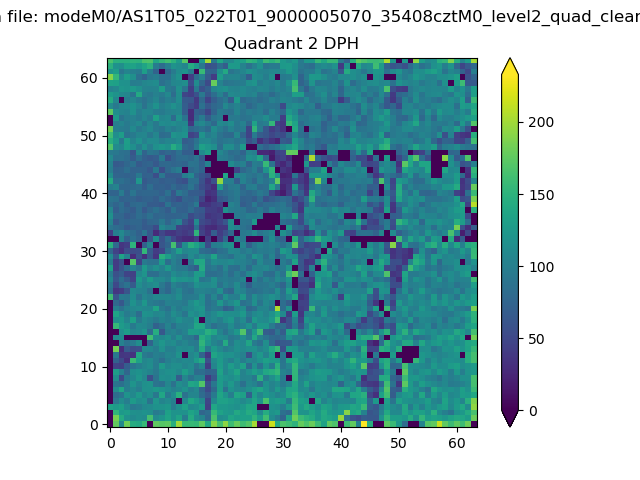
| Quadrant D | 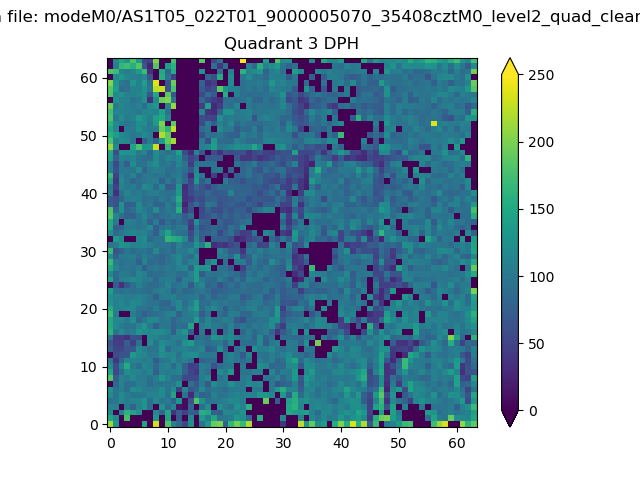 |
 |
Quadrant C |
| Plot type | Count rate plots | Images |
|---|---|---|
| Comparison with Poisson distribution Blue bars denote a histogram of data divided into 1 sec bins. Red curve is a Poisson curve with rate = median count rate of data. |
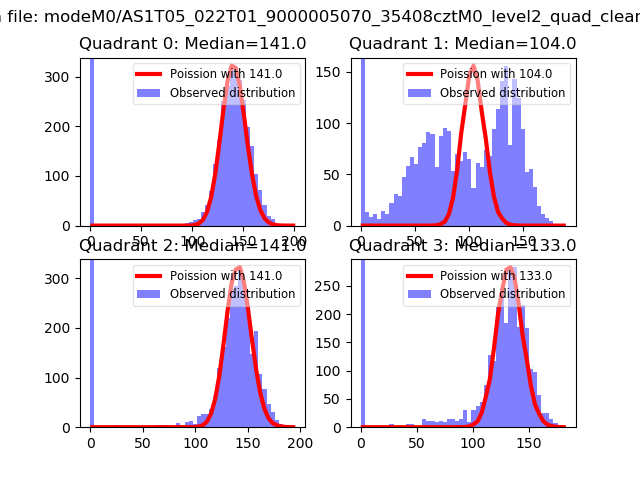 |
 |
| Quadrant-wise count rates Data is divided into 100 sec bins |
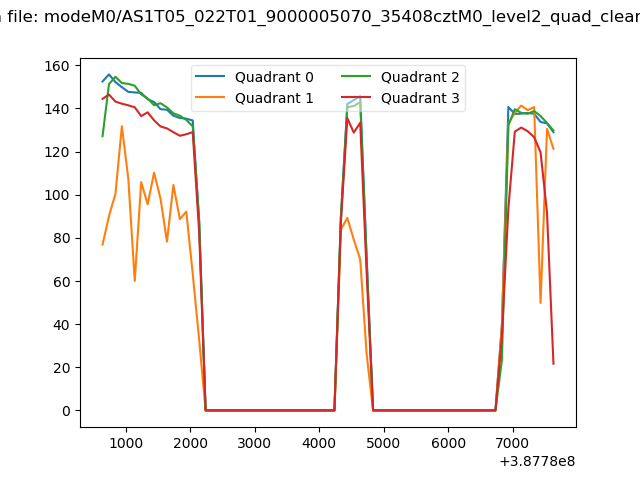 |
|
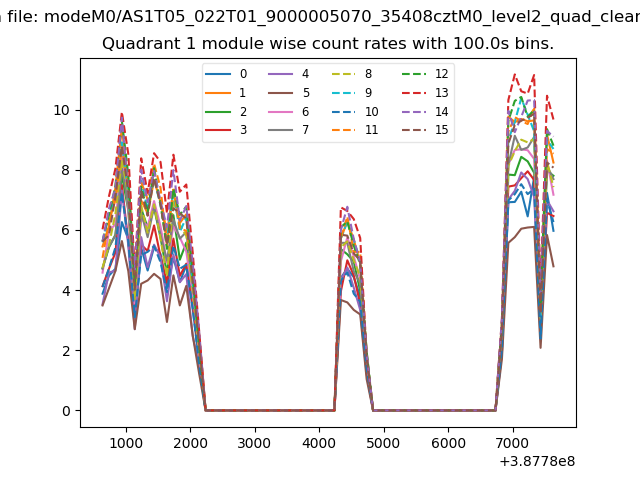
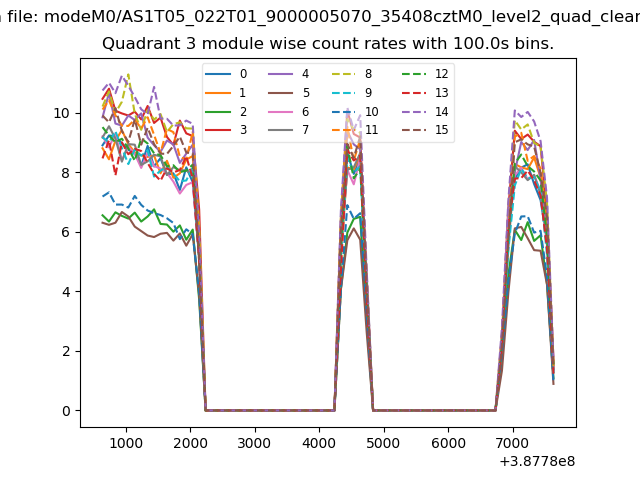
| Module-wise count rates for Quadrant A Data is divided into 100 sec bins |
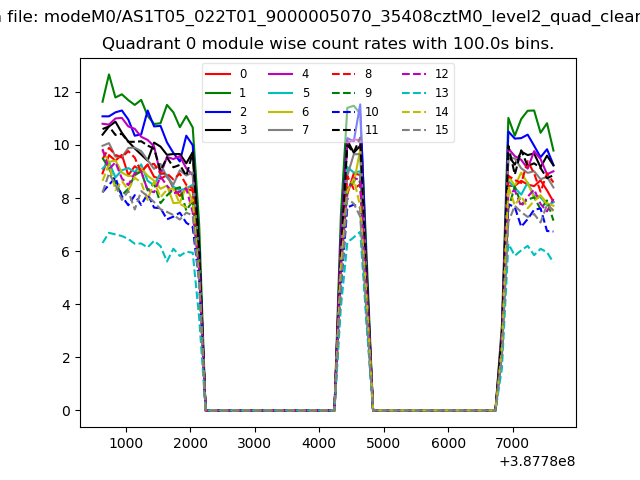 |
 |
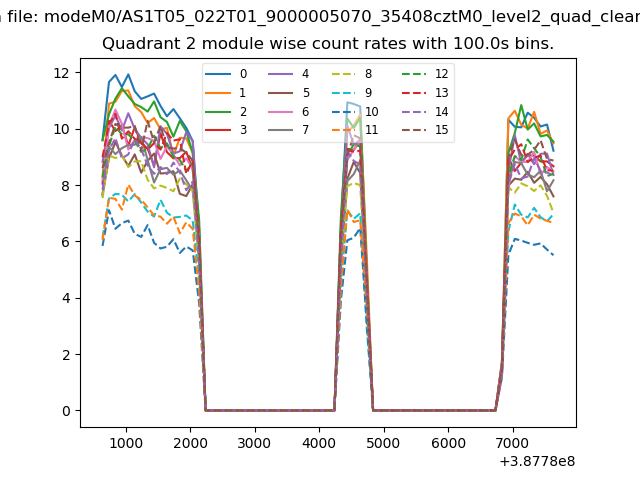
| Module-wise count rates for Quadrant B Data is divided into 100 sec bins |
 |
 |
| Module-wise count rates for Quadrant C Data is divided into 100 sec bins |
 |
 |
| Module-wise count rates for Quadrant D Data is divided into 100 sec bins |
 |
 |
| Parameter | Plot |
|---|---|
| CZT HV Monitor | 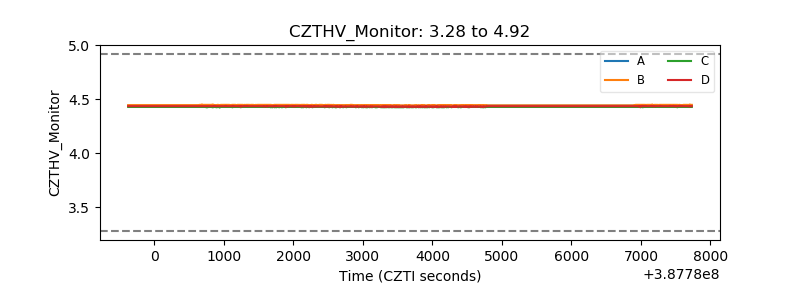 |
| D_VDD | 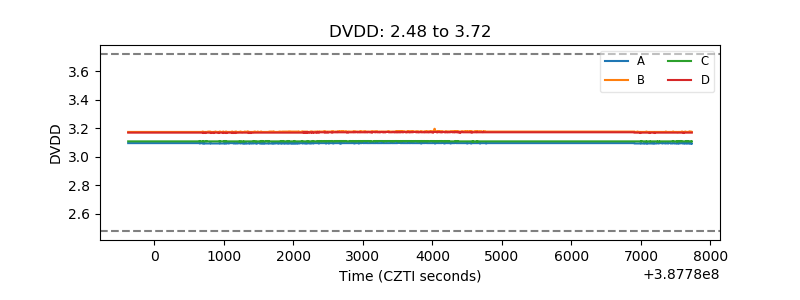 |
| Temperature 1 | 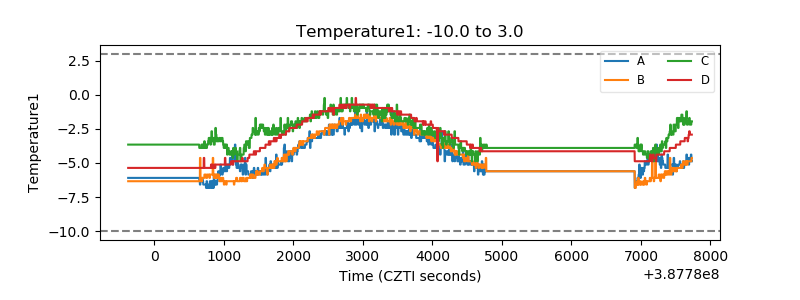 |
| Veto HV Monitor | 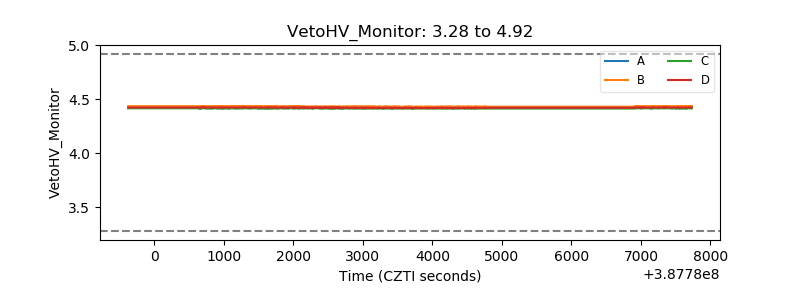 |
| Veto LLD | 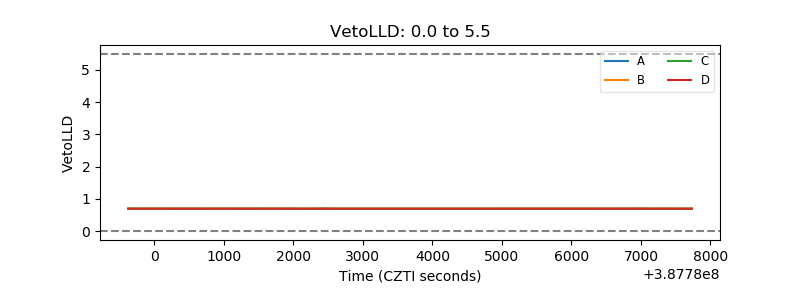 |
| Alpha Counter | 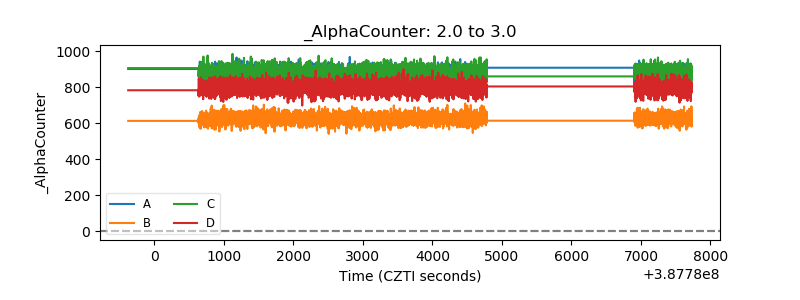 |
| _CPM_Rate | 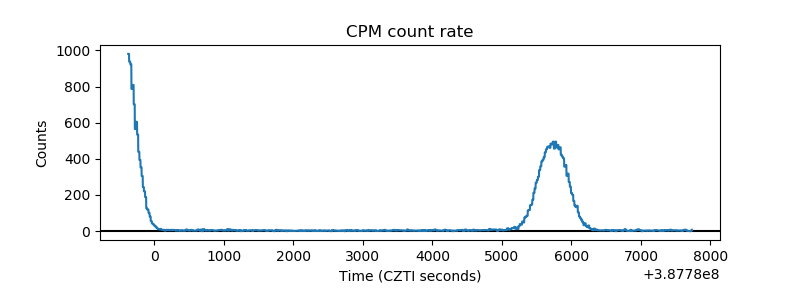 |
| CZT Counter | 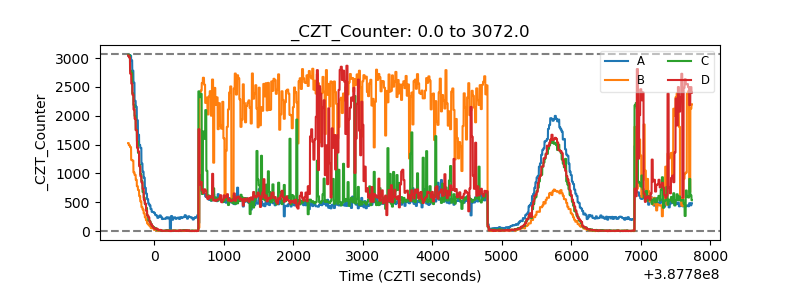 |
| +2.5 Volts monitor | 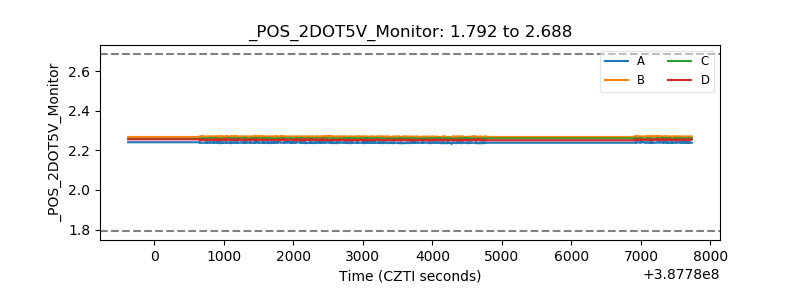 |
| +5 Volts monitor | 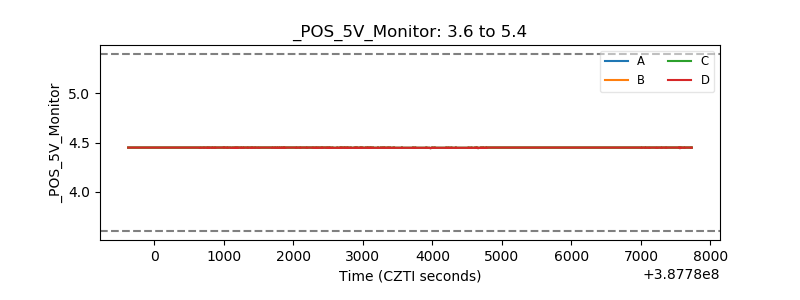 |
| _ROLL_ROT | 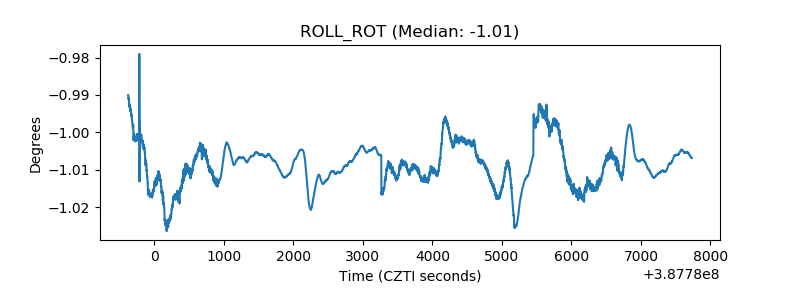 |
| _Roll_DEC | 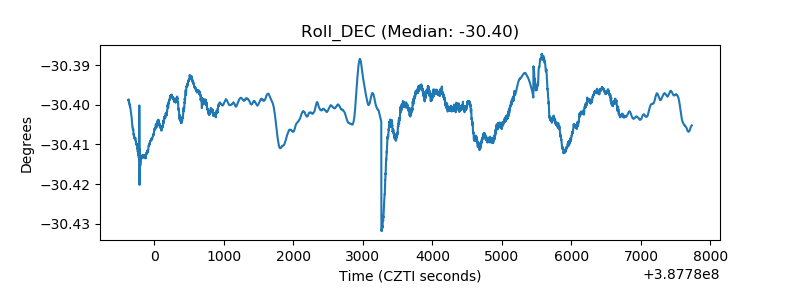 |
| _Roll_RA | 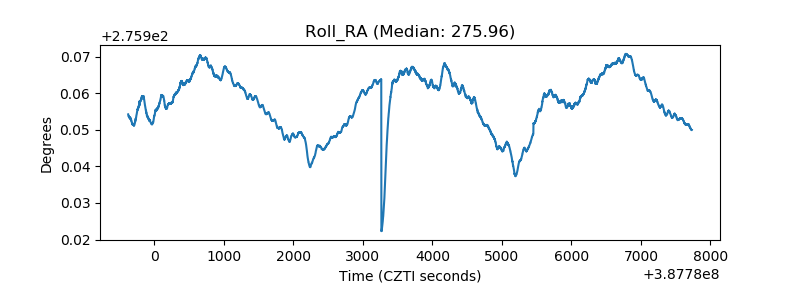 |
| Veto Counter | 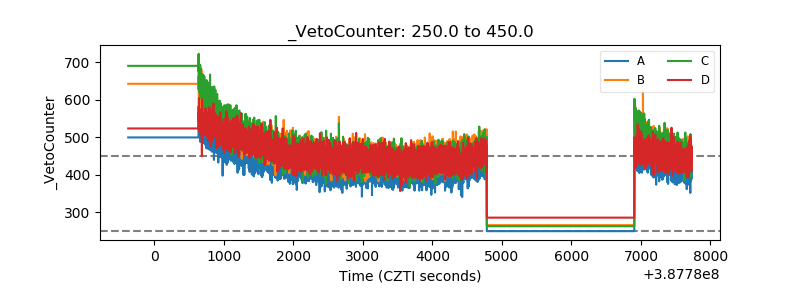 |