| Param | Original file | Final file |
|---|---|---|
| Filename | modeM0/AS1T05_022T01_9000005070_35407cztM0_level2.evt | modeM0/AS1T05_022T01_9000005070_35407cztM0_level2_quad_clean.evt |
| Size (bytes) | 638,449,920 | 62,438,400 |
| Size | 608.9 MB | 59.5 MB |
| Events in quadrant A | 2,562,924 | 407,573 |
| Events in quadrant B | 8,404,014 | 349,125 |
| Events in quadrant C | 3,028,226 | 407,283 |
| Events in quadrant D | 5,008,611 | 381,402 |
| Mode M0 | |||
|---|---|---|---|
| Quadrant | BADHDUFLAG | Total packets | Discarded packets |
| A | 0 | 10416 | 3 |
| B | 0 | 28360 | 2 |
| C | 0 | 11730 | 2 |
| D | 0 | 18339 | 2 |
| Mode SS | |||
|---|---|---|---|
| Quadrant | BADHDUFLAG | Total packets | Discarded packets |
| A | 0 | 98 | 0 |
| B | 0 | 98 | 0 |
| C | 0 | 98 | 0 |
| D | 0 | 98 | 0 |
| Mode M9 | |||
|---|---|---|---|
| Quadrant | BADHDUFLAG | Total packets | Discarded packets |
| A | 0 | 30 | 0 |
| B | 0 | 30 | 0 |
| C | 0 | 30 | 0 |
| D | 0 | 31 | 0 |
| Quadrant | Total seconds | Saturated seconds | Saturation percentage |
|---|---|---|---|
| A | 4919 | 7 | 0.142305% |
| B | 4919 | 2257 | 45.883310% |
| C | 4919 | 121 | 2.459850% |
| D | 4919 | 584 | 11.872332% |
Noise dominated data is calculated using 1-second bins in cleaned event files. If a bin has >2000 counts, and if more than 50% of those come from <1% of pixels, then it is considered to be noise-dominated and hence unusable.
| Quadrant | # 1 sec bins | Bins with >0 counts | Bins with >2000 counts | High rate bins dominated by noise | Noise dominated (total time) | Noise dominated (detector-on time) | Marked lightcurve |
|---|---|---|---|---|---|---|---|
| A | 7042 | 4920 | 1 | 1 | 0.01% | 0.02% | 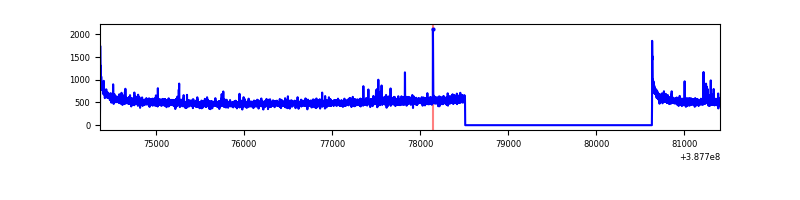 |
| B | 7042 | 4920 | 1881 | 1881 | 26.71% | 38.23% | 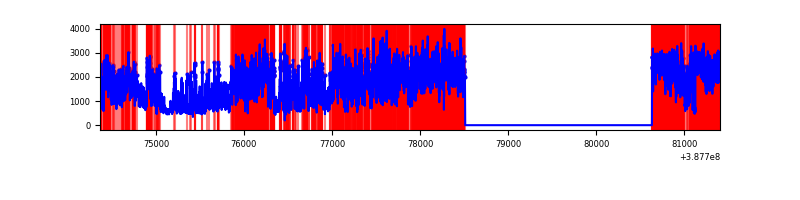 |
| C | 7042 | 4920 | 95 | 95 | 1.35% | 1.93% | 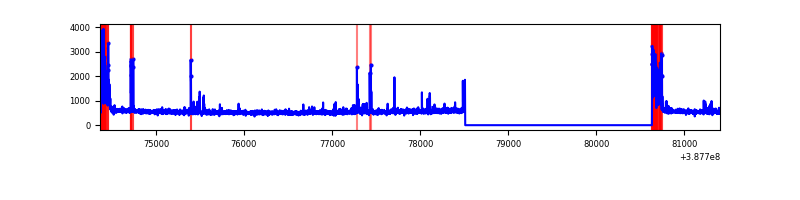 |
| D | 7042 | 4920 | 458 | 458 | 6.50% | 9.31% | 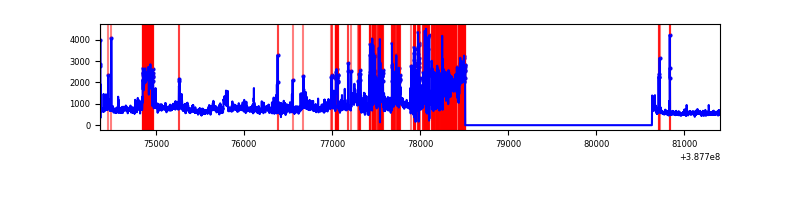 |
Top three noisy pixels from each quadrant. If the there are fewer than three noisy pixels in the level2.evt file, extra rows are filled as -1
| Pixel properties | Quadrant properties | ||||||
|---|---|---|---|---|---|---|---|
| Quadrant | DetID | PixID | Counts | Sigma | Mean | Median | Sigma |
| A | 10 | 83 | 125314 | 1016.29 | 619 | 608 | 122.7 |
| A | 9 | 143 | 26524 | 211.2 | 619 | 608 | 122.7 |
| A | 13 | 6 | 9873 | 75.5 | 619 | 608 | 122.7 |
| B | 4 | 251 | 5654240 | 58787.55 | 511 | 498 | 96.2 |
| B | 5 | 236 | 239266 | 2482.71 | 511 | 498 | 96.2 |
| B | 5 | 172 | 153148 | 1587.25 | 511 | 498 | 96.2 |
| C | 0 | 10 | 427882 | 3052.24 | 608 | 613 | 140.0 |
| C | 15 | 214 | 202636 | 1443.17 | 608 | 613 | 140.0 |
| C | 3 | 233 | 23240 | 161.64 | 608 | 613 | 140.0 |
| D | 7 | 80 | 1581331 | 11293.51 | 580 | 565 | 140.0 |
| D | 8 | 195 | 539307 | 3848.95 | 580 | 565 | 140.0 |
| D | 12 | 233 | 189510 | 1349.88 | 580 | 565 | 140.0 |
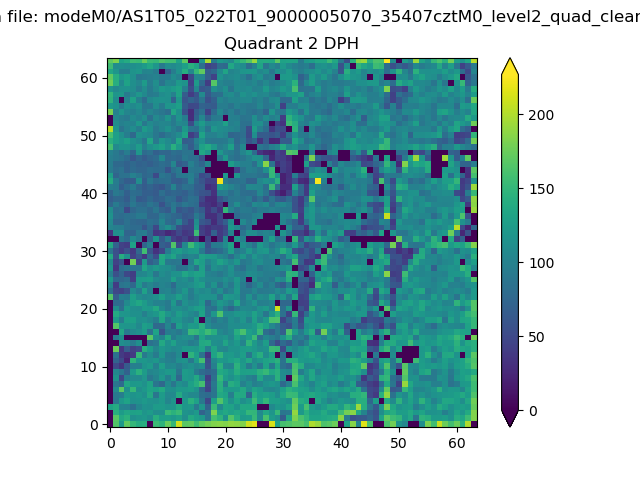
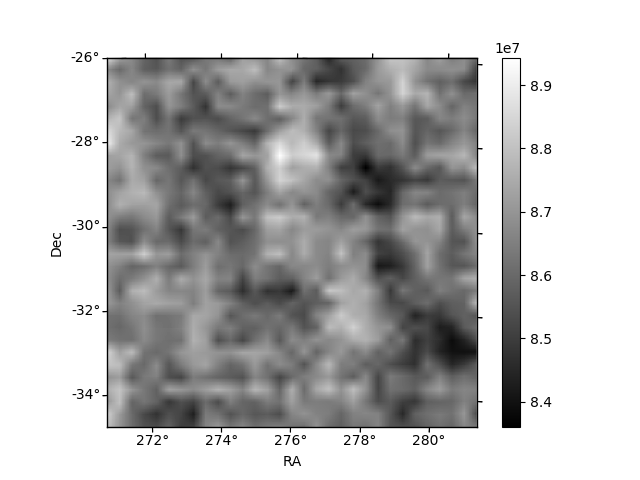
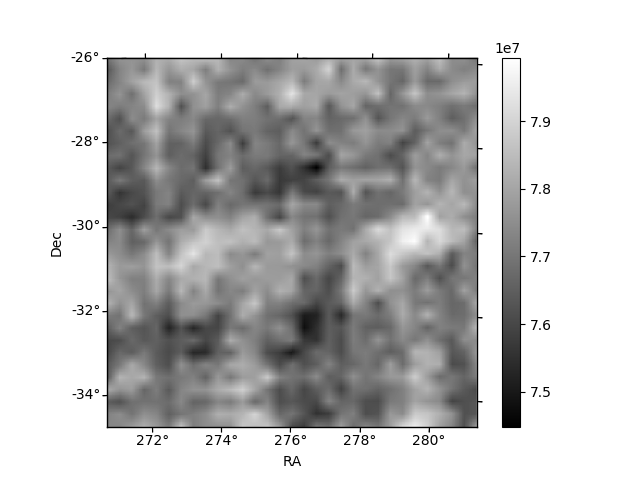
Histogram calculated using DETX and DETY for each event in the final _common_clean file
| Quadrant A | 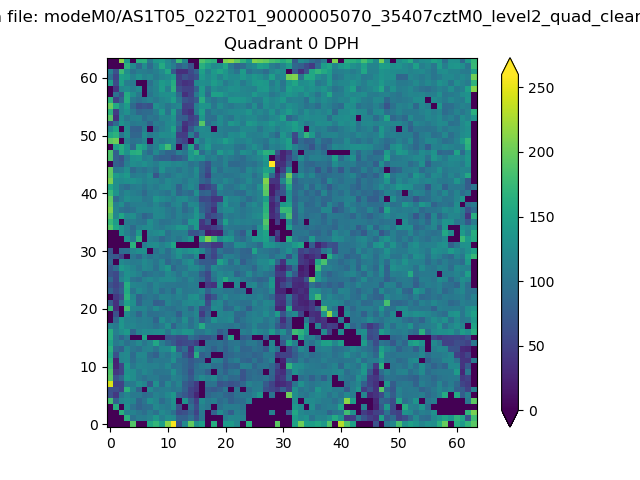 |
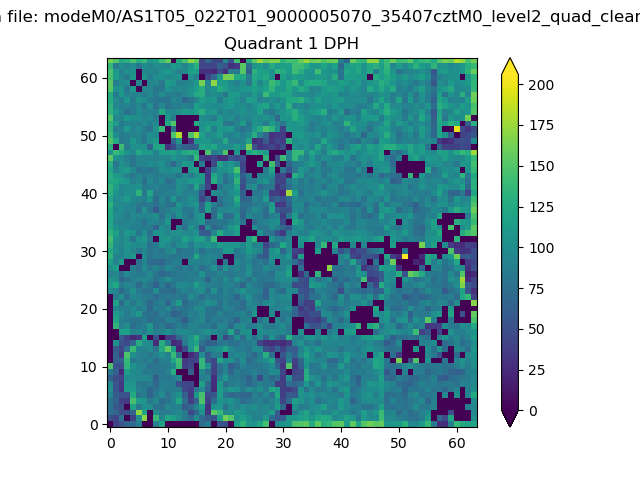 |
Quadrant B |
|---|---|---|---|
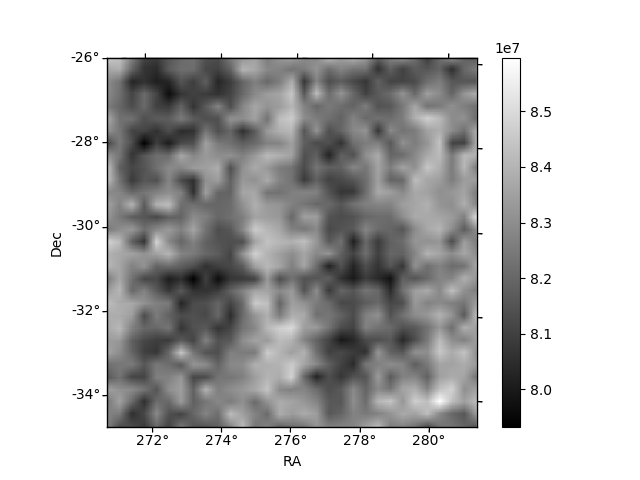
| Quadrant D | 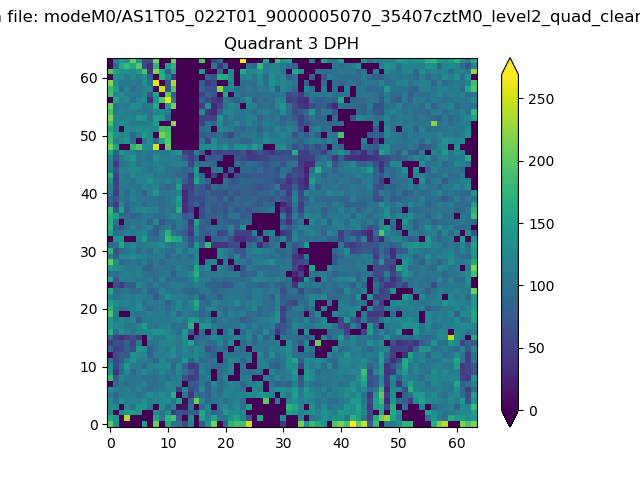 |
 |
Quadrant C |
| Plot type | Count rate plots | Images |
|---|---|---|
| Comparison with Poisson distribution Blue bars denote a histogram of data divided into 1 sec bins. Red curve is a Poisson curve with rate = median count rate of data. |
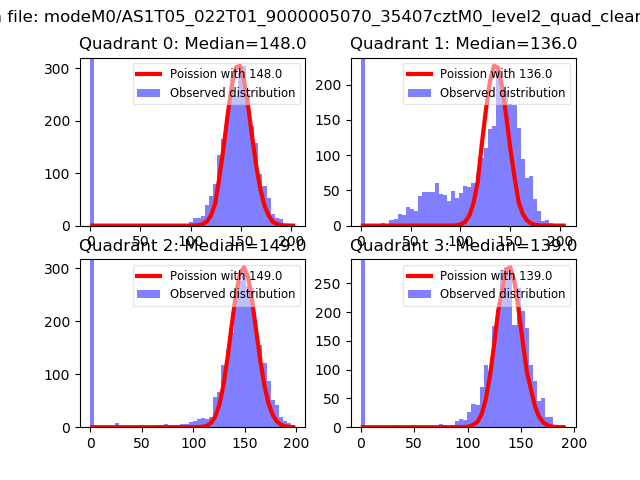 |
 |
| Quadrant-wise count rates Data is divided into 100 sec bins |
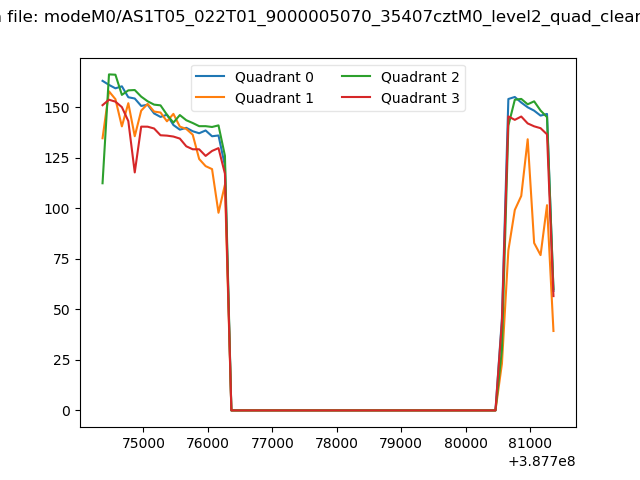 |
|
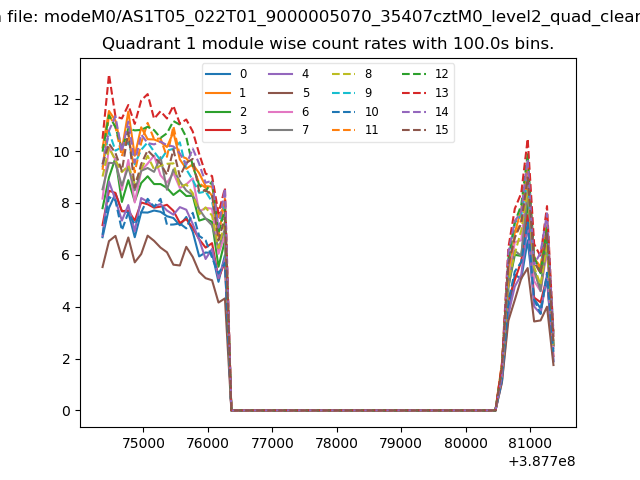
| Module-wise count rates for Quadrant A Data is divided into 100 sec bins |
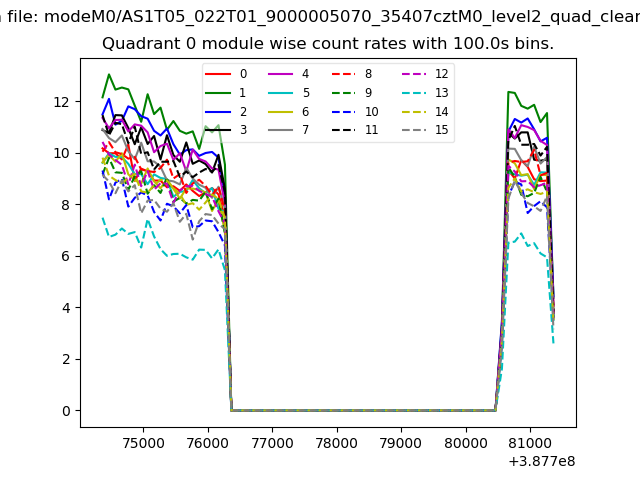 |
 |
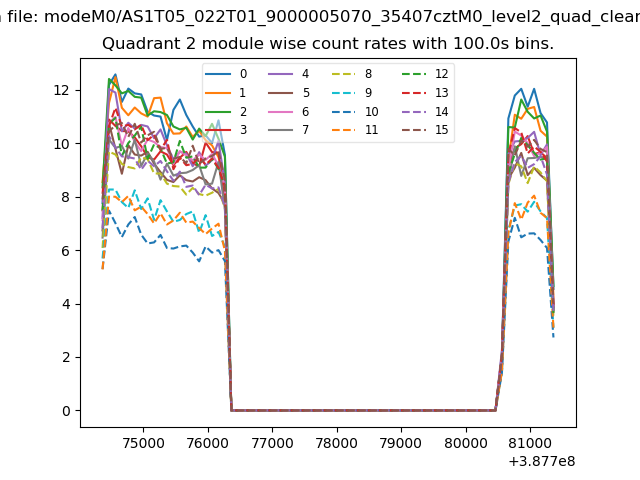
| Module-wise count rates for Quadrant B Data is divided into 100 sec bins |
 |
 |
| Module-wise count rates for Quadrant C Data is divided into 100 sec bins |
 |
 |
| Module-wise count rates for Quadrant D Data is divided into 100 sec bins |
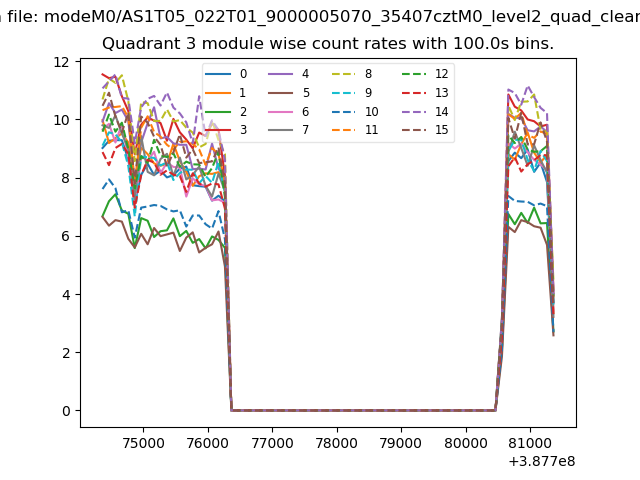 |
 |
| Parameter | Plot |
|---|---|
| CZT HV Monitor | 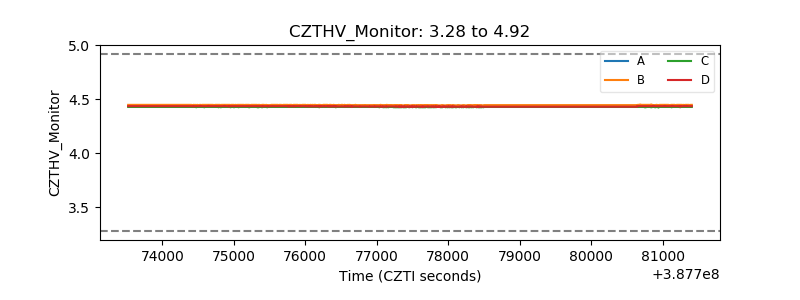 |
| D_VDD | 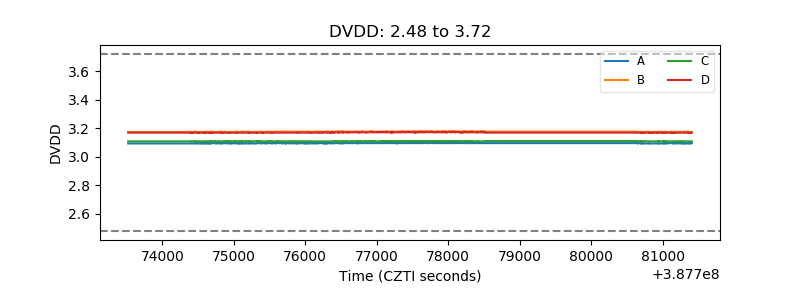 |
| Temperature 1 | 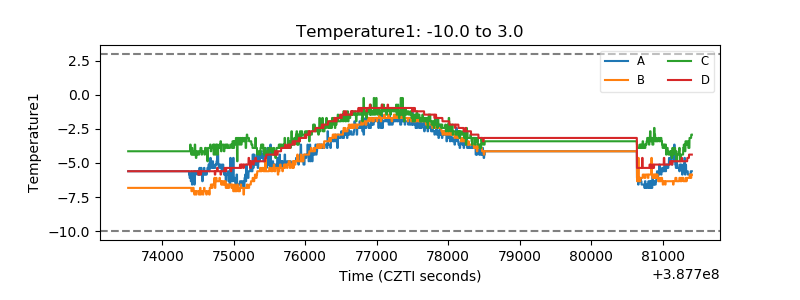 |
| Veto HV Monitor | 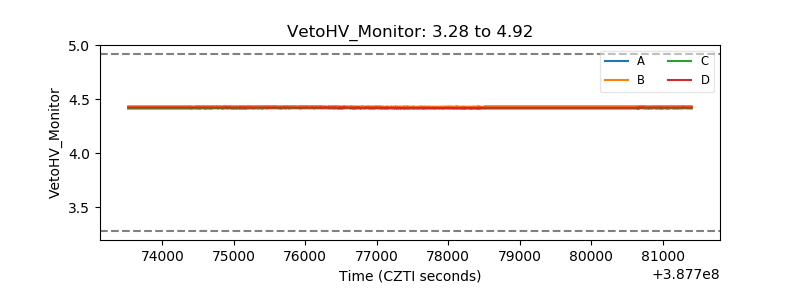 |
| Veto LLD | 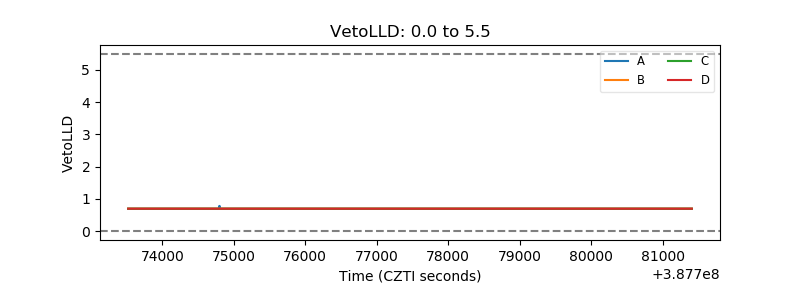 |
| Alpha Counter | 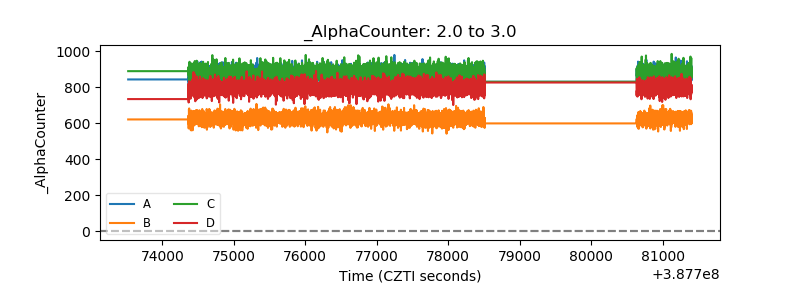 |
| _CPM_Rate | 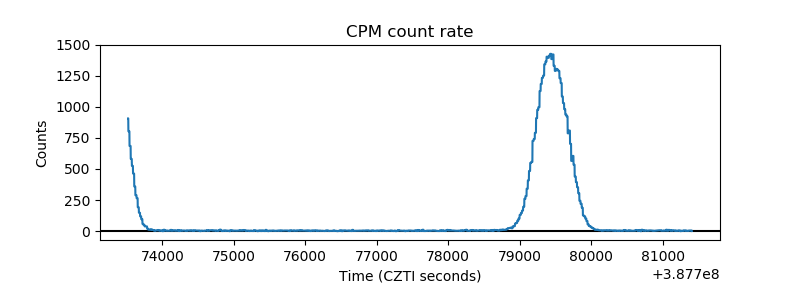 |
| CZT Counter | 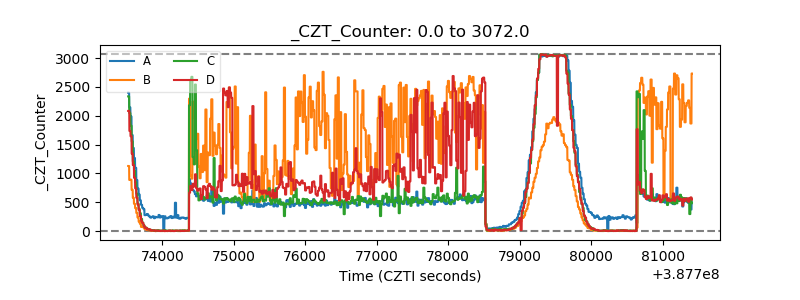 |
| +2.5 Volts monitor | 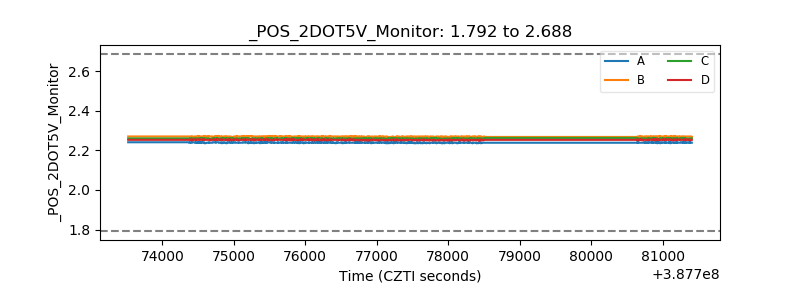 |
| +5 Volts monitor | 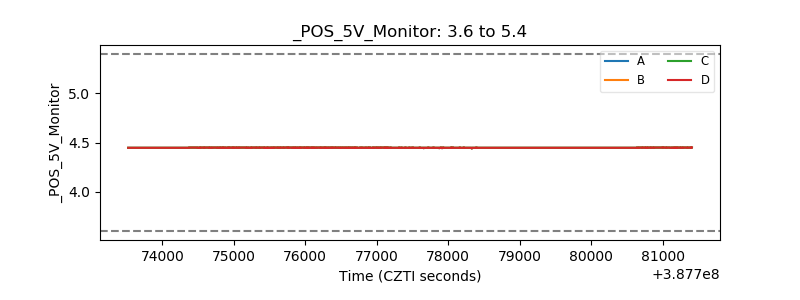 |
| _ROLL_ROT | 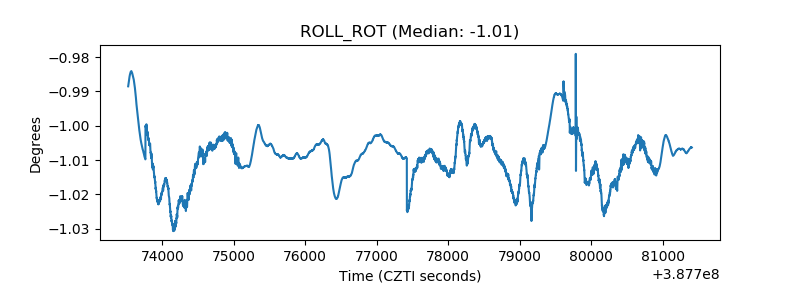 |
| _Roll_DEC | 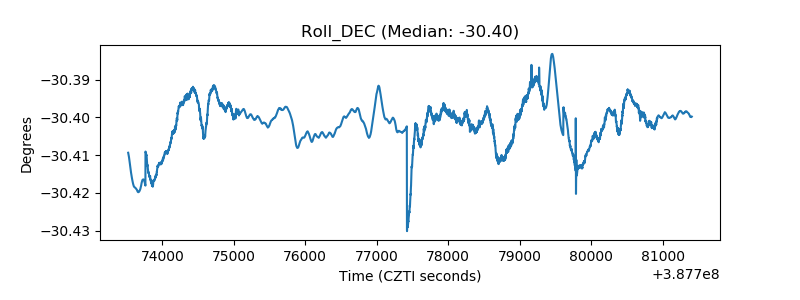 |
| _Roll_RA | 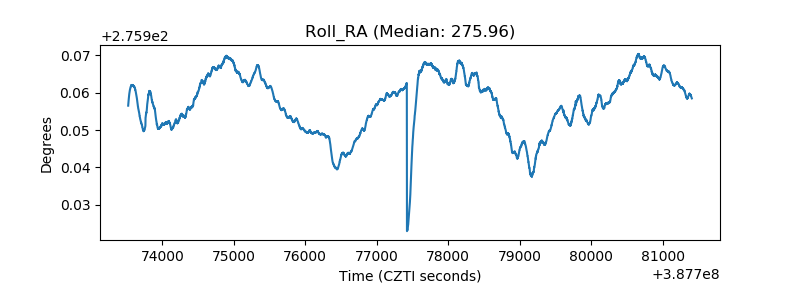 |
| Veto Counter | 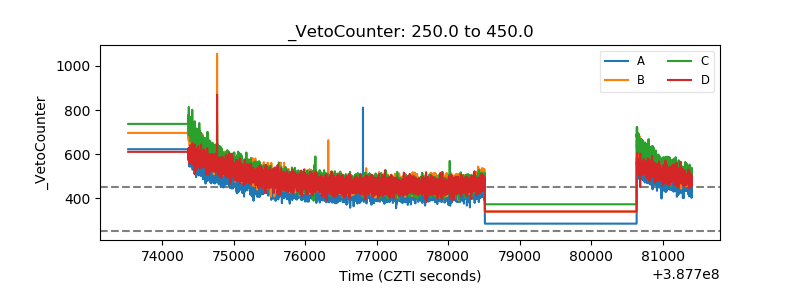 |