| Param | Original file | Final file |
|---|---|---|
| Filename | modeM0/AS1T05_022T01_9000005070_35404cztM0_level2.evt | modeM0/AS1T05_022T01_9000005070_35404cztM0_level2_quad_clean.evt |
| Size (bytes) | 585,138,240 | 79,816,320 |
| Size | 558.0 MB | 76.1 MB |
| Events in quadrant A | 2,571,040 | 537,763 |
| Events in quadrant B | 5,360,886 | 535,594 |
| Events in quadrant C | 3,054,196 | 535,699 |
| Events in quadrant D | 6,379,398 | 439,576 |
| Mode M0 | |||
|---|---|---|---|
| Quadrant | BADHDUFLAG | Total packets | Discarded packets |
| A | 0 | 10963 | 3 |
| B | 0 | 19444 | 2 |
| C | 0 | 12060 | 2 |
| D | 0 | 22554 | 2 |
| Mode SS | |||
|---|---|---|---|
| Quadrant | BADHDUFLAG | Total packets | Discarded packets |
| A | 0 | 108 | 0 |
| B | 0 | 108 | 0 |
| C | 0 | 108 | 0 |
| D | 0 | 108 | 0 |
| Mode M9 | |||
|---|---|---|---|
| Quadrant | BADHDUFLAG | Total packets | Discarded packets |
| A | 0 | 25 | 0 |
| B | 0 | 25 | 0 |
| C | 0 | 25 | 0 |
| D | 0 | 26 | 0 |
| Quadrant | Total seconds | Saturated seconds | Saturation percentage |
|---|---|---|---|
| A | 5249 | 12 | 0.228615% |
| B | 5249 | 847 | 16.136407% |
| C | 5249 | 129 | 2.457611% |
| D | 5249 | 1247 | 23.756906% |
Noise dominated data is calculated using 1-second bins in cleaned event files. If a bin has >2000 counts, and if more than 50% of those come from <1% of pixels, then it is considered to be noise-dominated and hence unusable.
| Quadrant | # 1 sec bins | Bins with >0 counts | Bins with >2000 counts | High rate bins dominated by noise | Noise dominated (total time) | Noise dominated (detector-on time) | Marked lightcurve |
|---|---|---|---|---|---|---|---|
| A | 7043 | 5250 | 2 | 2 | 0.03% | 0.04% | 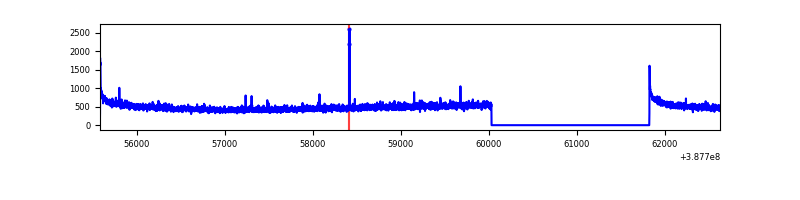 |
| B | 7043 | 5250 | 646 | 646 | 9.17% | 12.30% | 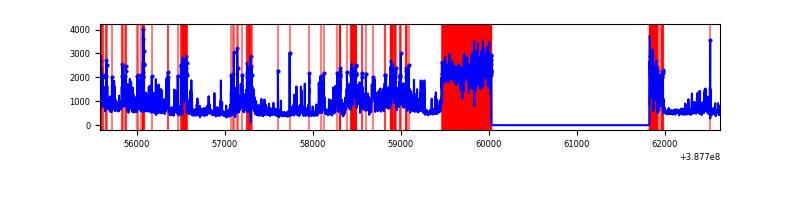 |
| C | 7043 | 5250 | 95 | 95 | 1.35% | 1.81% | 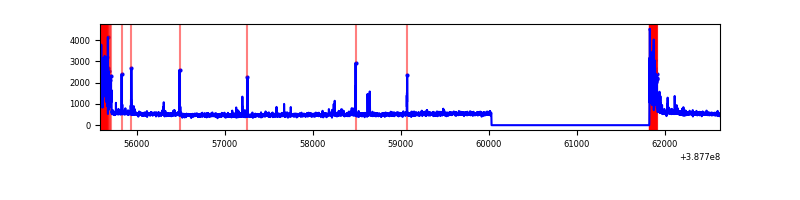 |
| D | 7043 | 5250 | 1019 | 1019 | 14.47% | 19.41% | 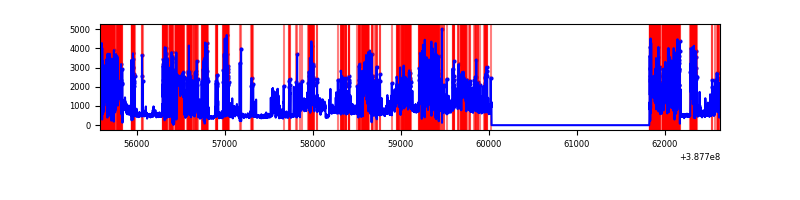 |
Top three noisy pixels from each quadrant. If the there are fewer than three noisy pixels in the level2.evt file, extra rows are filled as -1
| Pixel properties | Quadrant properties | ||||||
|---|---|---|---|---|---|---|---|
| Quadrant | DetID | PixID | Counts | Sigma | Mean | Median | Sigma |
| A | 10 | 83 | 123875 | 971.12 | 627 | 614 | 126.9 |
| A | 9 | 143 | 11973 | 89.49 | 627 | 614 | 126.9 |
| A | 13 | 6 | 11254 | 83.83 | 627 | 614 | 126.9 |
| B | 4 | 251 | 1634643 | 14537.81 | 587 | 572 | 112.4 |
| B | 5 | 14 | 315074 | 2798.02 | 587 | 572 | 112.4 |
| B | 5 | 31 | 312745 | 2777.3 | 587 | 572 | 112.4 |
| C | 0 | 10 | 376911 | 2619.56 | 615 | 622 | 143.6 |
| C | 15 | 214 | 214496 | 1488.9 | 615 | 622 | 143.6 |
| C | 0 | 207 | 29344 | 199.95 | 615 | 622 | 143.6 |
| D | 7 | 80 | 3418307 | 25326.29 | 541 | 526 | 134.9 |
| D | 1 | 47 | 299293 | 2213.91 | 541 | 526 | 134.9 |
| D | 13 | 249 | 215656 | 1594.15 | 541 | 526 | 134.9 |
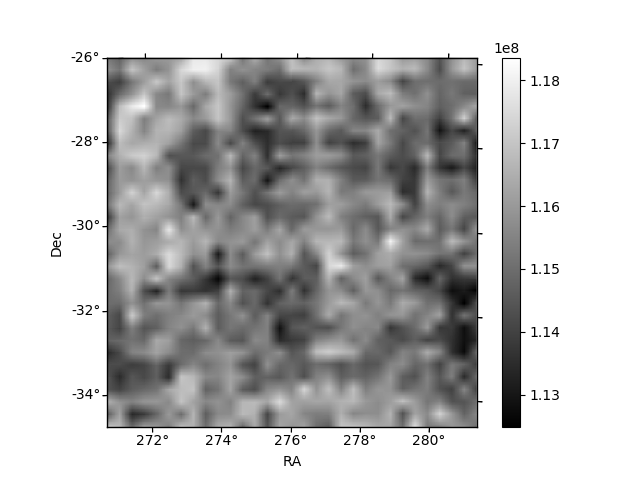
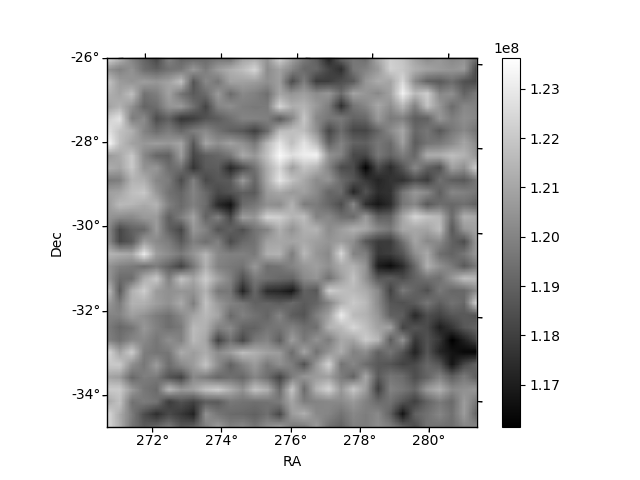
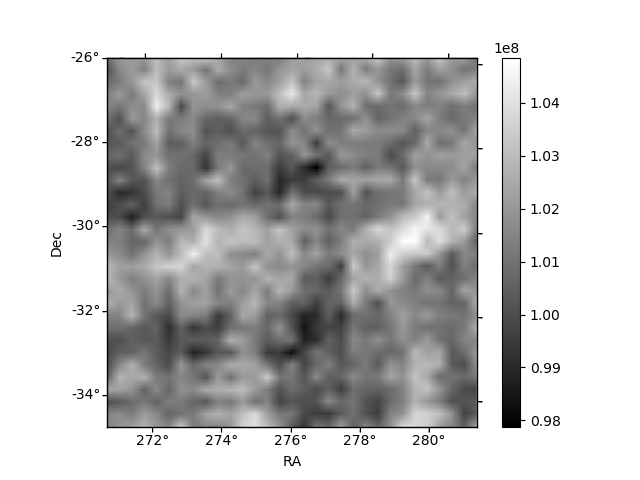
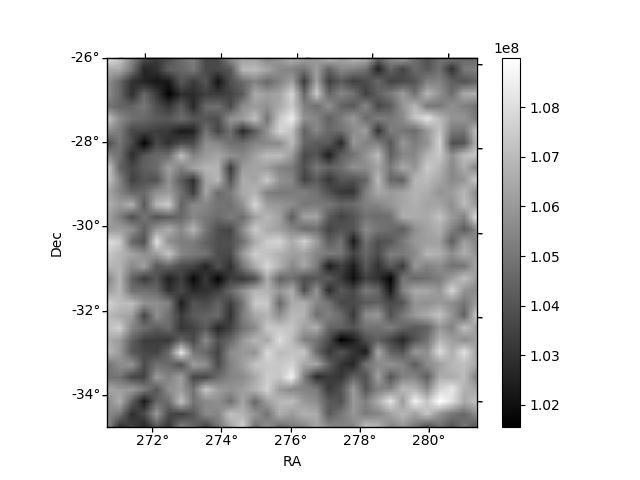
Histogram calculated using DETX and DETY for each event in the final _common_clean file
| Quadrant A | 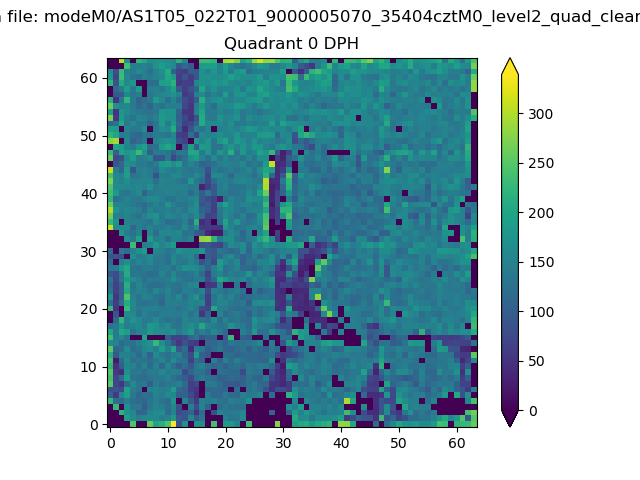 |
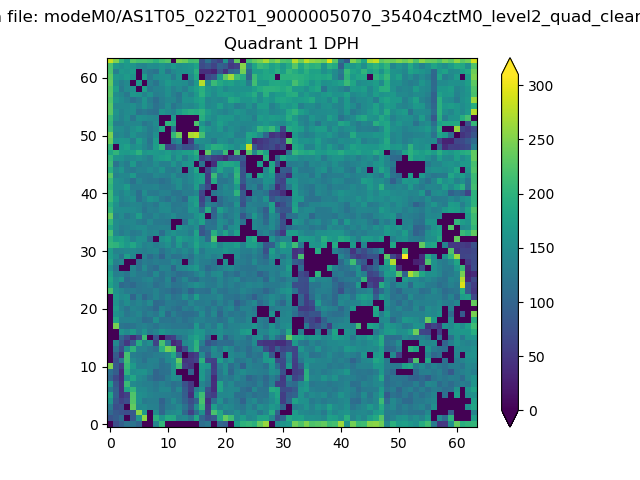 |
Quadrant B |
|---|---|---|---|
| Quadrant D | 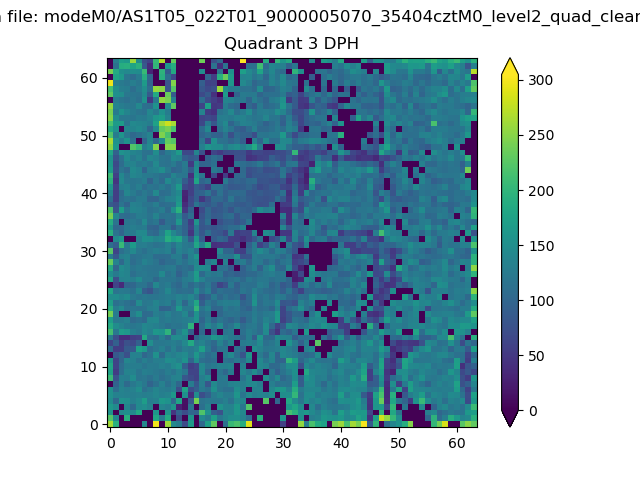 |
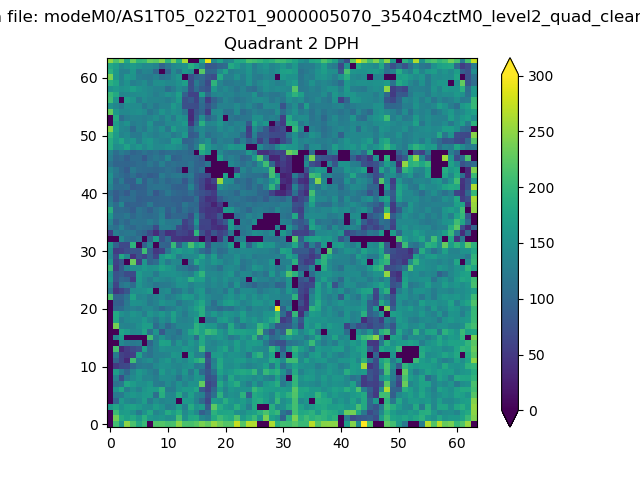 |
Quadrant C |
| Plot type | Count rate plots | Images |
|---|---|---|
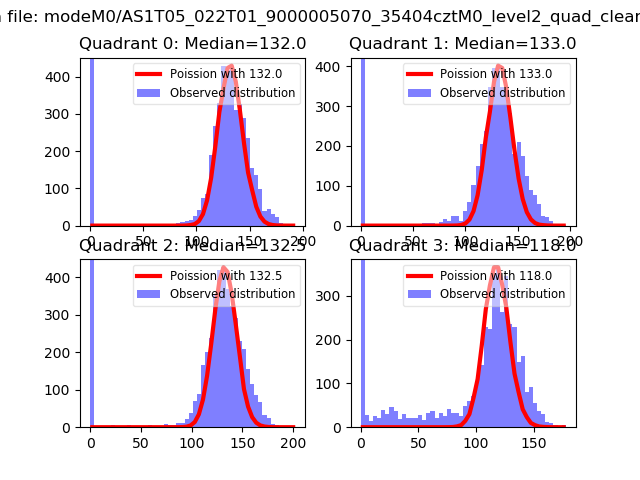
| Comparison with Poisson distribution Blue bars denote a histogram of data divided into 1 sec bins. Red curve is a Poisson curve with rate = median count rate of data. |
 |
 |
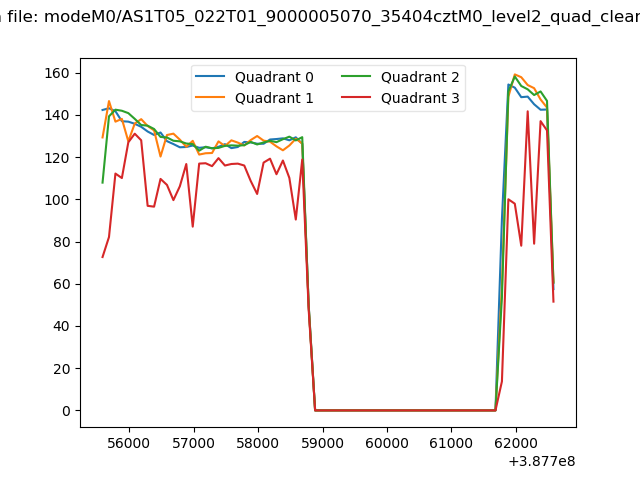
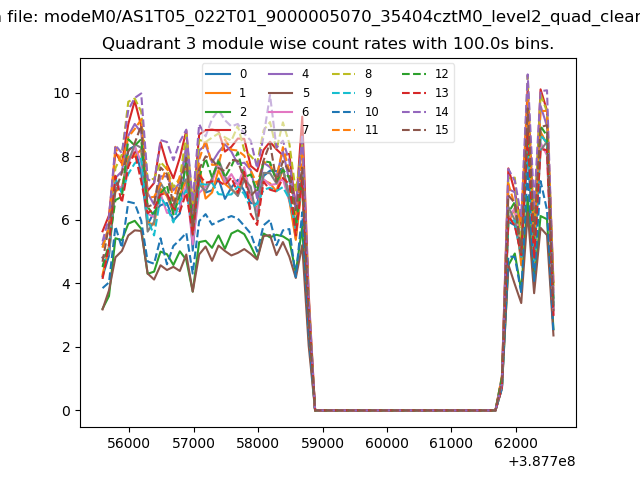
| Quadrant-wise count rates Data is divided into 100 sec bins |
 |
|
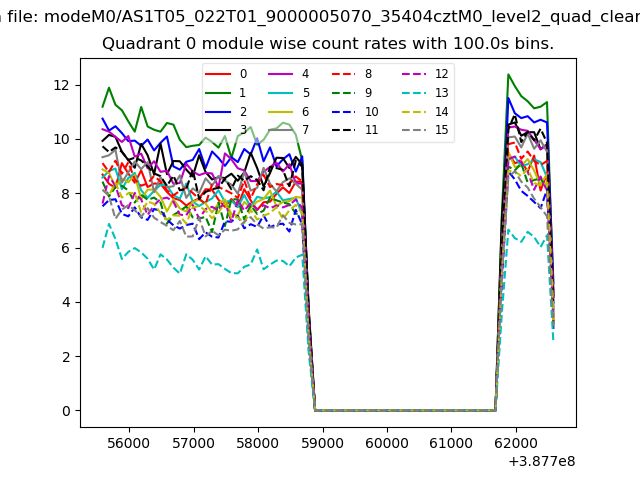
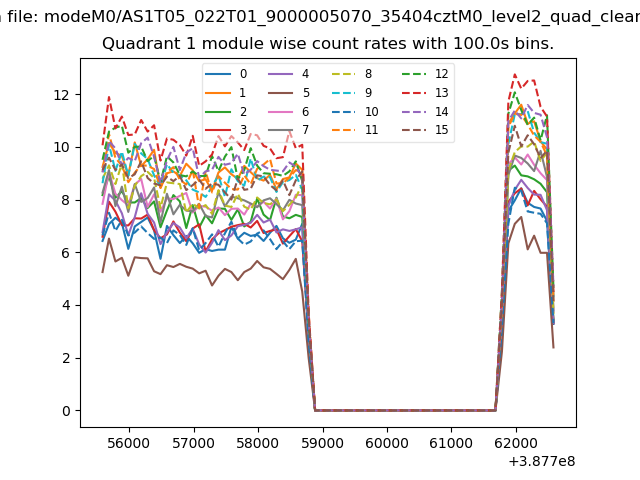
| Module-wise count rates for Quadrant A Data is divided into 100 sec bins |
 |
 |
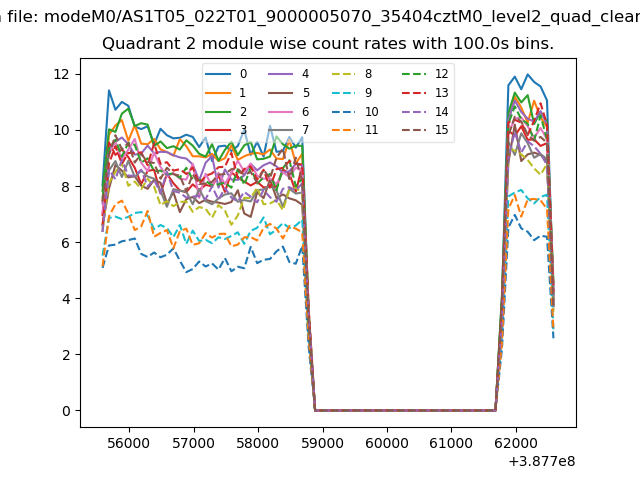
| Module-wise count rates for Quadrant B Data is divided into 100 sec bins |
 |
 |
| Module-wise count rates for Quadrant C Data is divided into 100 sec bins |
 |
 |
| Module-wise count rates for Quadrant D Data is divided into 100 sec bins |
 |
 |
| Parameter | Plot |
|---|---|
| CZT HV Monitor | 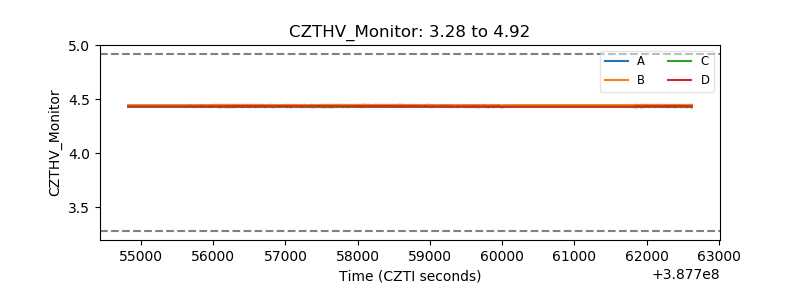 |
| D_VDD | 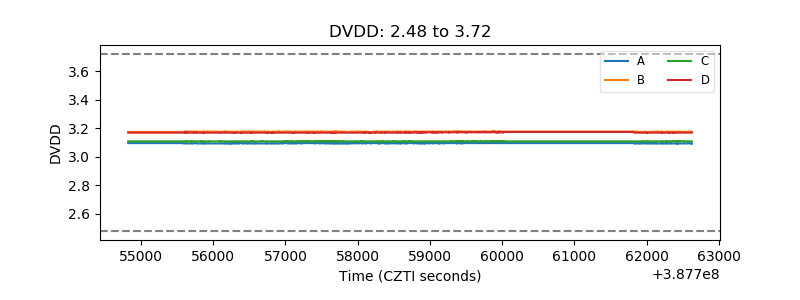 |
| Temperature 1 | 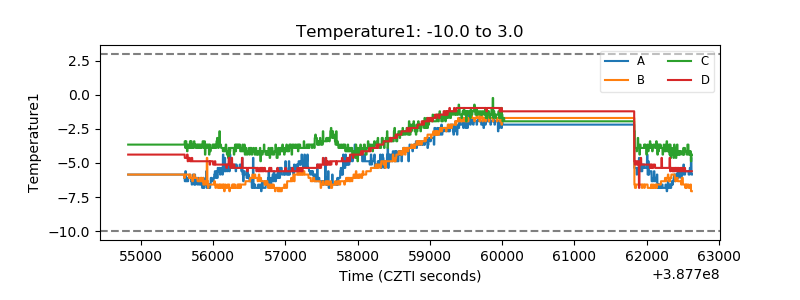 |
| Veto HV Monitor | 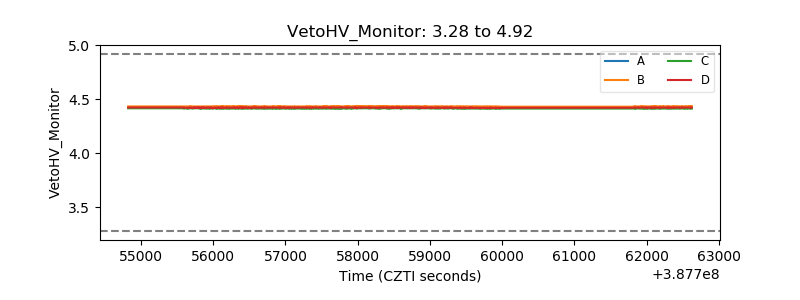 |
| Veto LLD | 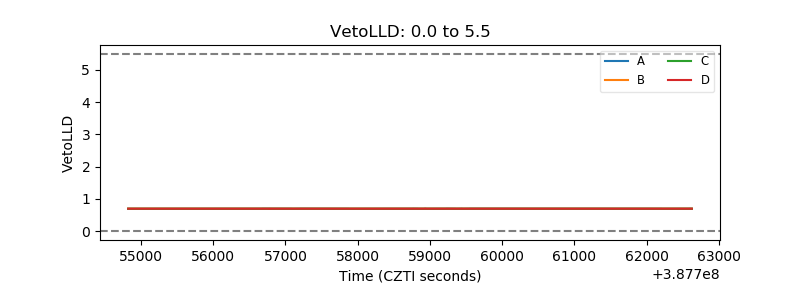 |
| Alpha Counter | 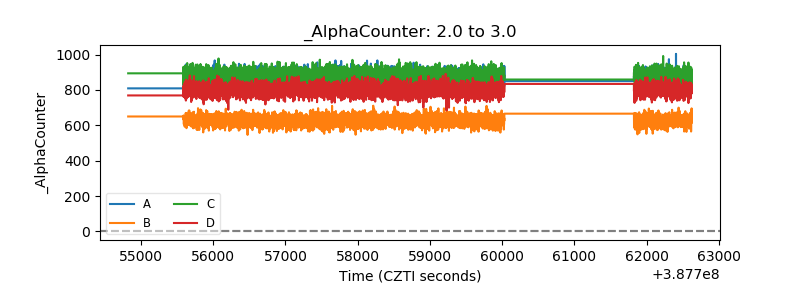 |
| _CPM_Rate | 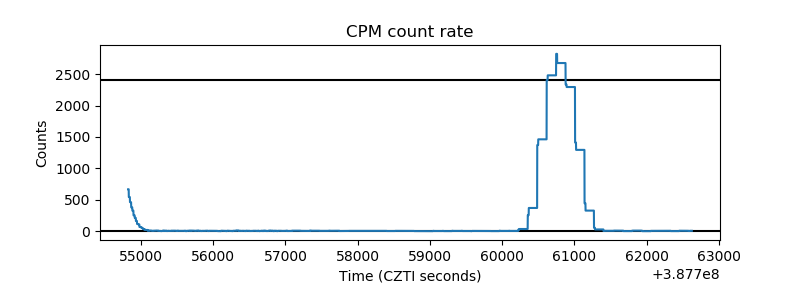 |
| CZT Counter | 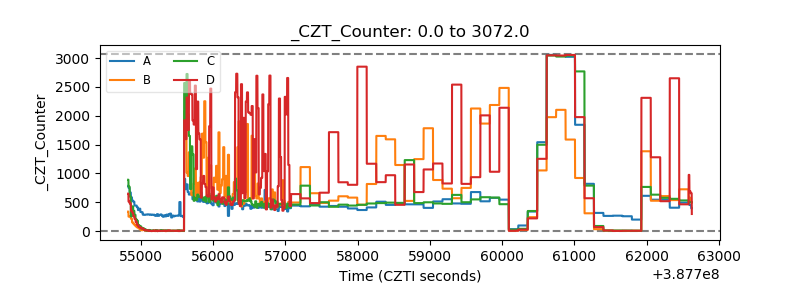 |
| +2.5 Volts monitor |  |
| +5 Volts monitor | 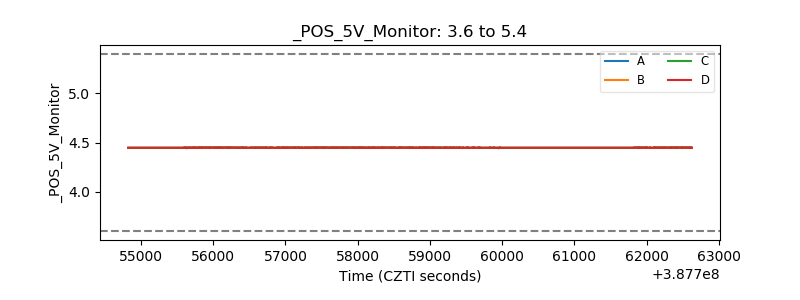 |
| _ROLL_ROT | 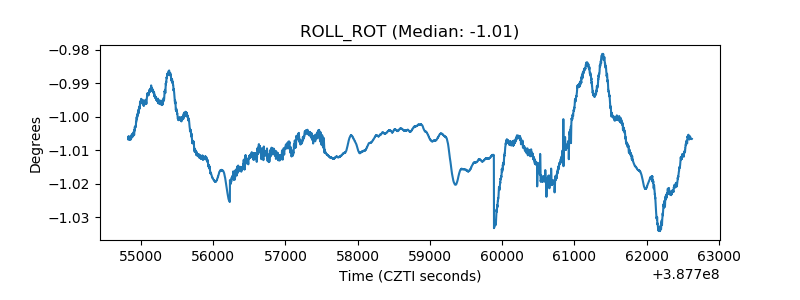 |
| _Roll_DEC | 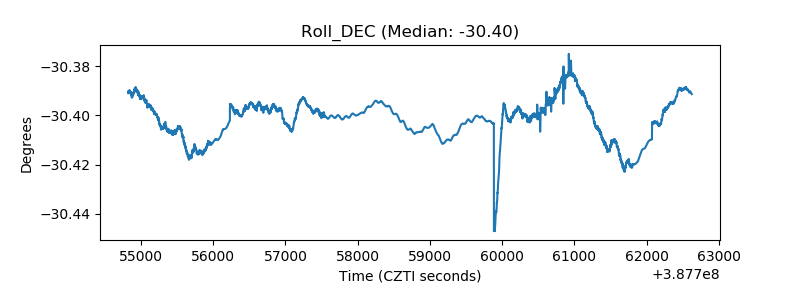 |
| _Roll_RA | 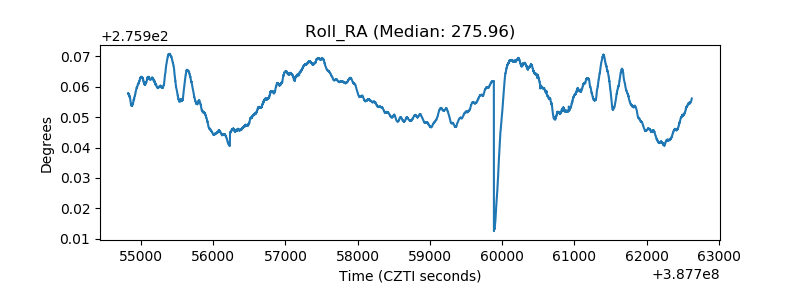 |
| Veto Counter | 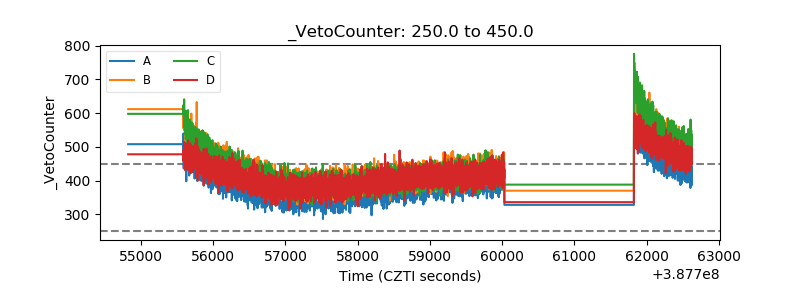 |