| Param | Original file | Final file |
|---|---|---|
| Filename | modeM0/AS1A11_099T01_9000005068_35400cztM0_level2.evt | modeM0/AS1A11_099T01_9000005068_35400cztM0_level2_quad_clean.evt |
| Size (bytes) | 1,016,628,480 | 73,416,960 |
| Size | 969.5 MB | 70.0 MB |
| Events in quadrant A | 3,152,157 | 538,688 |
| Events in quadrant B | 14,255,092 | 258,699 |
| Events in quadrant C | 3,760,881 | 524,090 |
| Events in quadrant D | 9,167,821 | 430,441 |
| Mode M9 | |||
|---|---|---|---|
| Quadrant | BADHDUFLAG | Total packets | Discarded packets |
| A | 0 | 13 | 0 |
| B | 0 | 13 | 0 |
| C | 0 | 13 | 0 |
| D | 0 | 13 | 0 |
| Mode M0 | |||
|---|---|---|---|
| Quadrant | BADHDUFLAG | Total packets | Discarded packets |
| A | 0 | 13823 | 1 |
| B | 0 | 46875 | 1 |
| C | 0 | 15351 | 1 |
| D | 0 | 31863 | 1 |
| Mode SS | |||
|---|---|---|---|
| Quadrant | BADHDUFLAG | Total packets | Discarded packets |
| A | 0 | 138 | 0 |
| B | 0 | 138 | 0 |
| C | 0 | 138 | 0 |
| D | 0 | 138 | 0 |
| Quadrant | Total seconds | Saturated seconds | Saturation percentage |
|---|---|---|---|
| A | 6716 | 9 | 0.134008% |
| B | 6716 | 5152 | 76.712329% |
| C | 6716 | 139 | 2.069684% |
| D | 6716 | 1783 | 26.548541% |
Noise dominated data is calculated using 1-second bins in cleaned event files. If a bin has >2000 counts, and if more than 50% of those come from <1% of pixels, then it is considered to be noise-dominated and hence unusable.
| Quadrant | # 1 sec bins | Bins with >0 counts | Bins with >2000 counts | High rate bins dominated by noise | Noise dominated (total time) | Noise dominated (detector-on time) | Marked lightcurve |
|---|---|---|---|---|---|---|---|
| A | 8057 | 6717 | 1 | 1 | 0.01% | 0.01% | 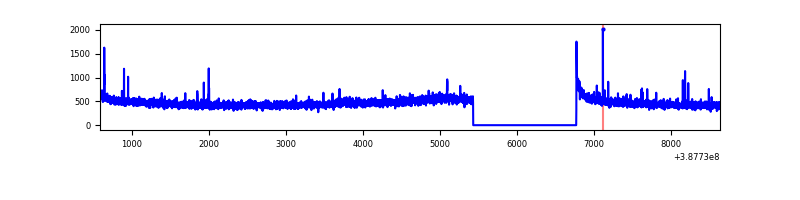 |
| B | 8057 | 6717 | 4529 | 4529 | 56.21% | 67.43% | 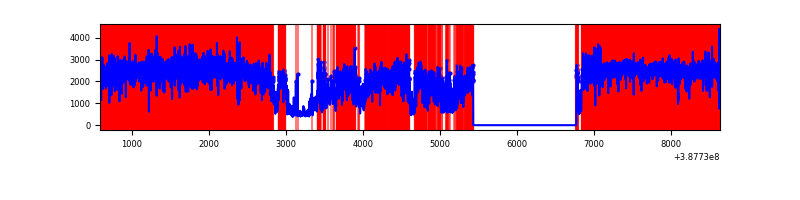 |
| C | 8057 | 6717 | 117 | 117 | 1.45% | 1.74% | 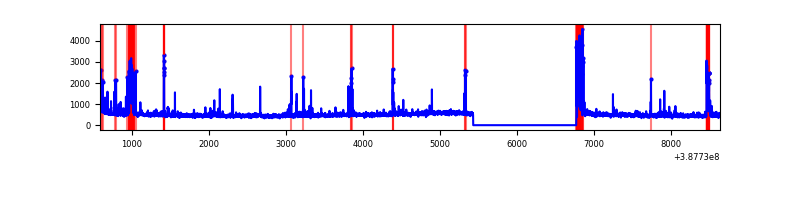 |
| D | 8057 | 6717 | 1462 | 1462 | 18.15% | 21.77% | 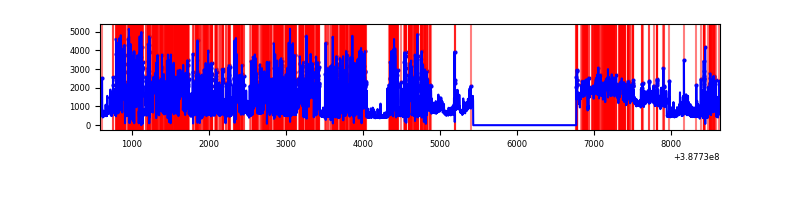 |
Top three noisy pixels from each quadrant. If the there are fewer than three noisy pixels in the level2.evt file, extra rows are filled as -1
| Pixel properties | Quadrant properties | ||||||
|---|---|---|---|---|---|---|---|
| Quadrant | DetID | PixID | Counts | Sigma | Mean | Median | Sigma |
| A | 10 | 83 | 128782 | 824.02 | 767 | 751 | 155.4 |
| A | 13 | 6 | 25449 | 158.96 | 767 | 751 | 155.4 |
| A | 9 | 143 | 17136 | 105.46 | 767 | 751 | 155.4 |
| B | 4 | 251 | 4782608 | 50085.77 | 495 | 482 | 95.5 |
| B | 5 | 14 | 2392734 | 25055.34 | 495 | 482 | 95.5 |
| B | 5 | 31 | 2312309 | 24213.0 | 495 | 482 | 95.5 |
| C | 15 | 214 | 276772 | 1595.81 | 740 | 746 | 173.0 |
| C | 0 | 10 | 221206 | 1274.56 | 740 | 746 | 173.0 |
| C | 3 | 233 | 202824 | 1168.29 | 740 | 746 | 173.0 |
| D | 7 | 80 | 4739213 | 29139.71 | 653 | 634 | 162.6 |
| D | 13 | 249 | 350122 | 2149.16 | 653 | 634 | 162.6 |
| D | 12 | 233 | 327491 | 2009.99 | 653 | 634 | 162.6 |
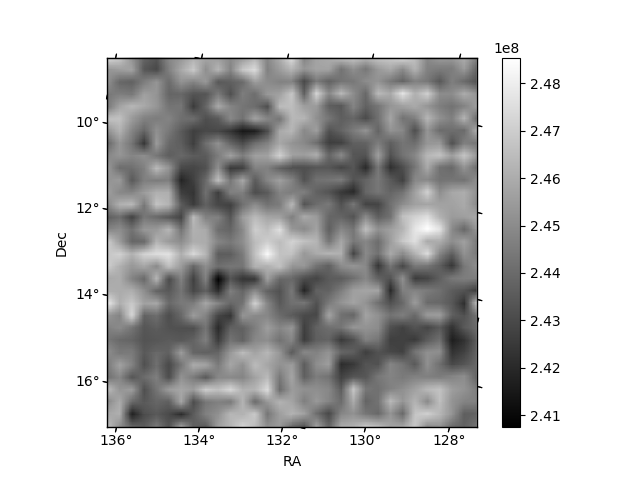
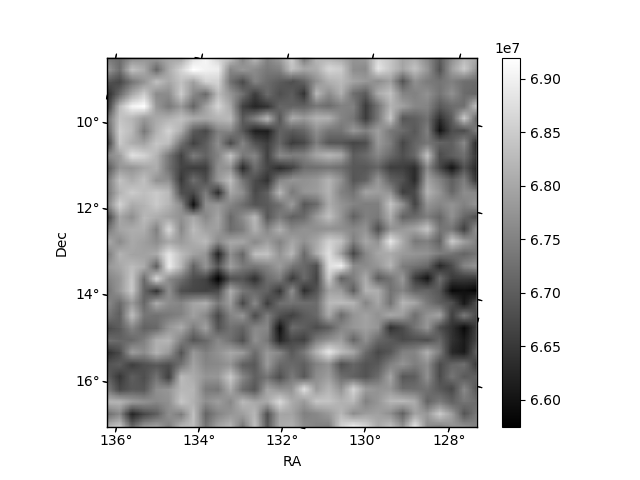
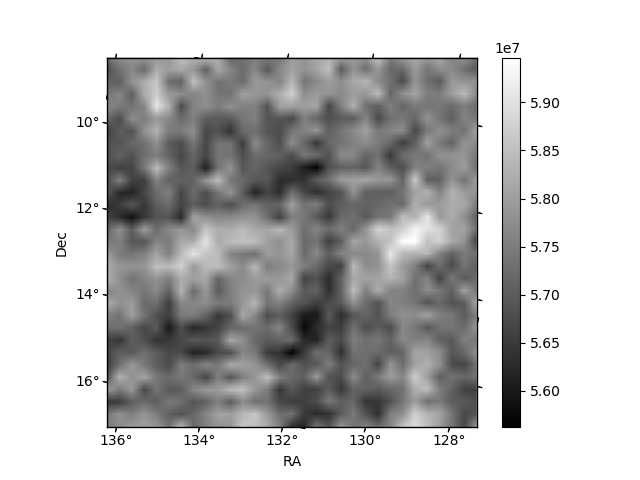
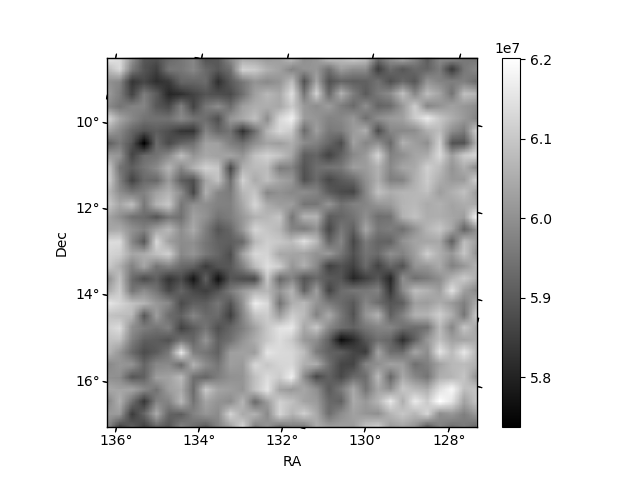
Histogram calculated using DETX and DETY for each event in the final _common_clean file
| Quadrant A | 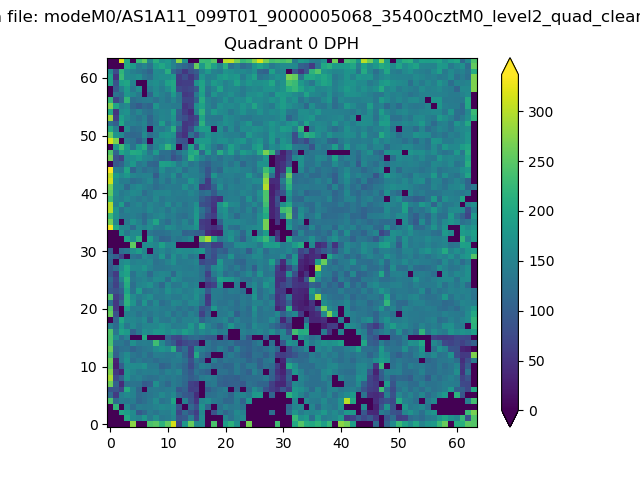 |
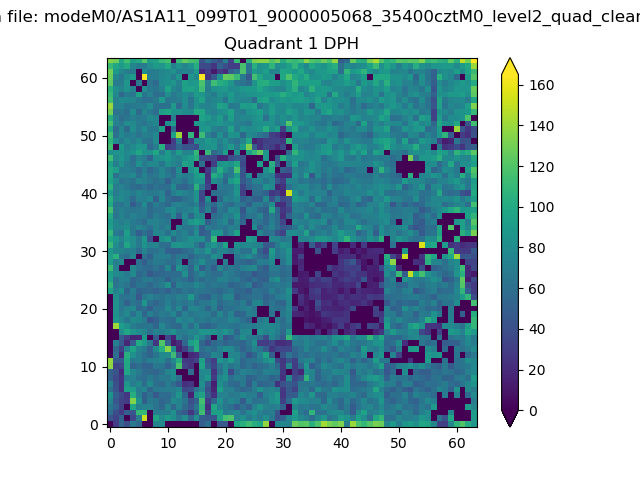 |
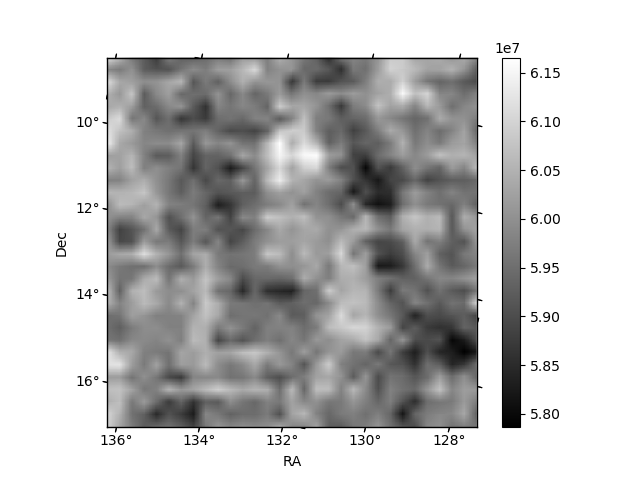
Quadrant B |
|---|---|---|---|
| Quadrant D | 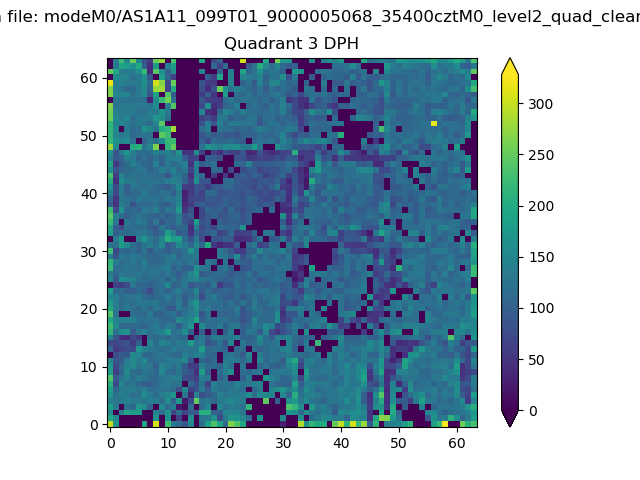 |
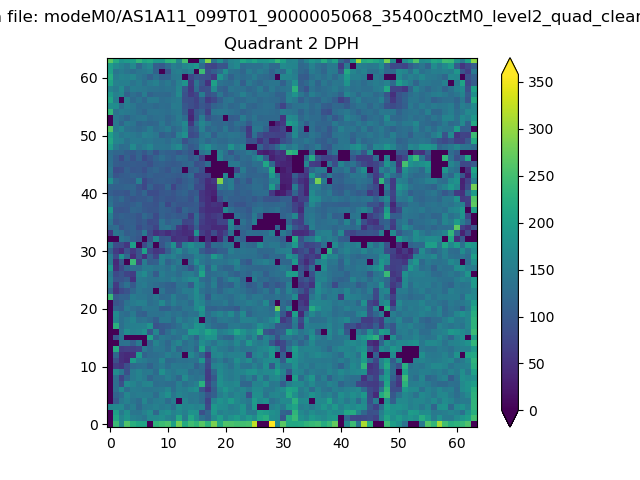 |
Quadrant C |
| Plot type | Count rate plots | Images |
|---|---|---|
| Comparison with Poisson distribution Blue bars denote a histogram of data divided into 1 sec bins. Red curve is a Poisson curve with rate = median count rate of data. |
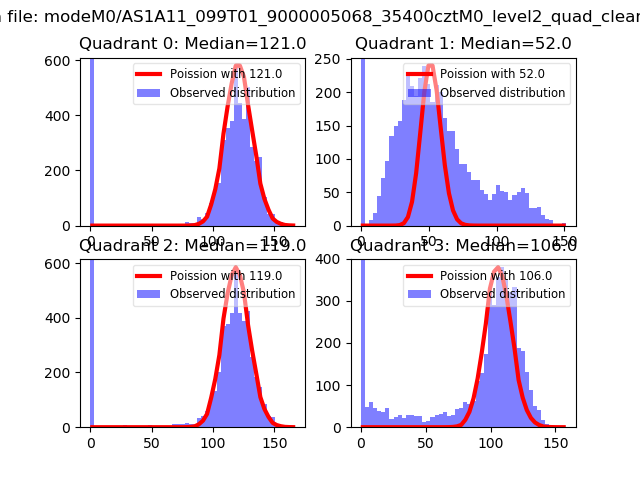 |
 |
| Quadrant-wise count rates Data is divided into 100 sec bins |
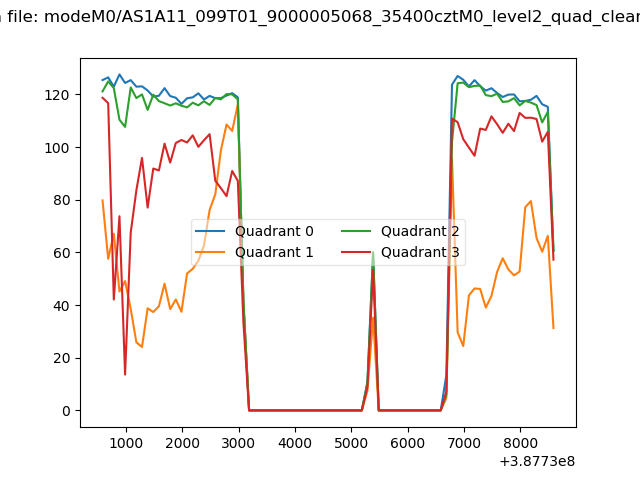 |
|
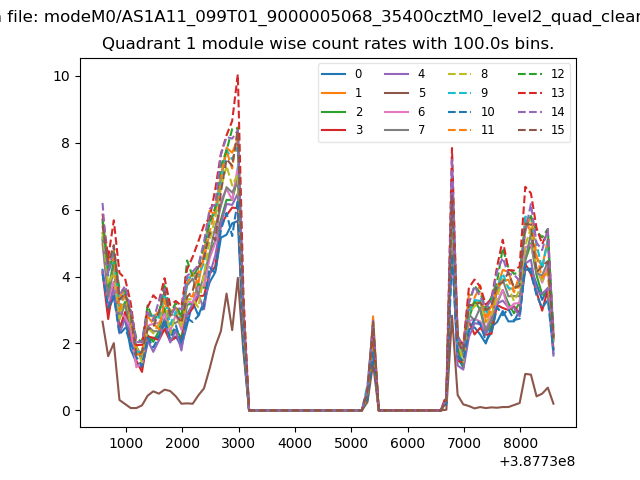
| Module-wise count rates for Quadrant A Data is divided into 100 sec bins |
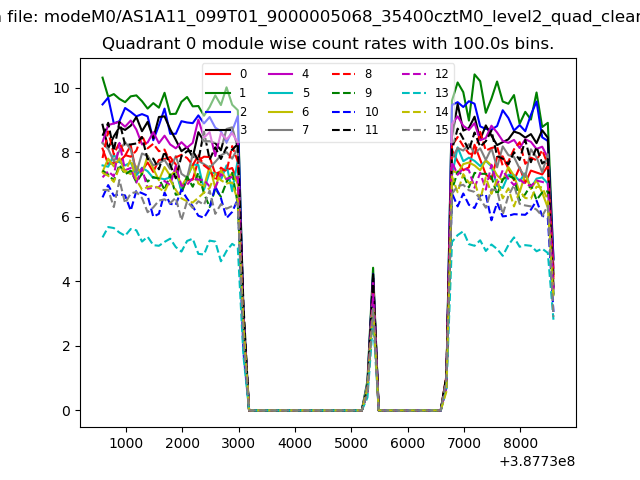 |
 |
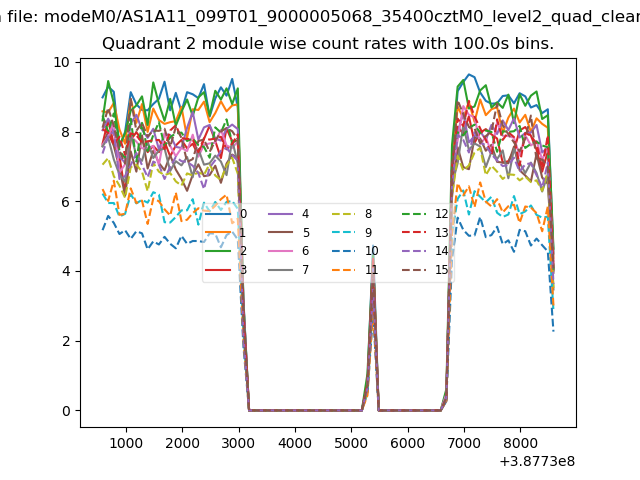
| Module-wise count rates for Quadrant B Data is divided into 100 sec bins |
 |
 |
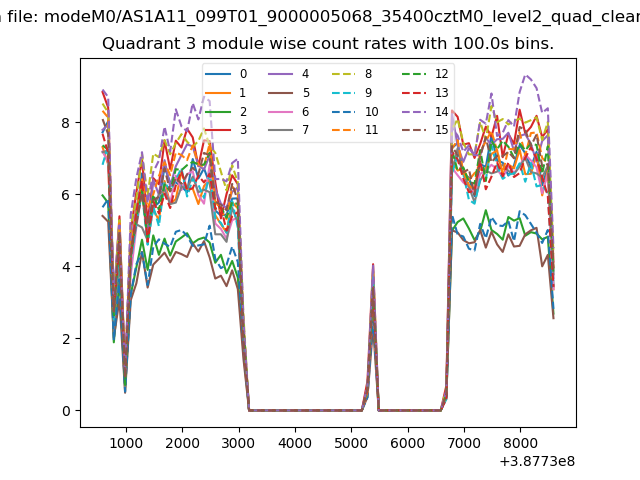
| Module-wise count rates for Quadrant C Data is divided into 100 sec bins |
 |
 |
| Module-wise count rates for Quadrant D Data is divided into 100 sec bins |
 |
 |
| Parameter | Plot |
|---|---|
| CZT HV Monitor | 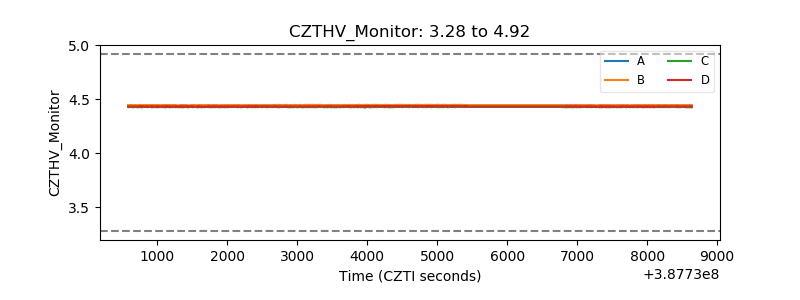 |
| D_VDD | 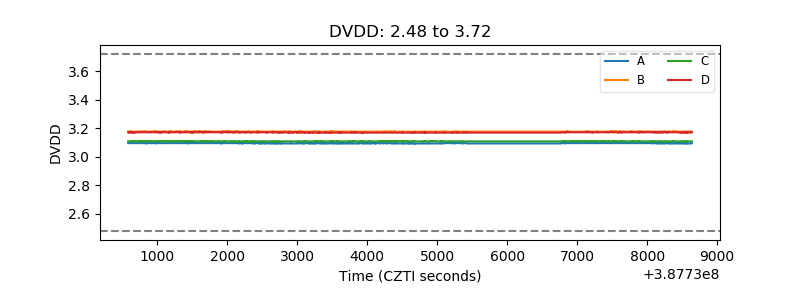 |
| Temperature 1 | 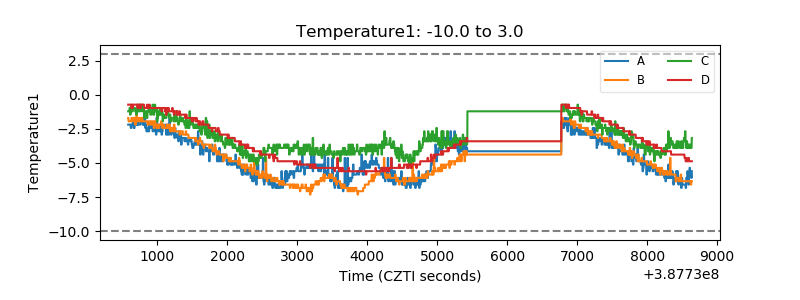 |
| Veto HV Monitor | 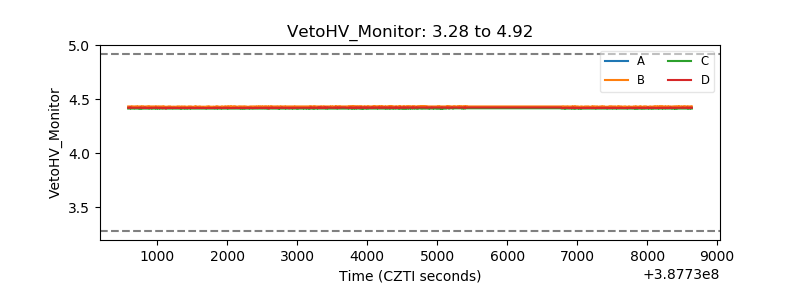 |
| Veto LLD | 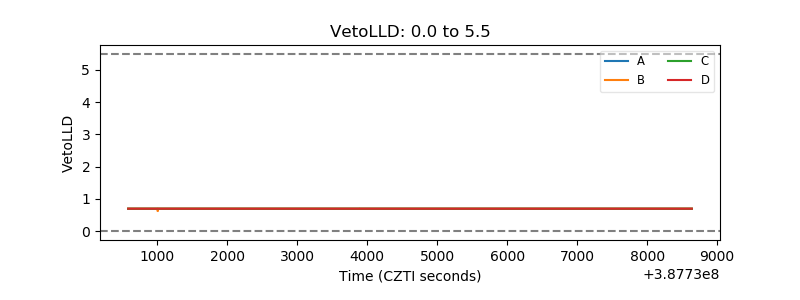 |
| Alpha Counter | 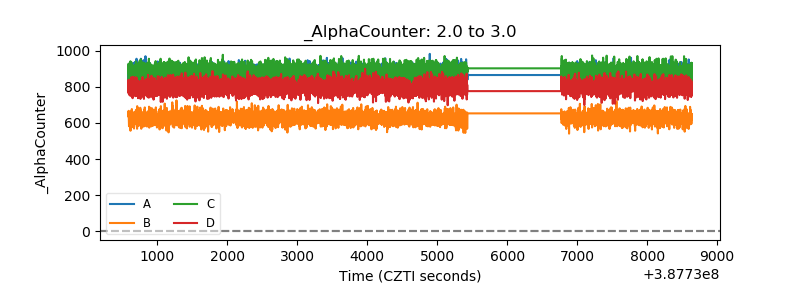 |
| _CPM_Rate | 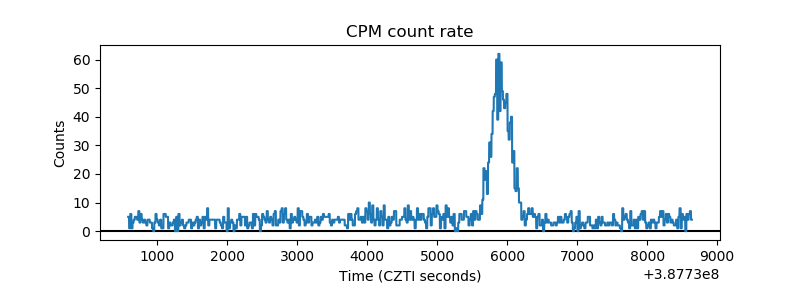 |
| CZT Counter | 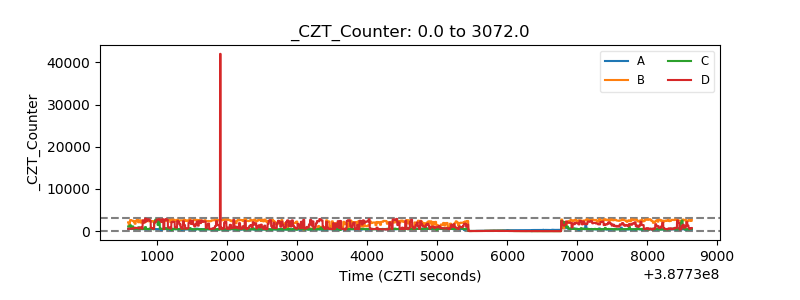 |
| +2.5 Volts monitor | 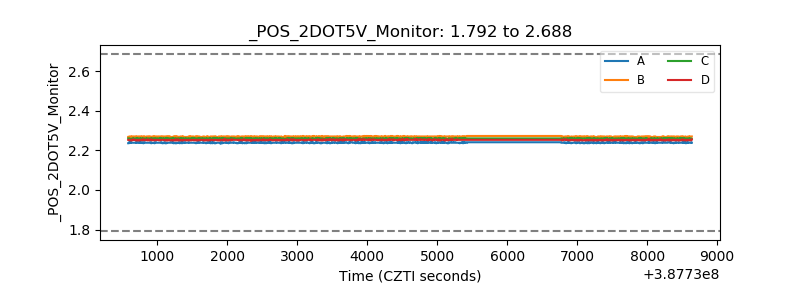 |
| +5 Volts monitor | 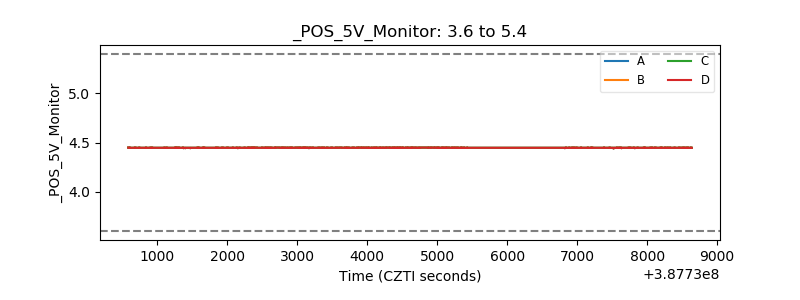 |
| _ROLL_ROT | 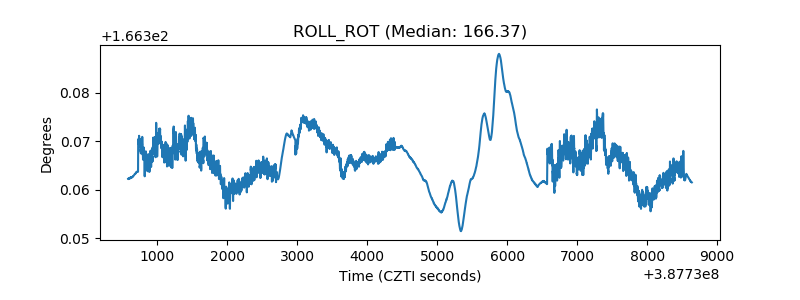 |
| _Roll_DEC | 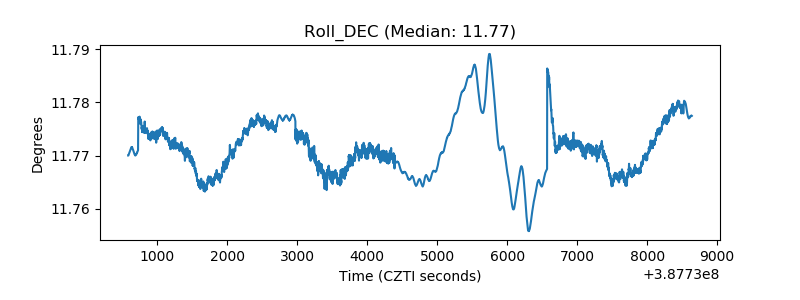 |
| _Roll_RA | 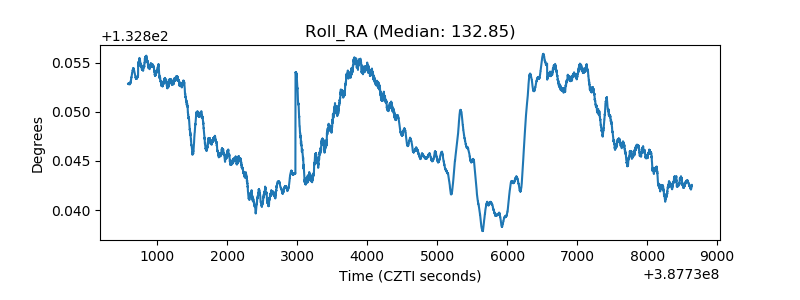 |
| Veto Counter | 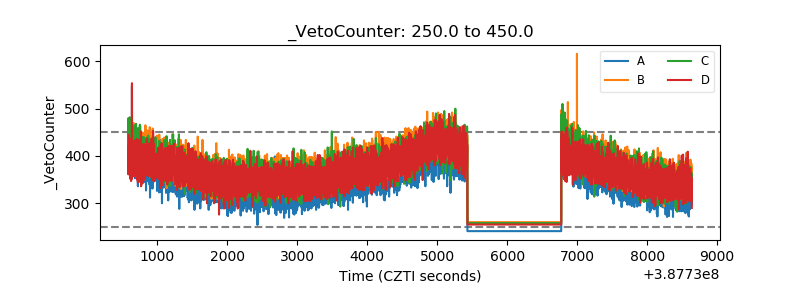 |