| Param | Original file | Final file |
|---|---|---|
| Filename | modeM0/AS1A11_099T01_9000005068_35387cztM0_level2.evt | modeM0/AS1A11_099T01_9000005068_35387cztM0_level2_quad_clean.evt |
| Size (bytes) | 2,690,147,520 | 185,662,080 |
| Size | 2.5 GB | 177.1 MB |
| Events in quadrant A | 8,660,243 | 1,322,169 |
| Events in quadrant B | 35,790,896 | 730,627 |
| Events in quadrant C | 10,446,925 | 1,281,882 |
| Events in quadrant D | 25,342,376 | 1,016,592 |
| Mode M9 | |||
|---|---|---|---|
| Quadrant | BADHDUFLAG | Total packets | Discarded packets |
| A | 0 | 55 | 0 |
| B | 0 | 56 | 0 |
| C | 0 | 56 | 0 |
| D | 0 | 56 | 0 |
| Mode M0 | |||
|---|---|---|---|
| Quadrant | BADHDUFLAG | Total packets | Discarded packets |
| A | 0 | 37919 | 5 |
| B | 0 | 118785 | 4 |
| C | 0 | 42224 | 4 |
| D | 0 | 87738 | 4 |
| Mode SS | |||
|---|---|---|---|
| Quadrant | BADHDUFLAG | Total packets | Discarded packets |
| A | 0 | 372 | 0 |
| B | 0 | 372 | 0 |
| C | 0 | 372 | 0 |
| D | 0 | 372 | 0 |
| Quadrant | Total seconds | Saturated seconds | Saturation percentage |
|---|---|---|---|
| A | 18377 | 37 | 0.201339% |
| B | 18377 | 12398 | 67.464766% |
| C | 18377 | 285 | 1.550852% |
| D | 18377 | 5176 | 28.165642% |
Noise dominated data is calculated using 1-second bins in cleaned event files. If a bin has >2000 counts, and if more than 50% of those come from <1% of pixels, then it is considered to be noise-dominated and hence unusable.
| Quadrant | # 1 sec bins | Bins with >0 counts | Bins with >2000 counts | High rate bins dominated by noise | Noise dominated (total time) | Noise dominated (detector-on time) | Marked lightcurve |
|---|---|---|---|---|---|---|---|
| A | 31371 | 18381 | 11 | 11 | 0.04% | 0.06% | 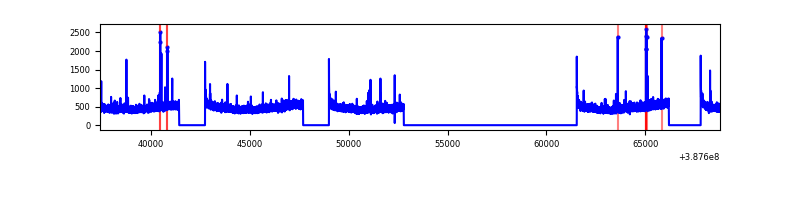 |
| B | 31371 | 18381 | 10324 | 10324 | 32.91% | 56.17% | 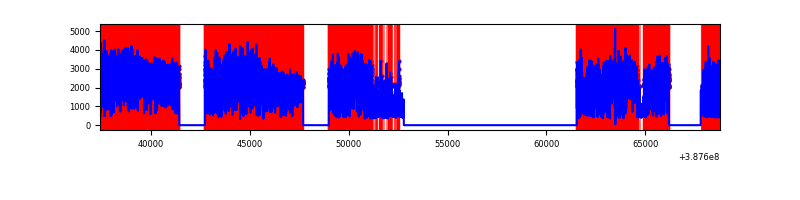 |
| C | 31371 | 18381 | 205 | 205 | 0.65% | 1.12% | 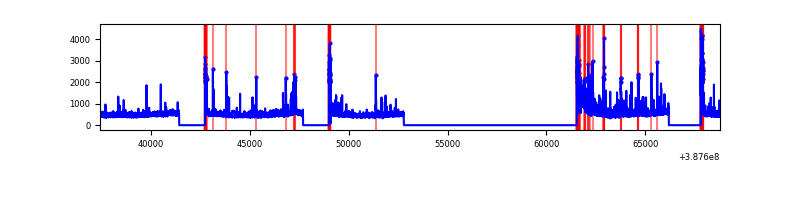 |
| D | 31371 | 18381 | 5430 | 5430 | 17.31% | 29.54% | 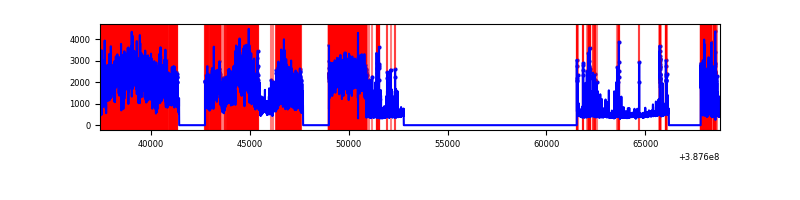 |
Top three noisy pixels from each quadrant. If the there are fewer than three noisy pixels in the level2.evt file, extra rows are filled as -1
| Pixel properties | Quadrant properties | ||||||
|---|---|---|---|---|---|---|---|
| Quadrant | DetID | PixID | Counts | Sigma | Mean | Median | Sigma |
| A | 10 | 83 | 326938 | 760.09 | 2117 | 2073 | 427.4 |
| A | 9 | 143 | 76661 | 174.51 | 2117 | 2073 | 427.4 |
| A | 13 | 6 | 46623 | 104.23 | 2117 | 2073 | 427.4 |
| B | 4 | 251 | 28617838 | 109829.92 | 1371 | 1335 | 260.6 |
| B | 5 | 236 | 642063 | 2459.11 | 1371 | 1335 | 260.6 |
| B | 5 | 172 | 545416 | 2088.18 | 1371 | 1335 | 260.6 |
| C | 0 | 10 | 892178 | 1879.13 | 2049 | 2067 | 473.7 |
| C | 15 | 214 | 745074 | 1568.58 | 2049 | 2067 | 473.7 |
| C | 0 | 207 | 601008 | 1264.44 | 2049 | 2067 | 473.7 |
| D | 7 | 80 | 14104064 | 30859.99 | 1853 | 1798 | 457.0 |
| D | 12 | 235 | 1376035 | 3007.24 | 1853 | 1798 | 457.0 |
| D | 10 | 118 | 752323 | 1642.37 | 1853 | 1798 | 457.0 |
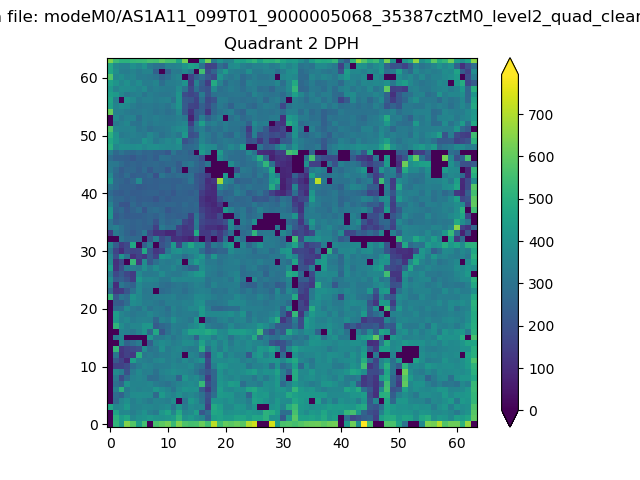
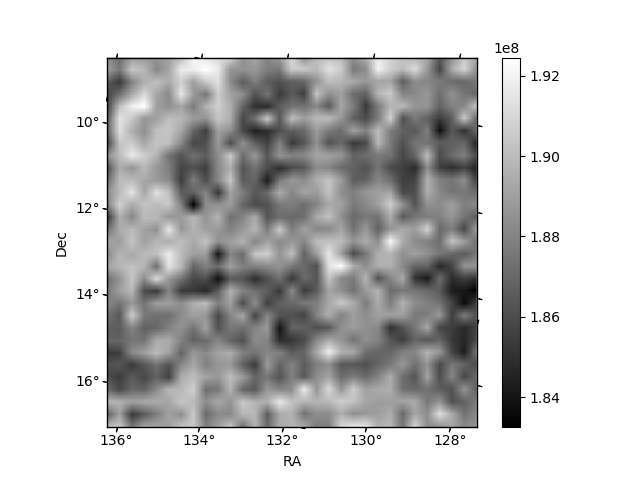
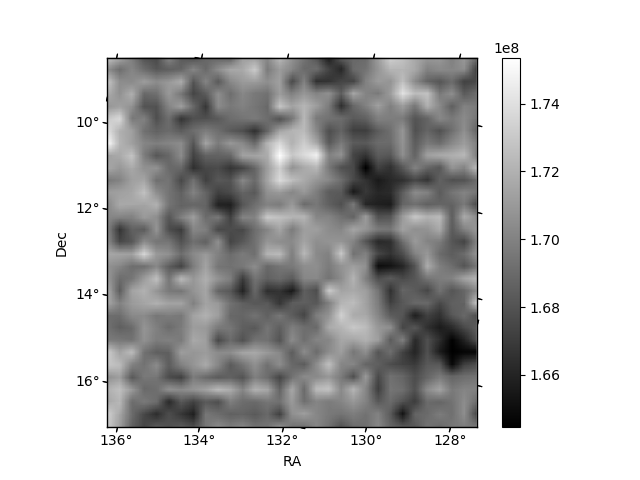
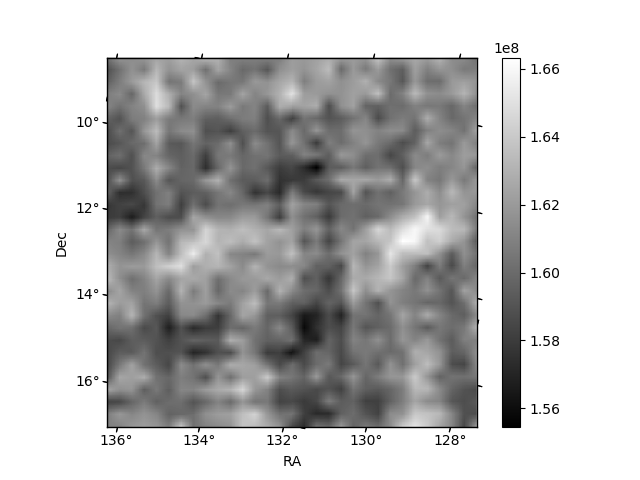
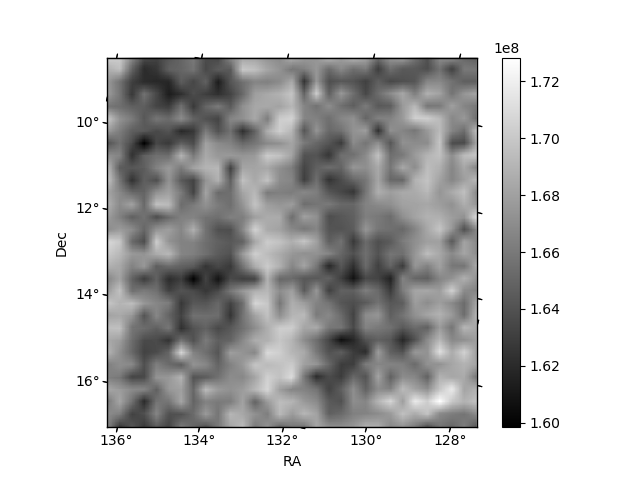
Histogram calculated using DETX and DETY for each event in the final _common_clean file
| Quadrant A | 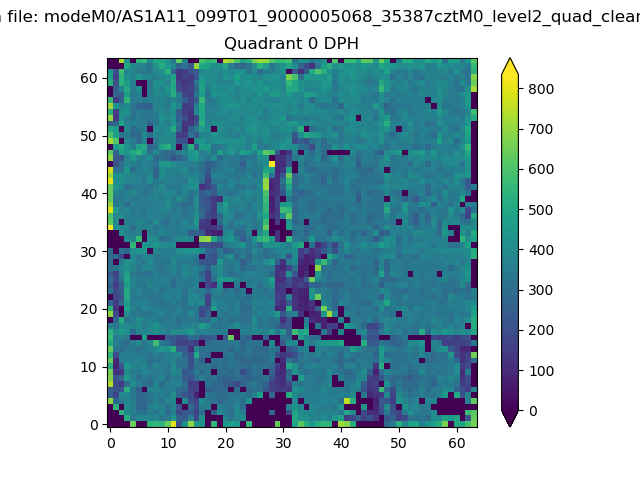 |
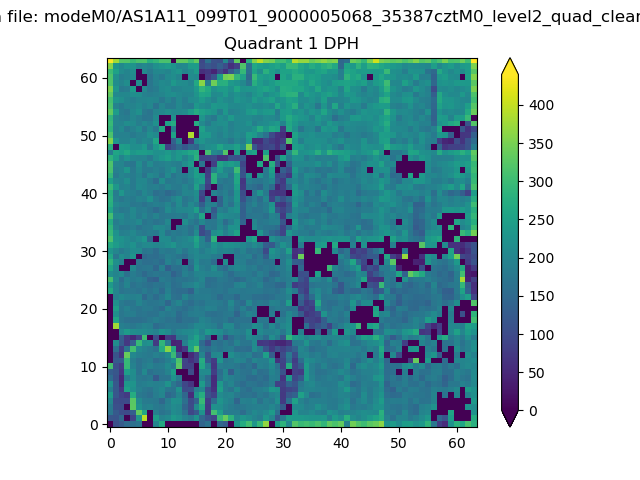 |
Quadrant B |
|---|---|---|---|
| Quadrant D | 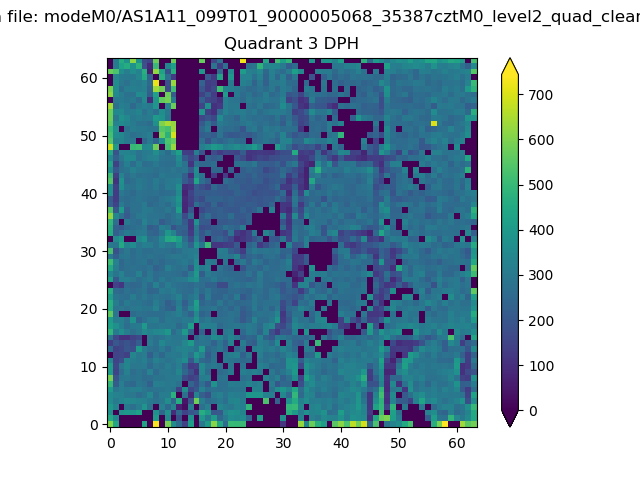 |
 |
Quadrant C |
| Plot type | Count rate plots | Images |
|---|---|---|
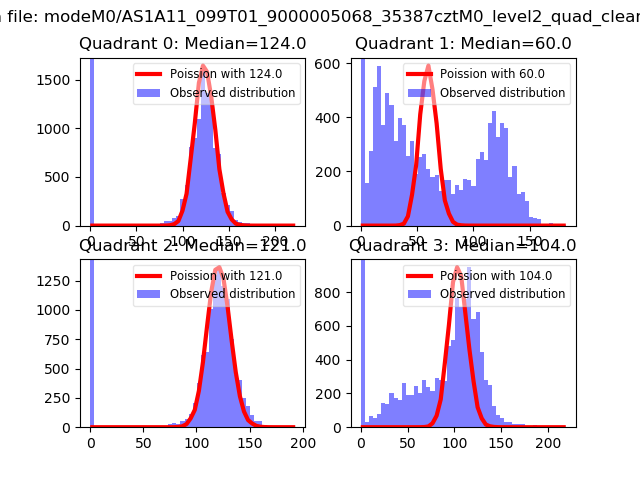
| Comparison with Poisson distribution Blue bars denote a histogram of data divided into 1 sec bins. Red curve is a Poisson curve with rate = median count rate of data. |
 |
 |
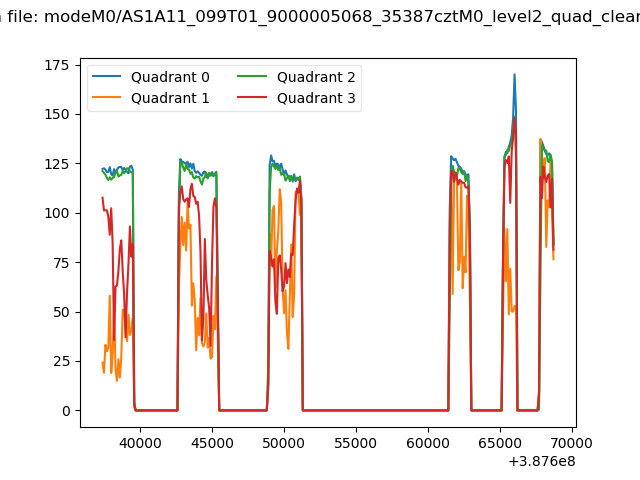
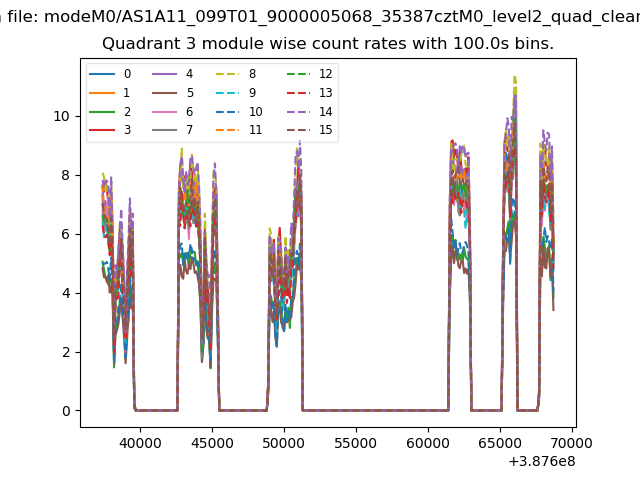
| Quadrant-wise count rates Data is divided into 100 sec bins |
 |
|
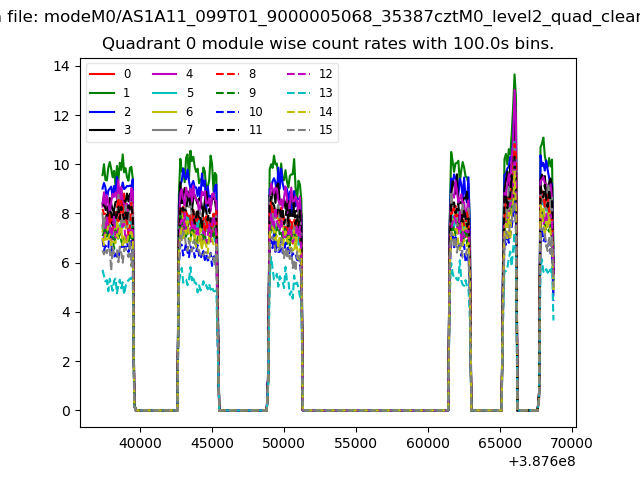
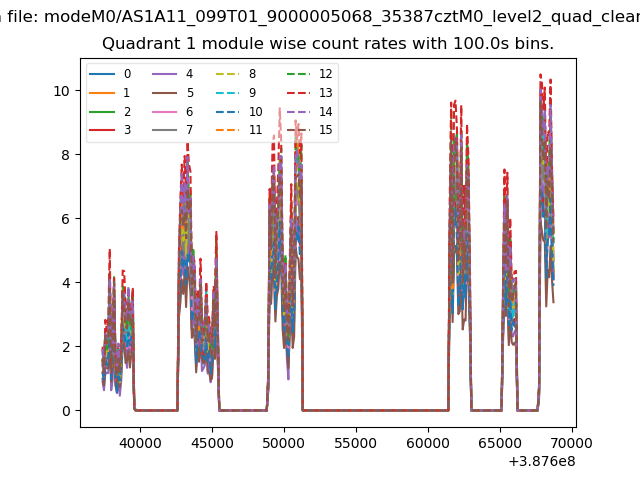
| Module-wise count rates for Quadrant A Data is divided into 100 sec bins |
 |
 |
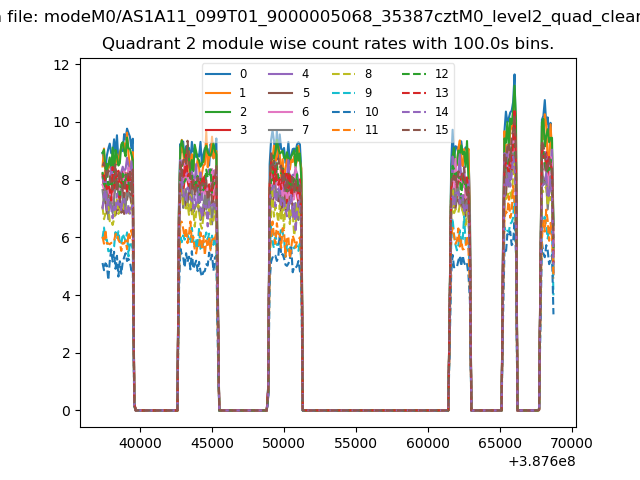
| Module-wise count rates for Quadrant B Data is divided into 100 sec bins |
 |
 |
| Module-wise count rates for Quadrant C Data is divided into 100 sec bins |
 |
 |
| Module-wise count rates for Quadrant D Data is divided into 100 sec bins |
 |
 |
| Parameter | Plot |
|---|---|
| CZT HV Monitor | 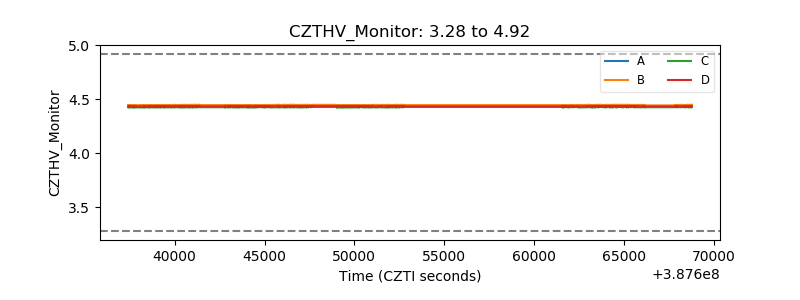 |
| D_VDD | 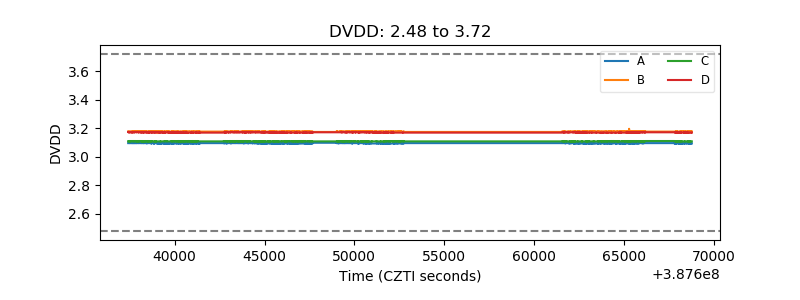 |
| Temperature 1 | 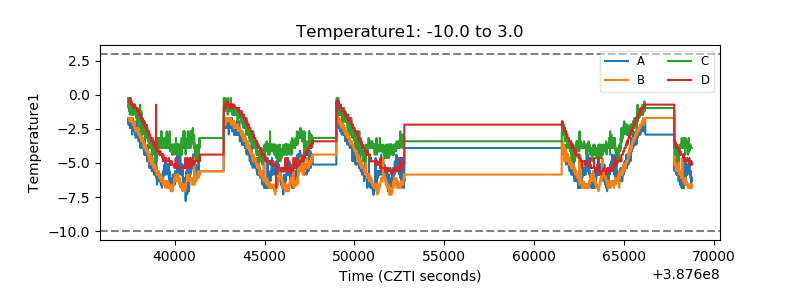 |
| Veto HV Monitor | 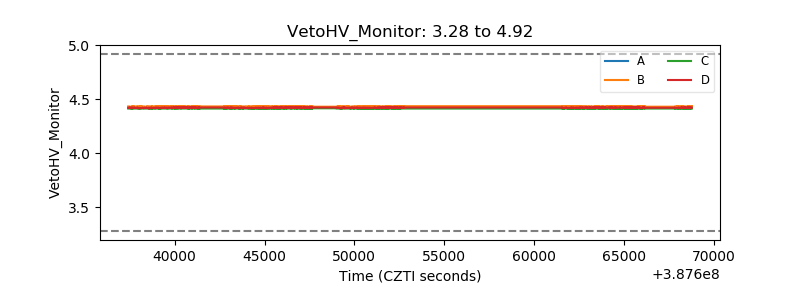 |
| Veto LLD | 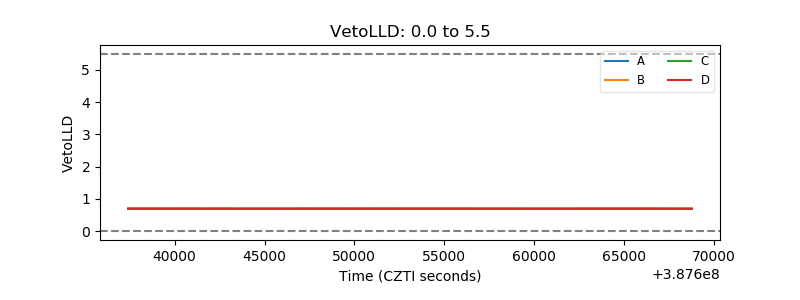 |
| Alpha Counter | 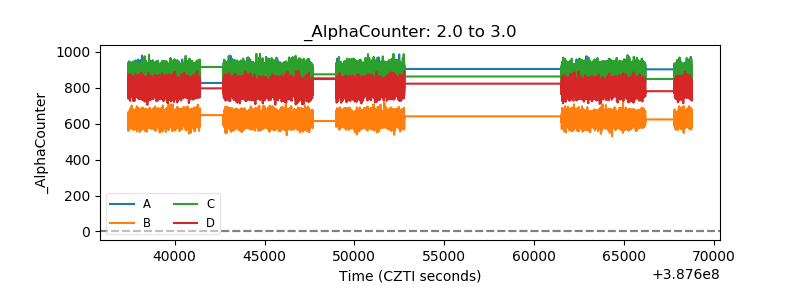 |
| _CPM_Rate | 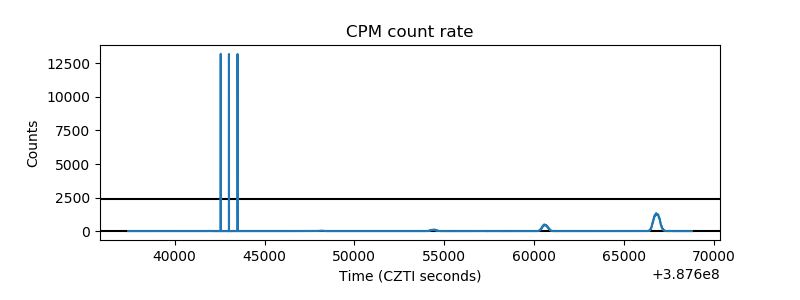 |
| CZT Counter | 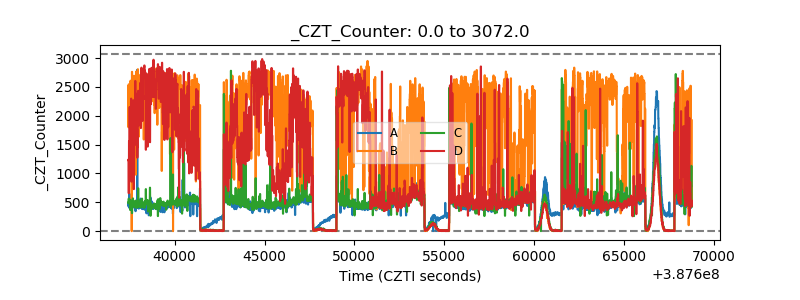 |
| +2.5 Volts monitor | 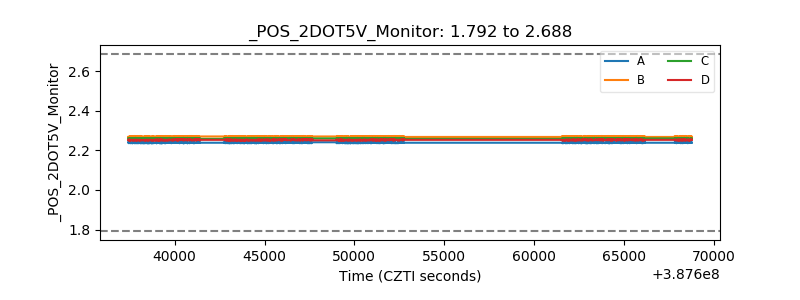 |
| +5 Volts monitor | 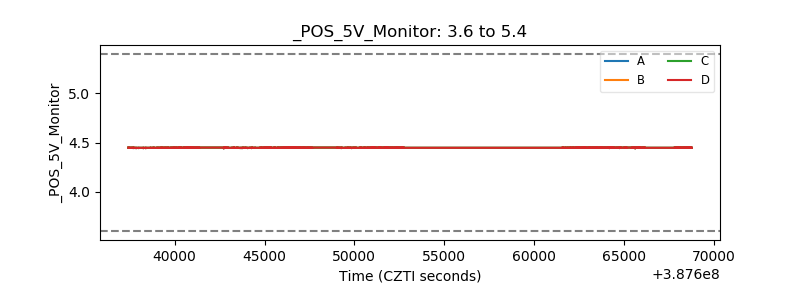 |
| _ROLL_ROT | 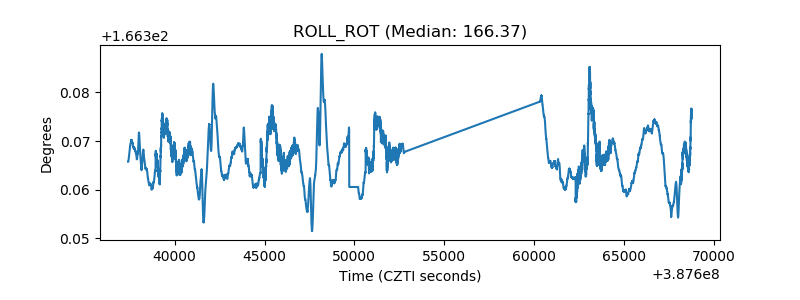 |
| _Roll_DEC | 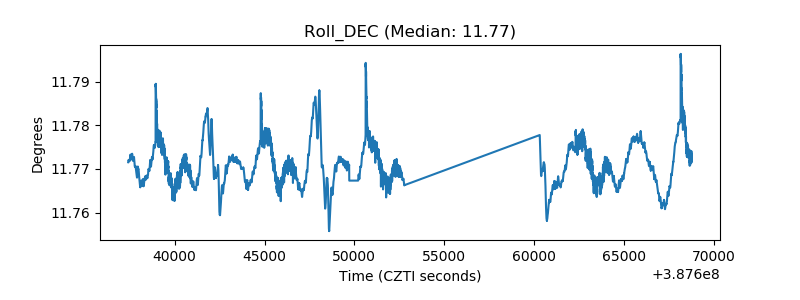 |
| _Roll_RA | 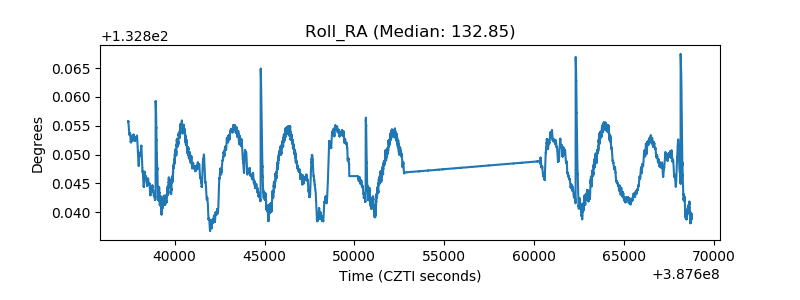 |
| Veto Counter | 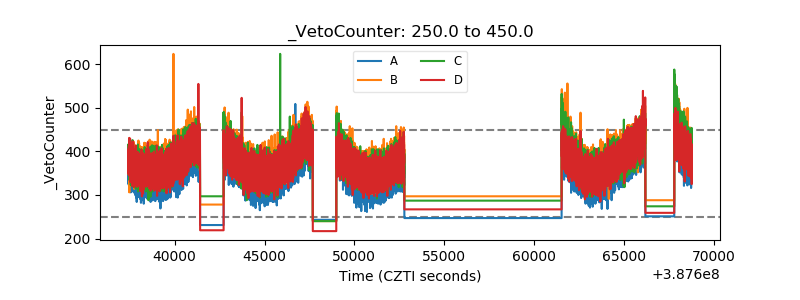 |