| Param | Original file | Final file |
|---|---|---|
| Filename | modeM0/AS1A11_099T01_9000005068_35381cztM0_level2.evt | modeM0/AS1A11_099T01_9000005068_35381cztM0_level2_quad_clean.evt |
| Size (bytes) | 830,232,000 | 76,919,040 |
| Size | 791.8 MB | 73.4 MB |
| Events in quadrant A | 2,748,029 | 565,301 |
| Events in quadrant B | 9,288,903 | 374,486 |
| Events in quadrant C | 3,234,659 | 553,589 |
| Events in quadrant D | 9,509,145 | 456,489 |
| Mode M9 | |||
|---|---|---|---|
| Quadrant | BADHDUFLAG | Total packets | Discarded packets |
| A | 0 | 27 | 0 |
| B | 0 | 27 | 0 |
| C | 0 | 27 | 0 |
| D | 0 | 28 | 0 |
| Mode M0 | |||
|---|---|---|---|
| Quadrant | BADHDUFLAG | Total packets | Discarded packets |
| A | 0 | 11409 | 3 |
| B | 0 | 31284 | 2 |
| C | 0 | 12705 | 2 |
| D | 0 | 31952 | 2 |
| Mode SS | |||
|---|---|---|---|
| Quadrant | BADHDUFLAG | Total packets | Discarded packets |
| A | 0 | 112 | 0 |
| B | 0 | 112 | 0 |
| C | 0 | 112 | 0 |
| D | 0 | 112 | 0 |
| Quadrant | Total seconds | Saturated seconds | Saturation percentage |
|---|---|---|---|
| A | 5384 | 19 | 0.352897% |
| B | 5384 | 2878 | 53.454681% |
| C | 5384 | 128 | 2.377415% |
| D | 5384 | 1876 | 34.843982% |
Noise dominated data is calculated using 1-second bins in cleaned event files. If a bin has >2000 counts, and if more than 50% of those come from <1% of pixels, then it is considered to be noise-dominated and hence unusable.
| Quadrant | # 1 sec bins | Bins with >0 counts | Bins with >2000 counts | High rate bins dominated by noise | Noise dominated (total time) | Noise dominated (detector-on time) | Marked lightcurve |
|---|---|---|---|---|---|---|---|
| A | 7117 | 5385 | 9 | 9 | 0.13% | 0.17% | 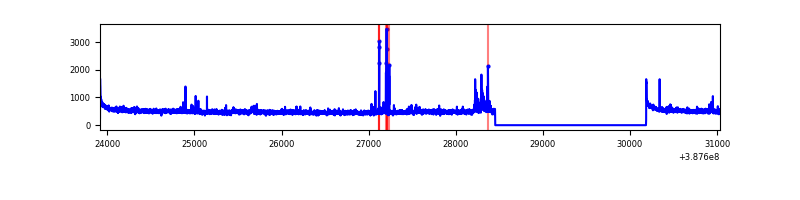 |
| B | 7117 | 5385 | 2517 | 2517 | 35.37% | 46.74% | 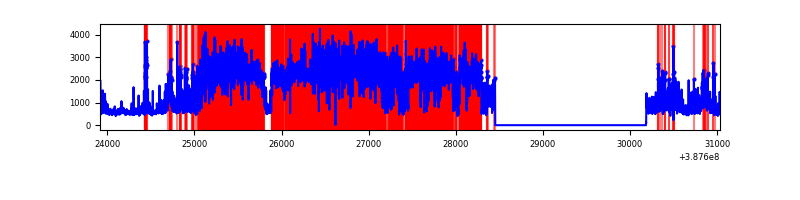 |
| C | 7117 | 5385 | 88 | 88 | 1.24% | 1.63% | 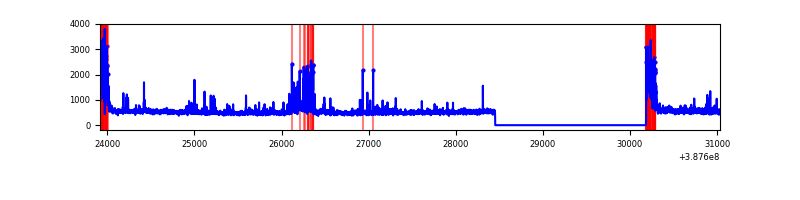 |
| D | 7117 | 5385 | 2104 | 2104 | 29.56% | 39.07% | 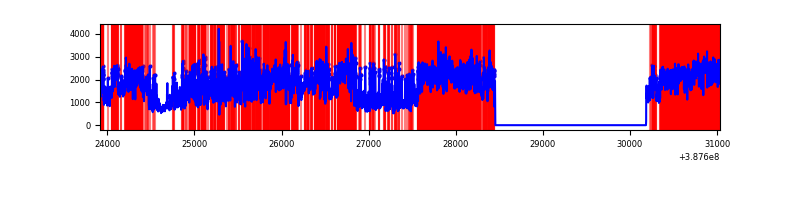 |
Top three noisy pixels from each quadrant. If the there are fewer than three noisy pixels in the level2.evt file, extra rows are filled as -1
| Pixel properties | Quadrant properties | ||||||
|---|---|---|---|---|---|---|---|
| Quadrant | DetID | PixID | Counts | Sigma | Mean | Median | Sigma |
| A | 10 | 83 | 122713 | 933.2 | 644 | 632 | 130.8 |
| A | 14 | 254 | 63255 | 478.7 | 644 | 632 | 130.8 |
| A | 15 | 237 | 31107 | 232.95 | 644 | 632 | 130.8 |
| B | 4 | 251 | 5065097 | 54956.04 | 472 | 461 | 92.2 |
| B | 5 | 14 | 549597 | 5958.64 | 472 | 461 | 92.2 |
| B | 5 | 31 | 523703 | 5677.67 | 472 | 461 | 92.2 |
| C | 0 | 10 | 512637 | 3587.92 | 614 | 618 | 142.7 |
| C | 15 | 214 | 226183 | 1580.62 | 614 | 618 | 142.7 |
| C | 3 | 233 | 79122 | 550.11 | 614 | 618 | 142.7 |
| D | 7 | 80 | 5524167 | 39309.39 | 569 | 552 | 140.5 |
| D | 12 | 235 | 602770 | 4285.75 | 569 | 552 | 140.5 |
| D | 1 | 52 | 400255 | 2844.53 | 569 | 552 | 140.5 |
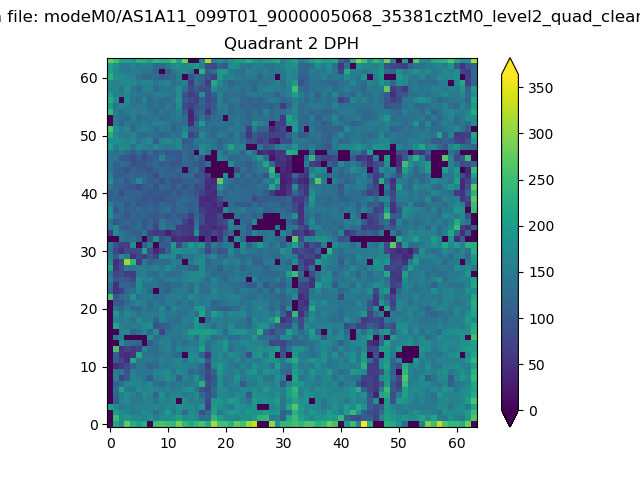
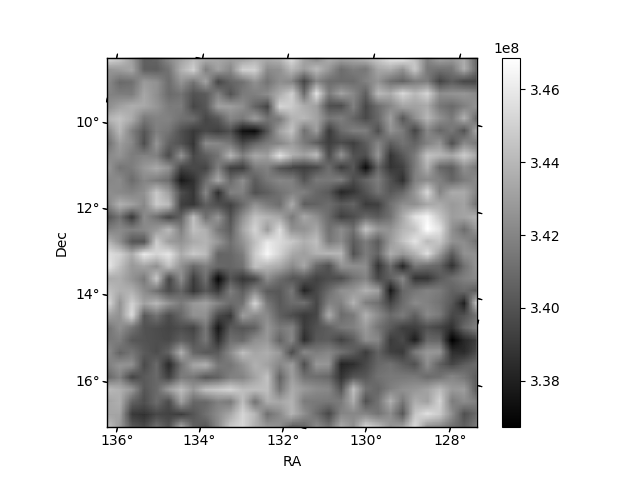
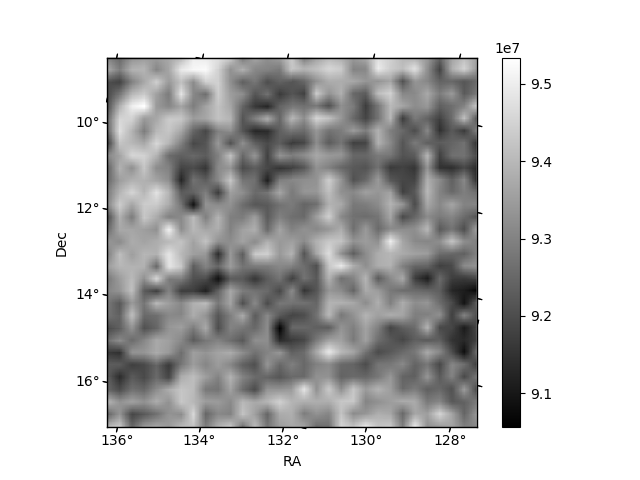
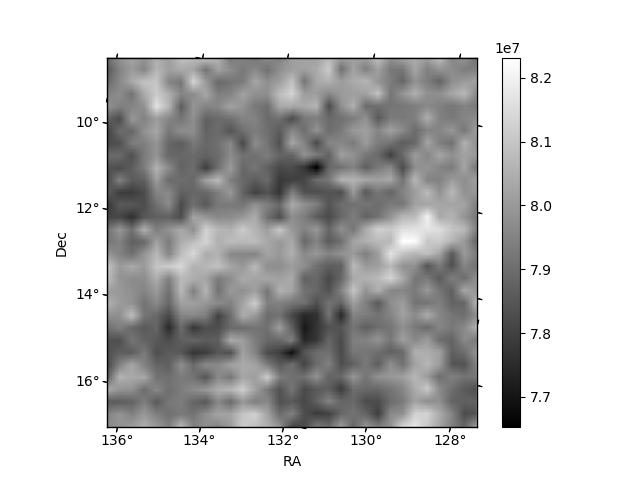
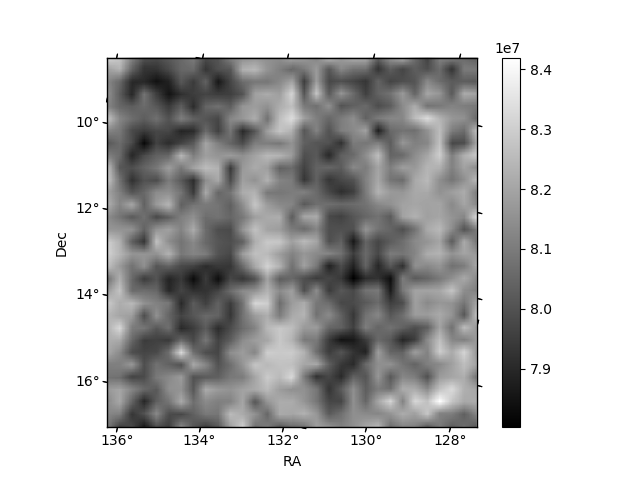
Histogram calculated using DETX and DETY for each event in the final _common_clean file
| Quadrant A | 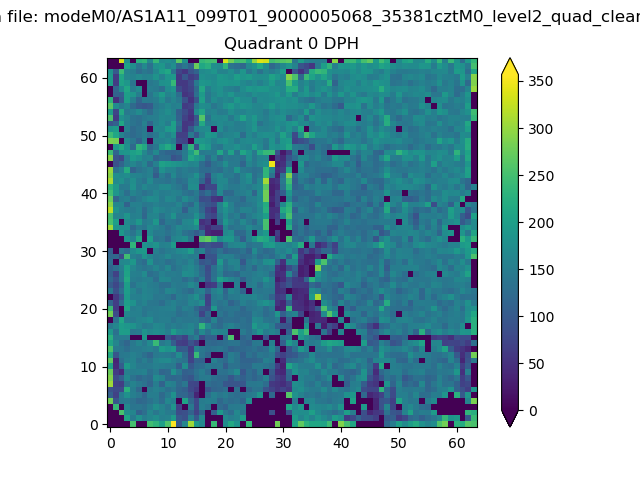 |
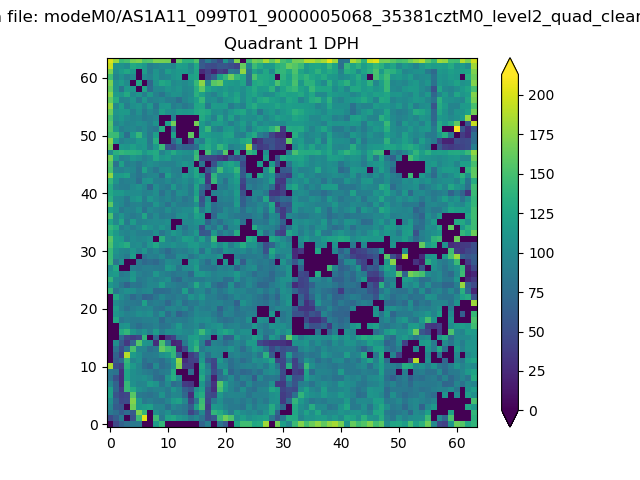 |
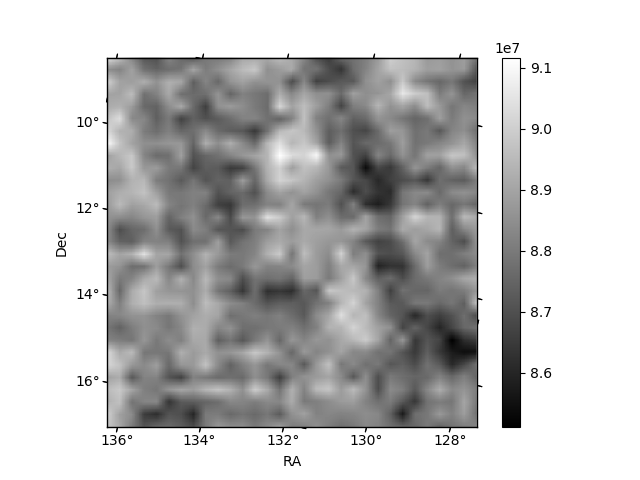
Quadrant B |
|---|---|---|---|
| Quadrant D | 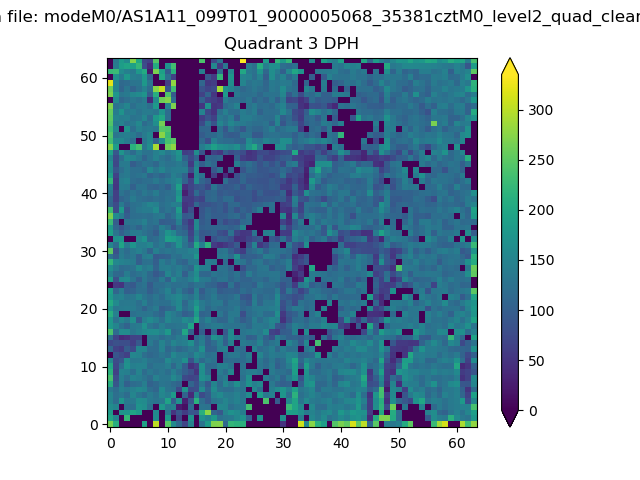 |
 |
Quadrant C |
| Plot type | Count rate plots | Images |
|---|---|---|
| Comparison with Poisson distribution Blue bars denote a histogram of data divided into 1 sec bins. Red curve is a Poisson curve with rate = median count rate of data. |
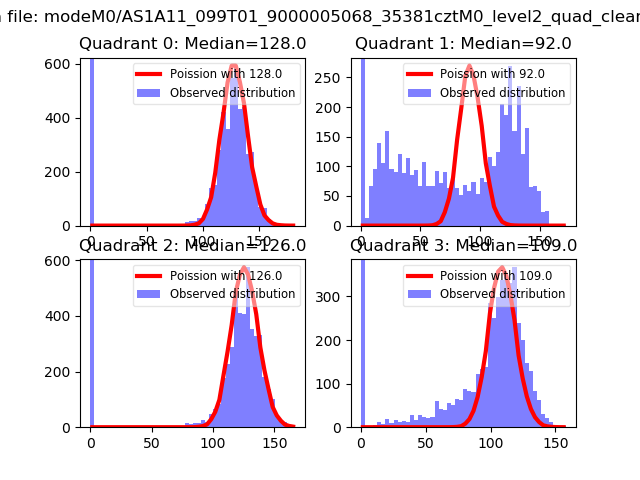 |
 |
| Quadrant-wise count rates Data is divided into 100 sec bins |
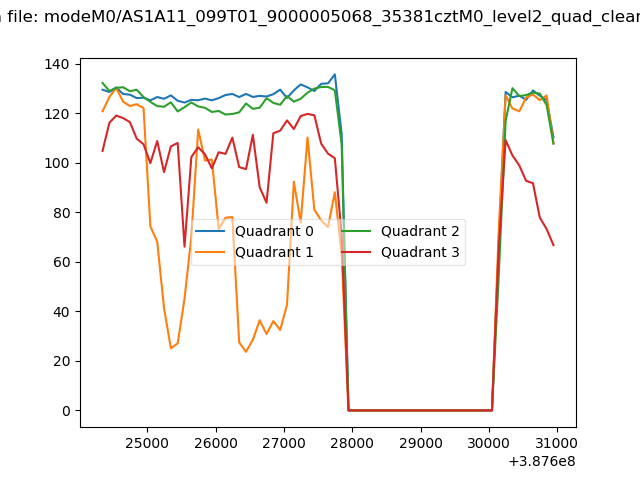 |
|
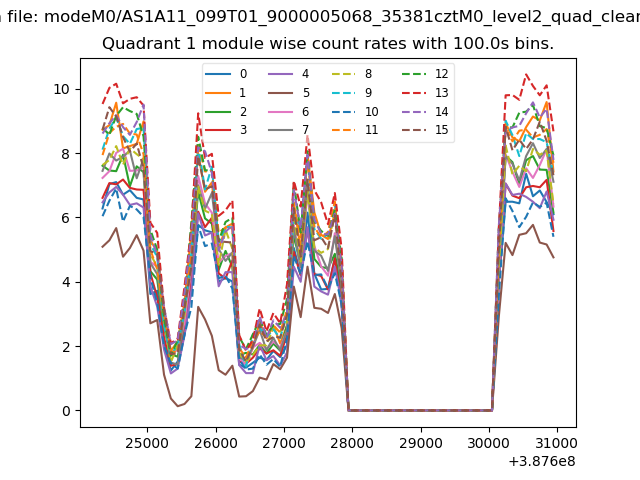
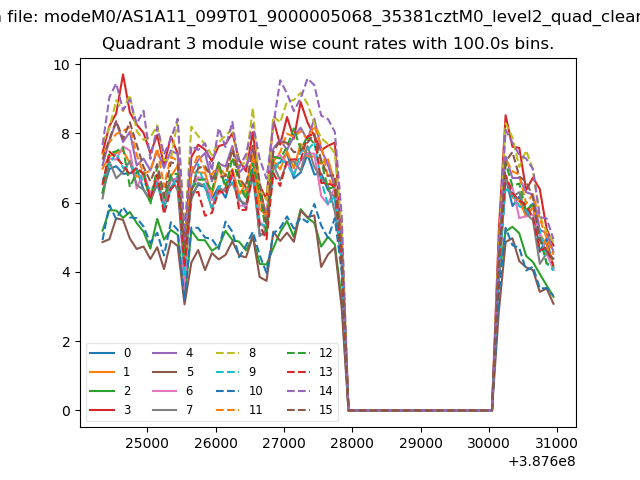
| Module-wise count rates for Quadrant A Data is divided into 100 sec bins |
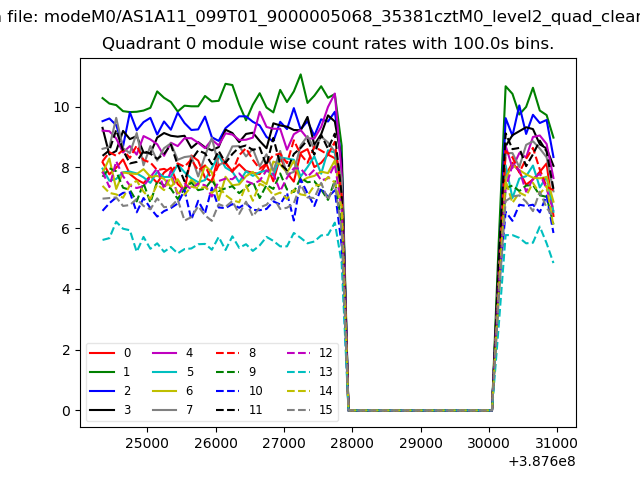 |
 |
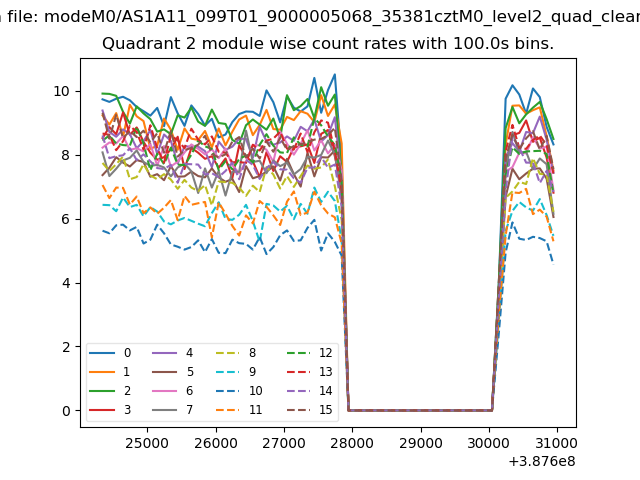
| Module-wise count rates for Quadrant B Data is divided into 100 sec bins |
 |
 |
| Module-wise count rates for Quadrant C Data is divided into 100 sec bins |
 |
 |
| Module-wise count rates for Quadrant D Data is divided into 100 sec bins |
 |
 |
| Parameter | Plot |
|---|---|
| CZT HV Monitor | 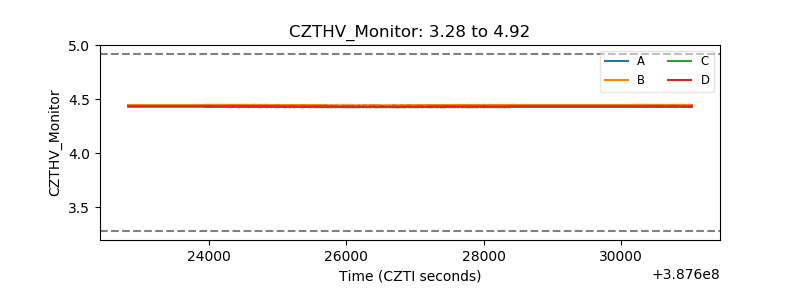 |
| D_VDD | 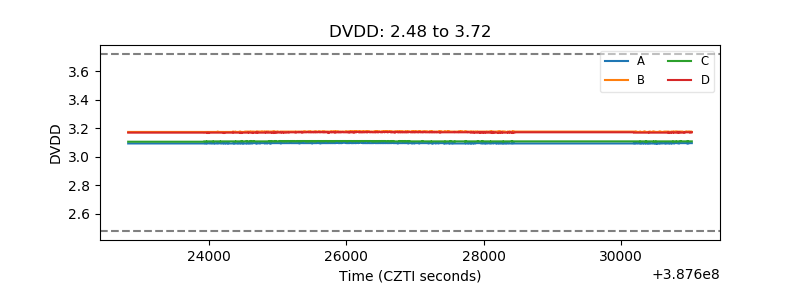 |
| Temperature 1 | 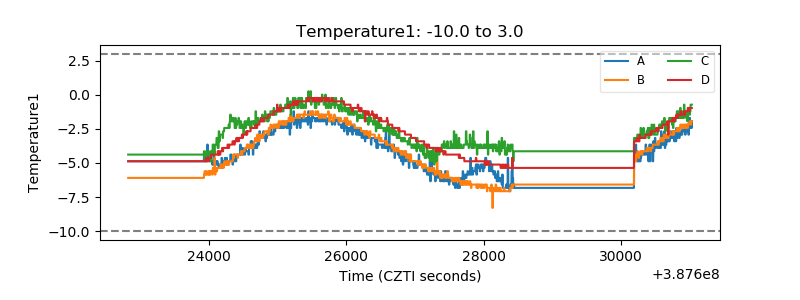 |
| Veto HV Monitor | 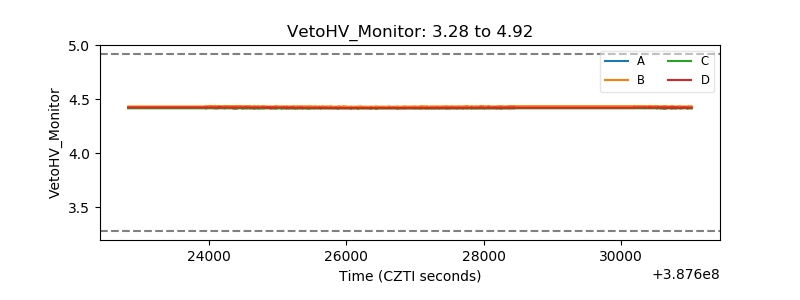 |
| Veto LLD | 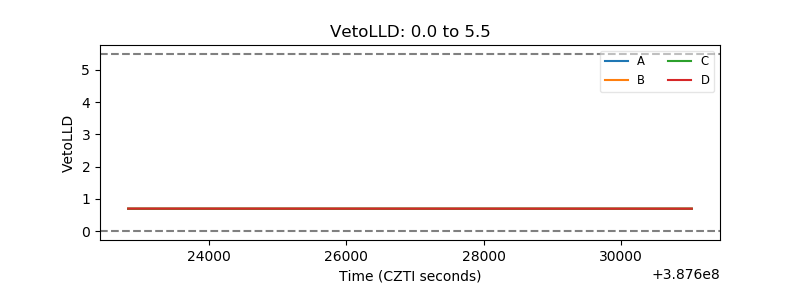 |
| Alpha Counter | 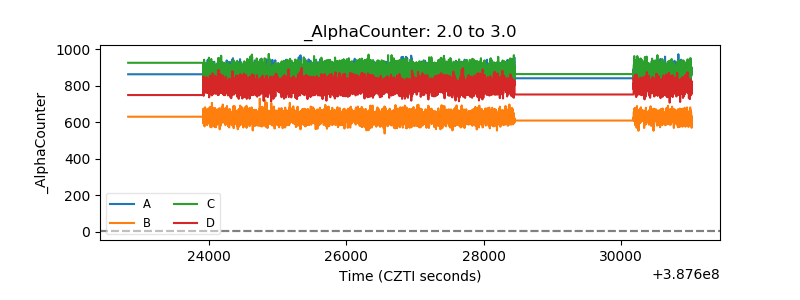 |
| _CPM_Rate | 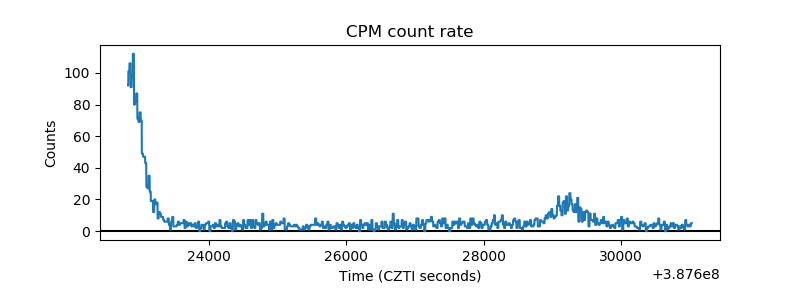 |
| CZT Counter | 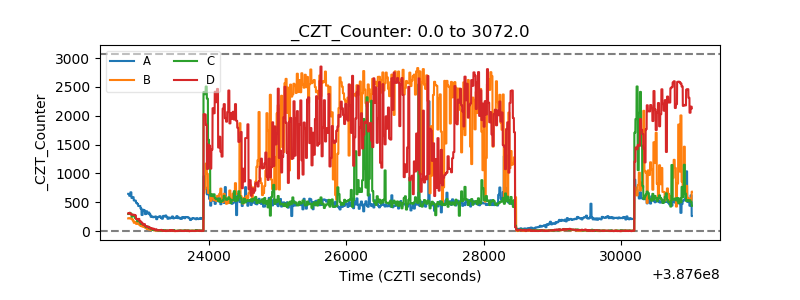 |
| +2.5 Volts monitor | 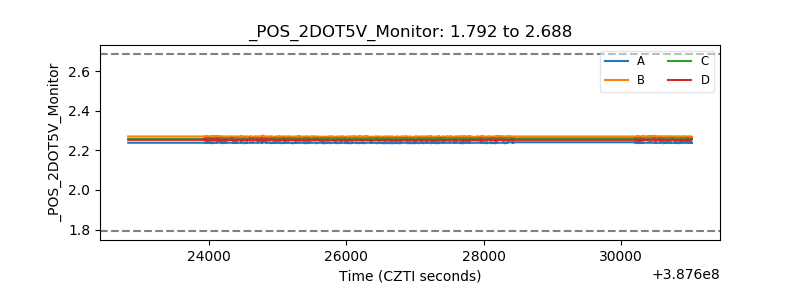 |
| +5 Volts monitor | 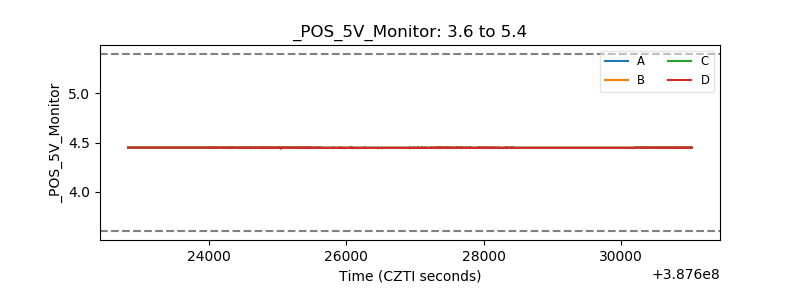 |
| _ROLL_ROT | 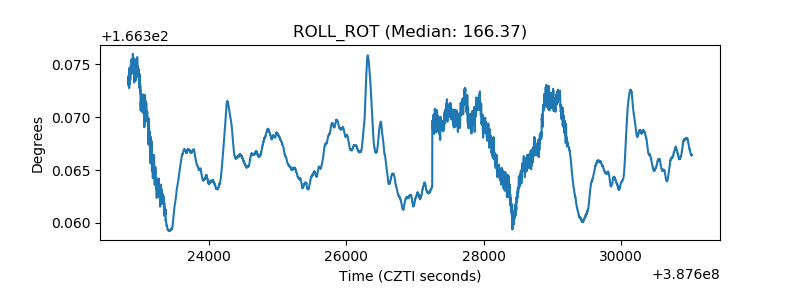 |
| _Roll_DEC | 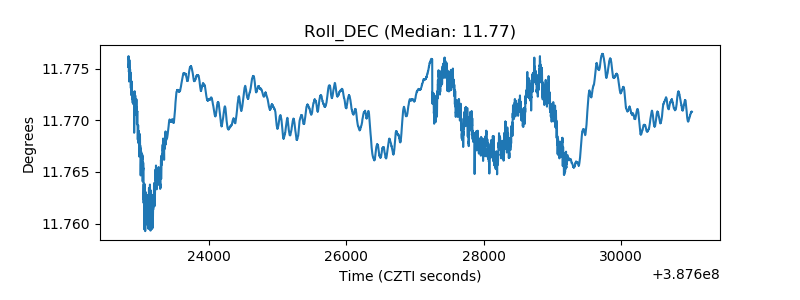 |
| _Roll_RA | 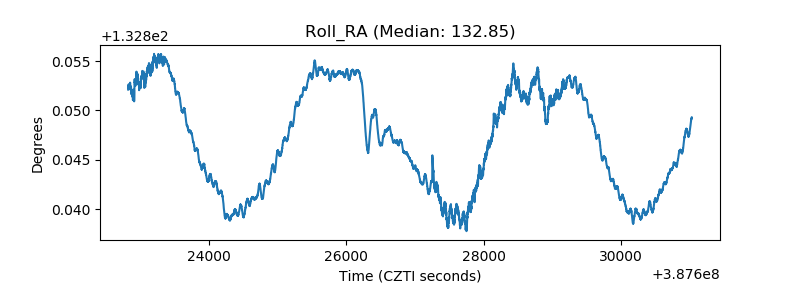 |
| Veto Counter | 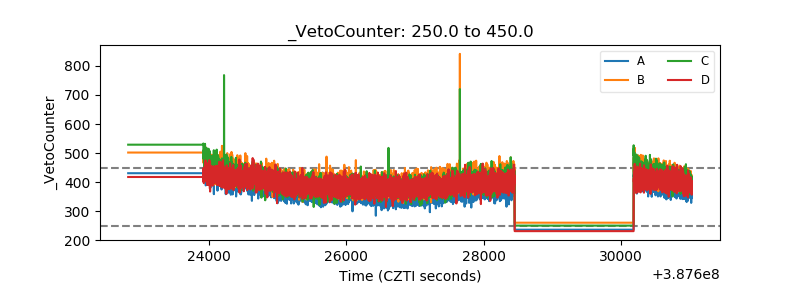 |