| Param | Original file | Final file |
|---|---|---|
| Filename | modeM0/AS1A11_099T01_9000005068_35371cztM0_level2.evt | modeM0/AS1A11_099T01_9000005068_35371cztM0_level2_quad_clean.evt |
| Size (bytes) | 851,846,400 | 83,332,800 |
| Size | 812.4 MB | 79.5 MB |
| Events in quadrant A | 3,322,353 | 563,660 |
| Events in quadrant B | 11,607,012 | 408,885 |
| Events in quadrant C | 4,307,292 | 544,314 |
| Events in quadrant D | 6,077,055 | 505,847 |
| Mode M9 | |||
|---|---|---|---|
| Quadrant | BADHDUFLAG | Total packets | Discarded packets |
| A | 0 | 15 | 0 |
| B | 0 | 15 | 0 |
| C | 0 | 15 | 0 |
| D | 0 | 16 | 0 |
| Mode M0 | |||
|---|---|---|---|
| Quadrant | BADHDUFLAG | Total packets | Discarded packets |
| A | 0 | 14744 | 3 |
| B | 0 | 39368 | 2 |
| C | 0 | 17230 | 2 |
| D | 0 | 22819 | 2 |
| Mode SS | |||
|---|---|---|---|
| Quadrant | BADHDUFLAG | Total packets | Discarded packets |
| A | 0 | 146 | 0 |
| B | 0 | 146 | 0 |
| C | 0 | 146 | 0 |
| D | 0 | 146 | 0 |
| Quadrant | Total seconds | Saturated seconds | Saturation percentage |
|---|---|---|---|
| A | 7171 | 6 | 0.083670% |
| B | 7171 | 3505 | 48.877423% |
| C | 7171 | 165 | 2.300934% |
| D | 7171 | 550 | 7.669781% |
Noise dominated data is calculated using 1-second bins in cleaned event files. If a bin has >2000 counts, and if more than 50% of those come from <1% of pixels, then it is considered to be noise-dominated and hence unusable.
| Quadrant | # 1 sec bins | Bins with >0 counts | Bins with >2000 counts | High rate bins dominated by noise | Noise dominated (total time) | Noise dominated (detector-on time) | Marked lightcurve |
|---|---|---|---|---|---|---|---|
| A | 8514 | 7172 | 0 | 0 | 0.00% | 0.00% | 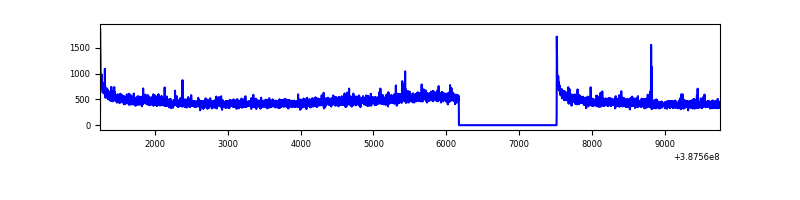 |
| B | 8514 | 7172 | 3041 | 3041 | 35.72% | 42.40% | 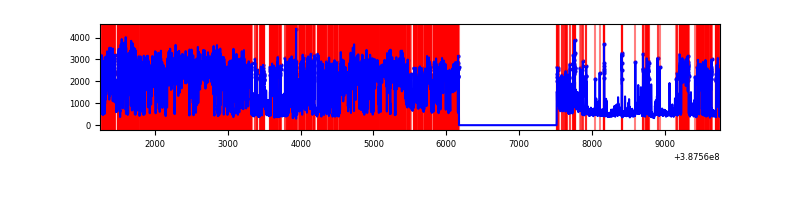 |
| C | 8514 | 7172 | 138 | 138 | 1.62% | 1.92% | 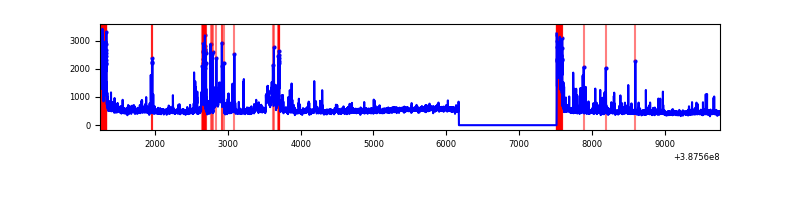 |
| D | 8514 | 7172 | 504 | 504 | 5.92% | 7.03% | 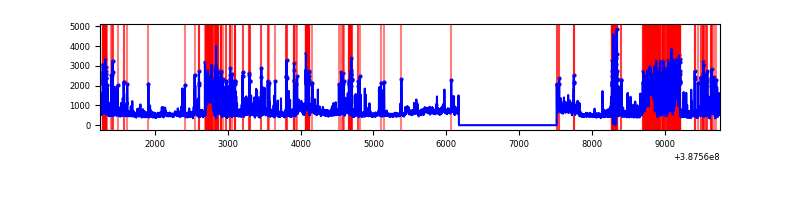 |
Top three noisy pixels from each quadrant. If the there are fewer than three noisy pixels in the level2.evt file, extra rows are filled as -1
| Pixel properties | Quadrant properties | ||||||
|---|---|---|---|---|---|---|---|
| Quadrant | DetID | PixID | Counts | Sigma | Mean | Median | Sigma |
| A | 10 | 83 | 140998 | 847.0 | 813 | 797 | 165.5 |
| A | 13 | 254 | 12987 | 73.64 | 813 | 797 | 165.5 |
| A | 13 | 6 | 12746 | 72.19 | 813 | 797 | 165.5 |
| B | 4 | 251 | 8796903 | 75616.25 | 599 | 584 | 116.3 |
| B | 5 | 172 | 207214 | 1776.26 | 599 | 584 | 116.3 |
| B | 5 | 200 | 98453 | 841.32 | 599 | 584 | 116.3 |
| C | 0 | 10 | 475843 | 2593.84 | 786 | 792 | 183.1 |
| C | 15 | 208 | 402309 | 2192.33 | 786 | 792 | 183.1 |
| C | 15 | 214 | 288667 | 1571.83 | 786 | 792 | 183.1 |
| D | 8 | 195 | 777290 | 4096.05 | 768 | 745 | 189.6 |
| D | 12 | 235 | 719413 | 3790.77 | 768 | 745 | 189.6 |
| D | 10 | 118 | 702546 | 3701.8 | 768 | 745 | 189.6 |
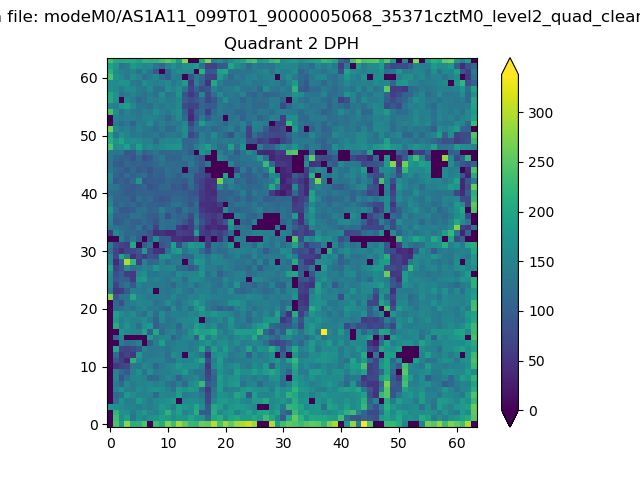
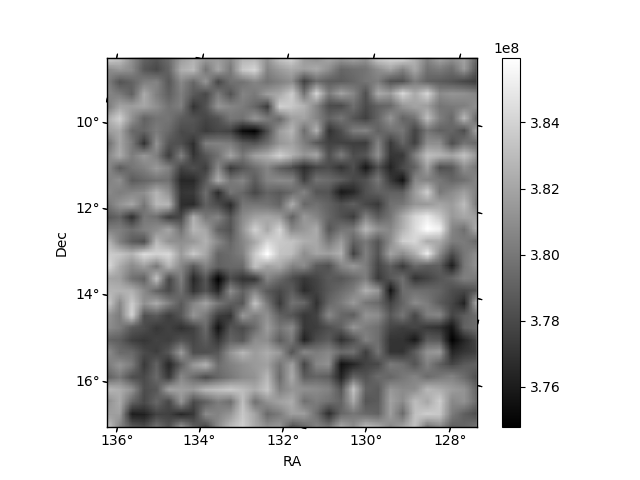
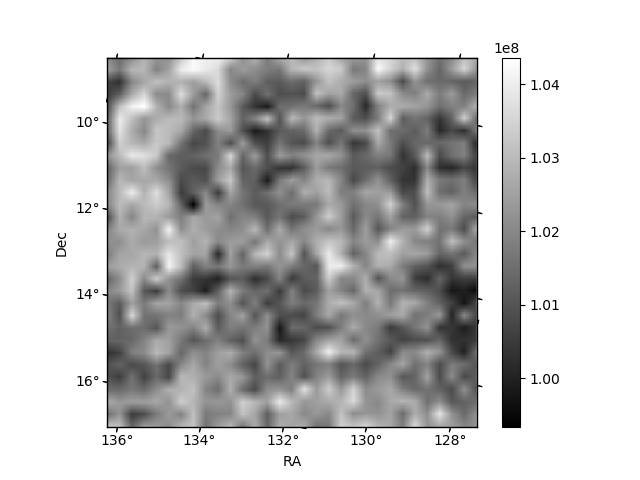
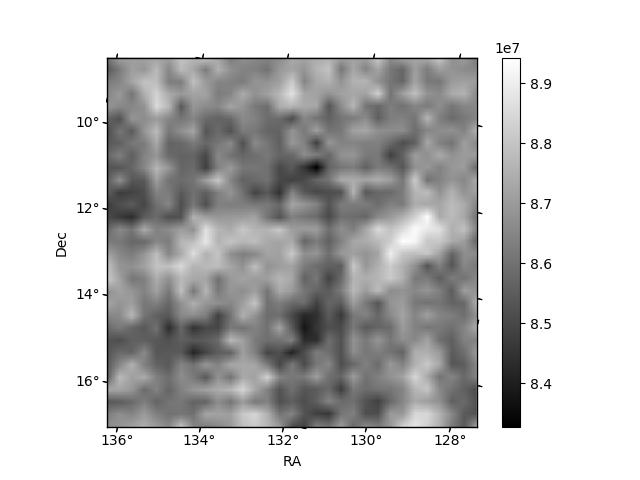
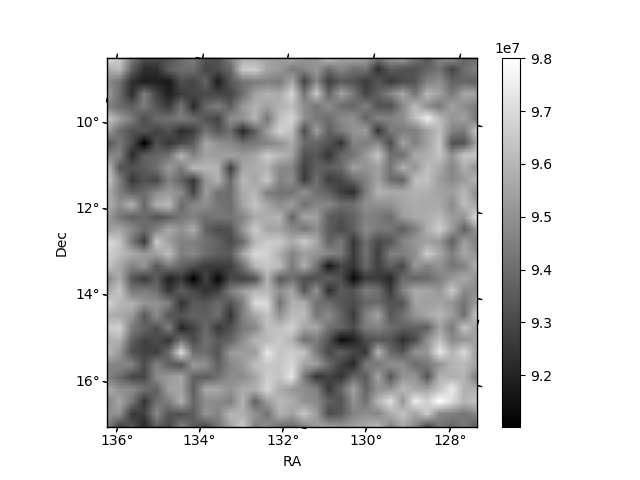
Histogram calculated using DETX and DETY for each event in the final _common_clean file
| Quadrant A | 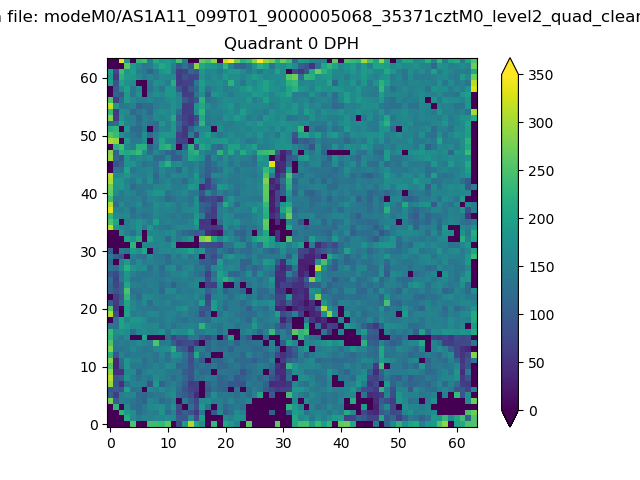 |
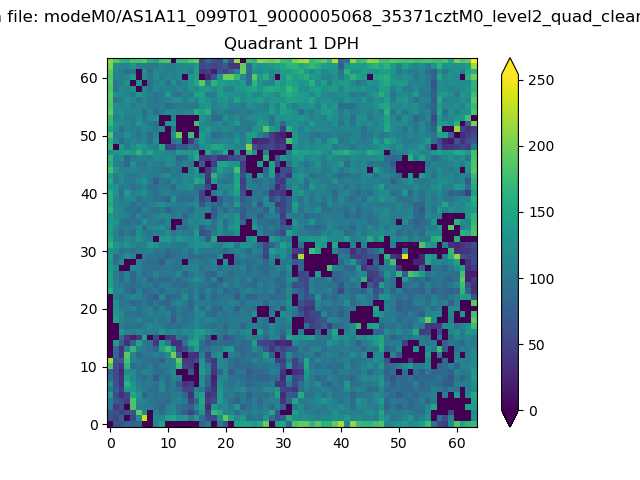 |
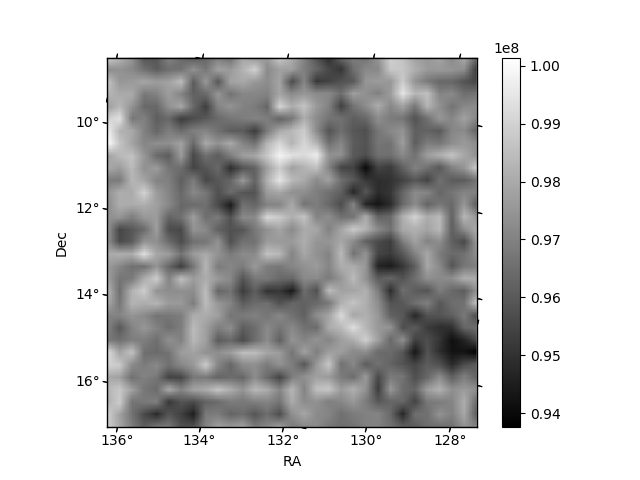
Quadrant B |
|---|---|---|---|
| Quadrant D | 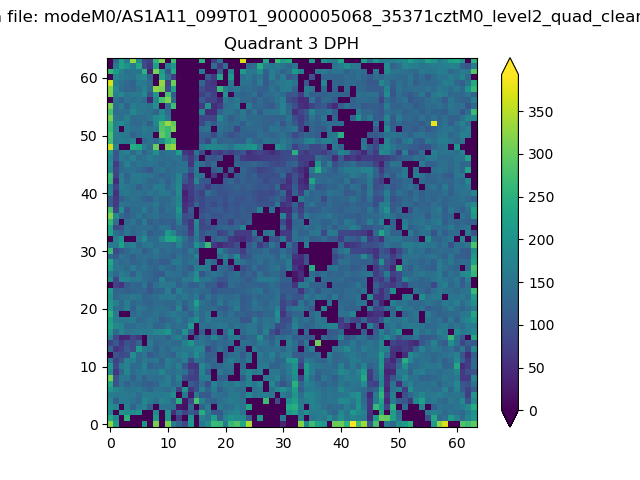 |
 |
Quadrant C |
| Plot type | Count rate plots | Images |
|---|---|---|
| Comparison with Poisson distribution Blue bars denote a histogram of data divided into 1 sec bins. Red curve is a Poisson curve with rate = median count rate of data. |
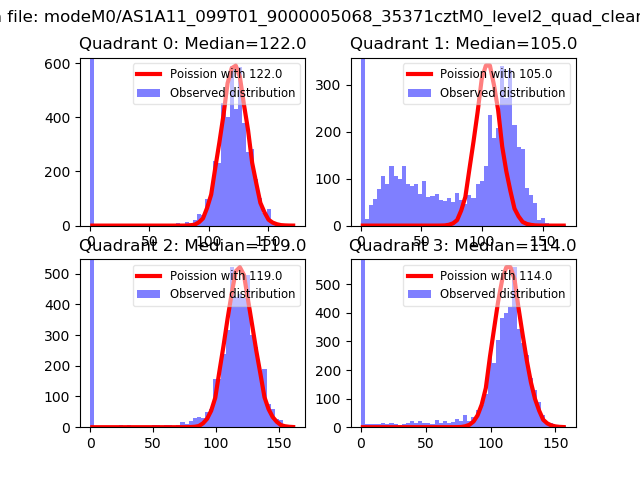 |
 |
| Quadrant-wise count rates Data is divided into 100 sec bins |
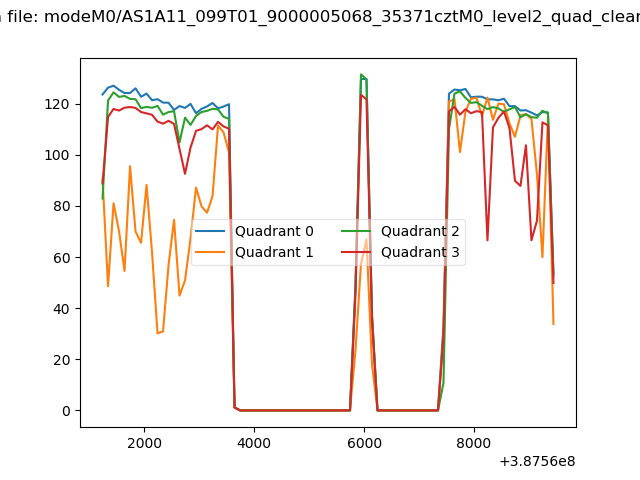 |
|
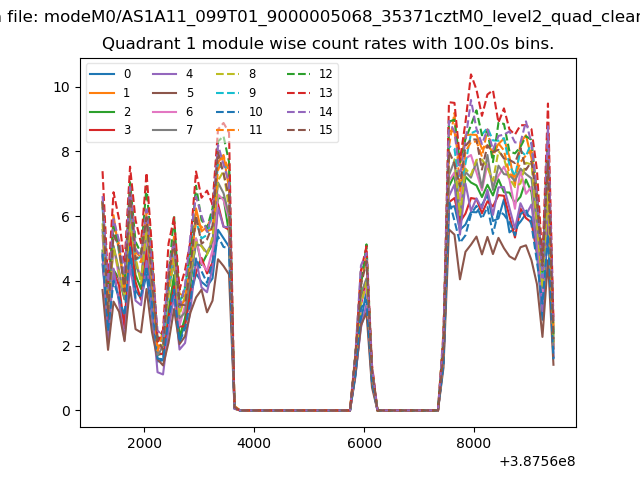
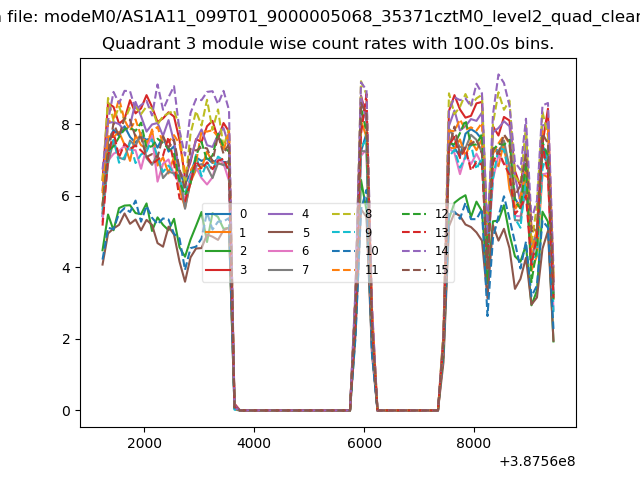
| Module-wise count rates for Quadrant A Data is divided into 100 sec bins |
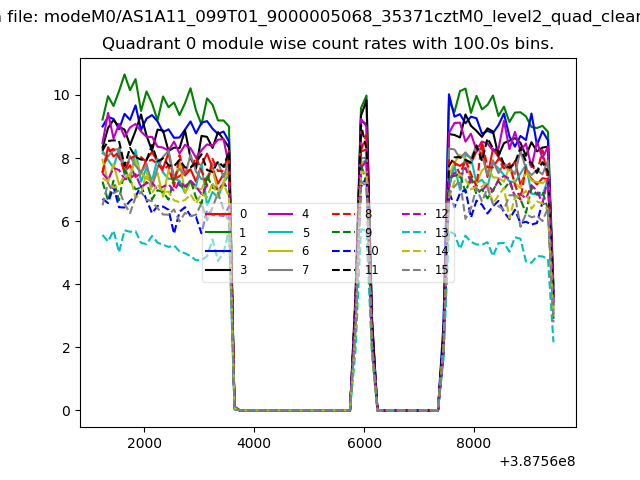 |
 |
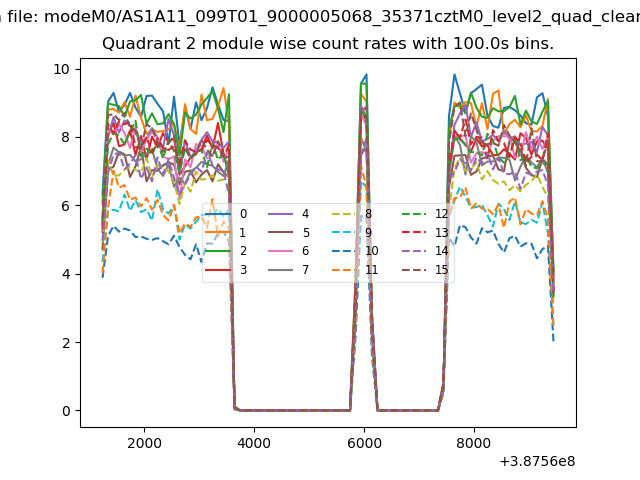
| Module-wise count rates for Quadrant B Data is divided into 100 sec bins |
 |
 |
| Module-wise count rates for Quadrant C Data is divided into 100 sec bins |
 |
 |
| Module-wise count rates for Quadrant D Data is divided into 100 sec bins |
 |
 |
| Parameter | Plot |
|---|---|
| CZT HV Monitor | 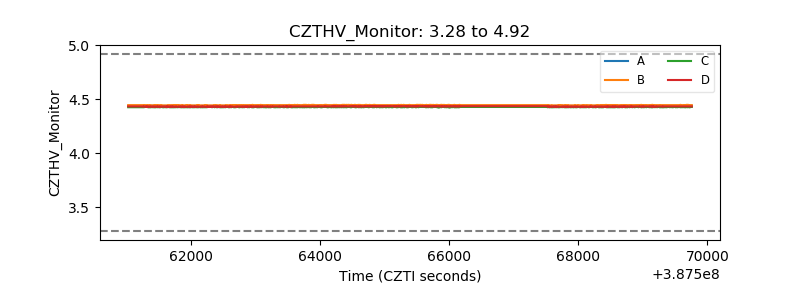 |
| D_VDD | 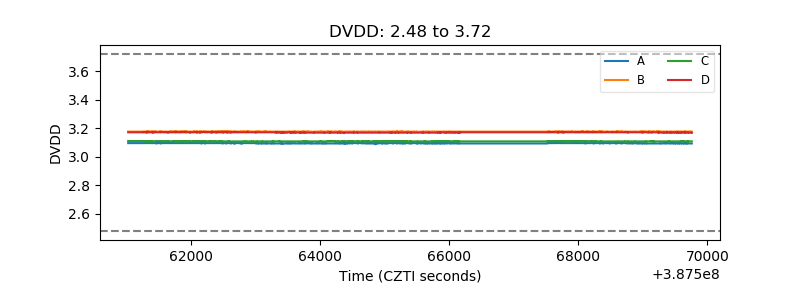 |
| Temperature 1 | 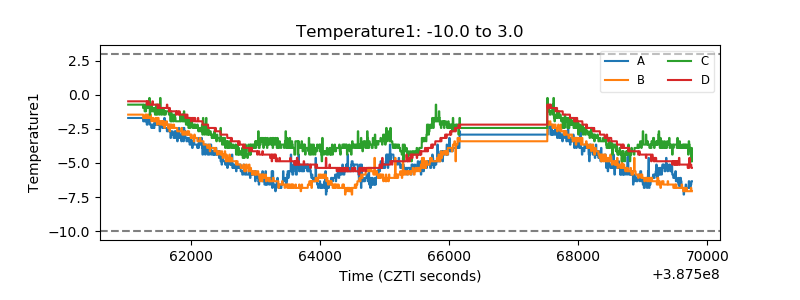 |
| Veto HV Monitor | 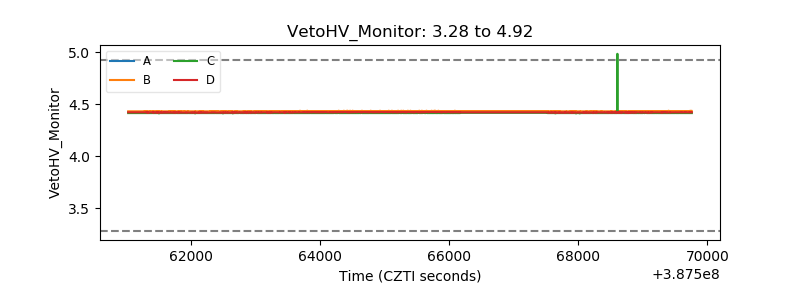 |
| Veto LLD | 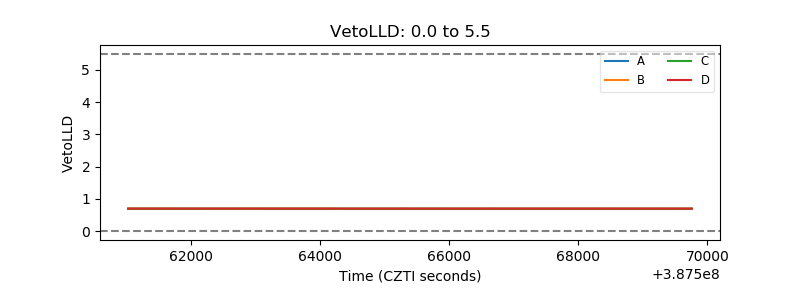 |
| Alpha Counter | 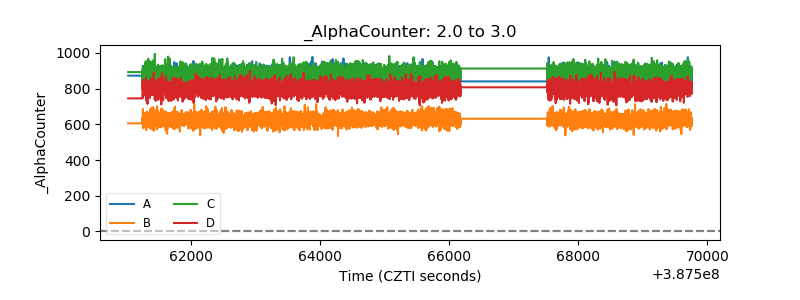 |
| _CPM_Rate | 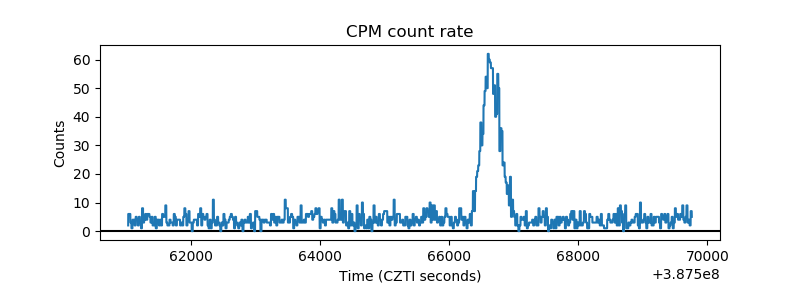 |
| CZT Counter | 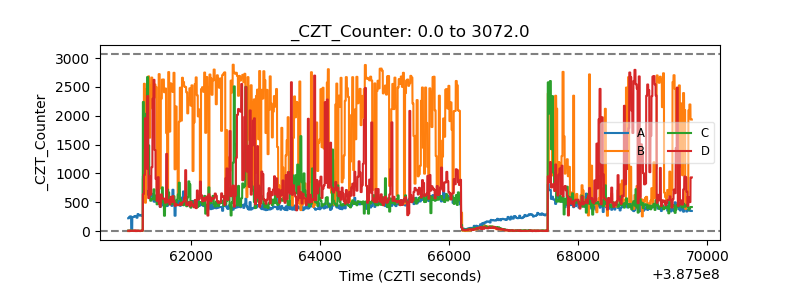 |
| +2.5 Volts monitor | 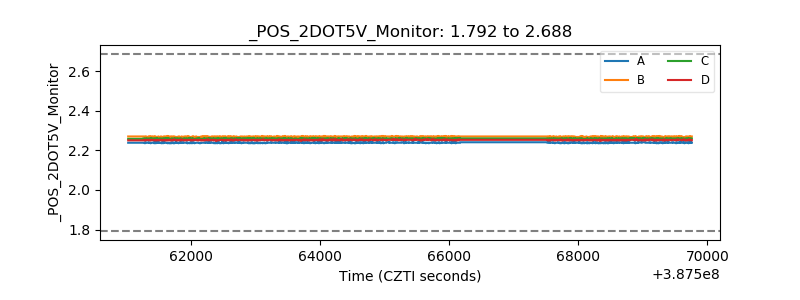 |
| +5 Volts monitor | 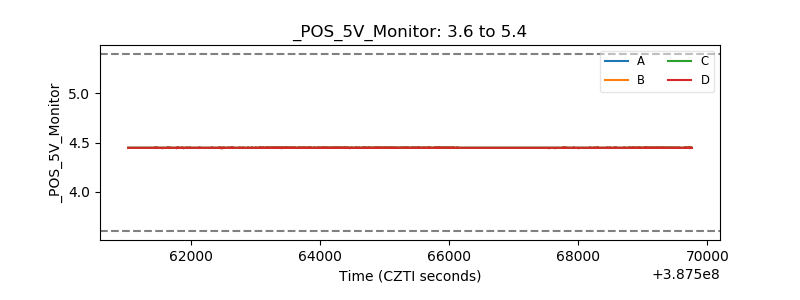 |
| _ROLL_ROT | 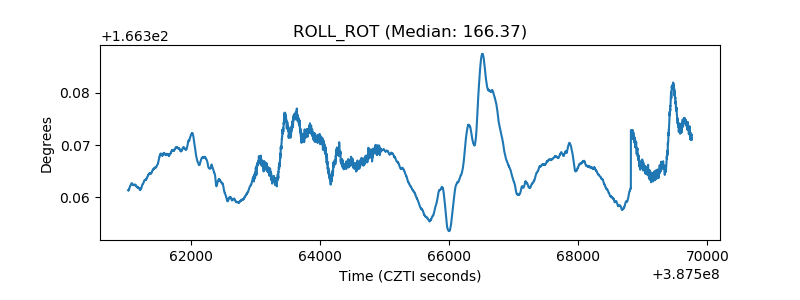 |
| _Roll_DEC | 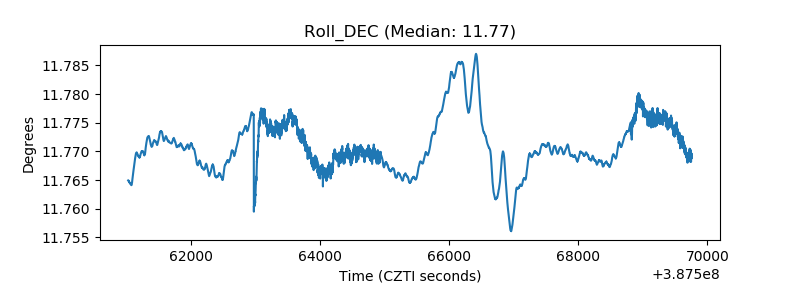 |
| _Roll_RA | 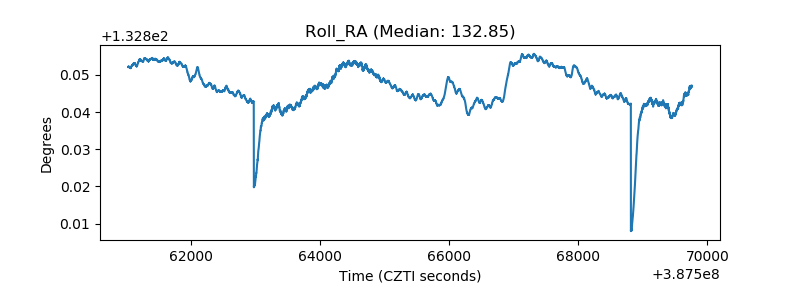 |
| Veto Counter | 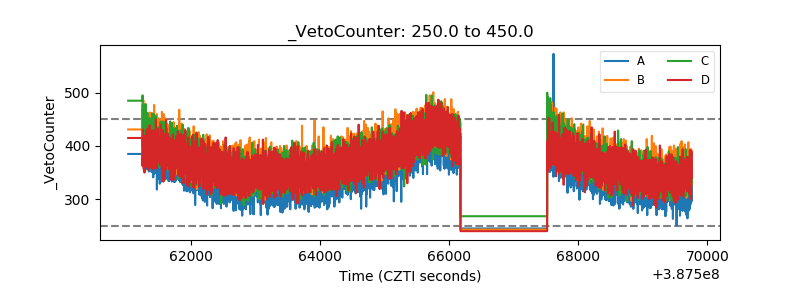 |