| Param | Original file | Final file |
|---|---|---|
| Filename | modeM0/AS1A11_099T01_9000005068_35368cztM0_level2.evt | modeM0/AS1A11_099T01_9000005068_35368cztM0_level2_quad_clean.evt |
| Size (bytes) | 839,980,800 | 71,112,960 |
| Size | 801.1 MB | 67.8 MB |
| Events in quadrant A | 2,836,422 | 524,675 |
| Events in quadrant B | 12,884,870 | 241,624 |
| Events in quadrant C | 3,424,438 | 510,174 |
| Events in quadrant D | 5,896,165 | 464,038 |
| Mode M9 | |||
|---|---|---|---|
| Quadrant | BADHDUFLAG | Total packets | Discarded packets |
| A | 0 | 16 | 0 |
| B | 0 | 16 | 0 |
| C | 0 | 16 | 0 |
| D | 0 | 17 | 0 |
| Mode M0 | |||
|---|---|---|---|
| Quadrant | BADHDUFLAG | Total packets | Discarded packets |
| A | 0 | 12181 | 3 |
| B | 0 | 42255 | 2 |
| C | 0 | 13665 | 2 |
| D | 0 | 21517 | 2 |
| Mode SS | |||
|---|---|---|---|
| Quadrant | BADHDUFLAG | Total packets | Discarded packets |
| A | 0 | 120 | 0 |
| B | 0 | 120 | 0 |
| C | 0 | 120 | 0 |
| D | 0 | 120 | 0 |
| Quadrant | Total seconds | Saturated seconds | Saturation percentage |
|---|---|---|---|
| A | 5880 | 13 | 0.221088% |
| B | 5880 | 4673 | 79.472789% |
| C | 5880 | 97 | 1.649660% |
| D | 5880 | 625 | 10.629252% |
Noise dominated data is calculated using 1-second bins in cleaned event files. If a bin has >2000 counts, and if more than 50% of those come from <1% of pixels, then it is considered to be noise-dominated and hence unusable.
| Quadrant | # 1 sec bins | Bins with >0 counts | Bins with >2000 counts | High rate bins dominated by noise | Noise dominated (total time) | Noise dominated (detector-on time) | Marked lightcurve |
|---|---|---|---|---|---|---|---|
| A | 7253 | 5881 | 3 | 3 | 0.04% | 0.05% | 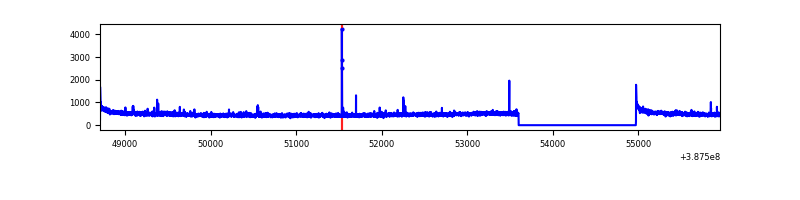 |
| B | 7253 | 5881 | 4193 | 4193 | 57.81% | 71.30% | 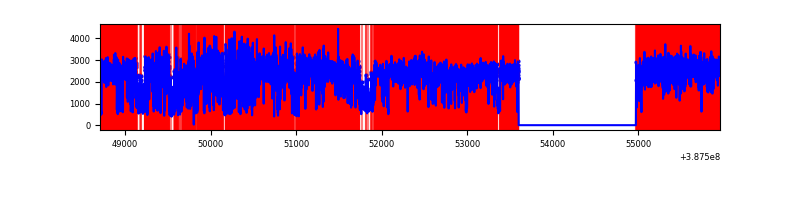 |
| C | 7253 | 5881 | 78 | 78 | 1.08% | 1.33% | 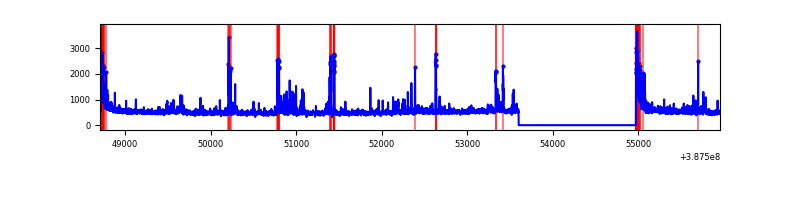 |
| D | 7253 | 5881 | 594 | 594 | 8.19% | 10.10% | 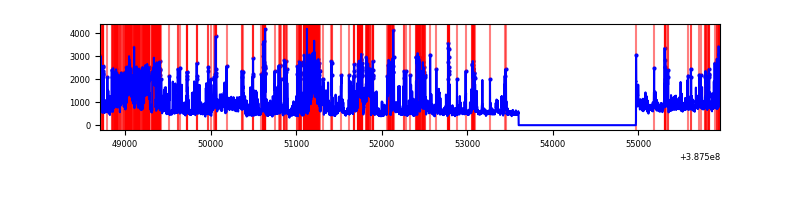 |
Top three noisy pixels from each quadrant. If the there are fewer than three noisy pixels in the level2.evt file, extra rows are filled as -1
| Pixel properties | Quadrant properties | ||||||
|---|---|---|---|---|---|---|---|
| Quadrant | DetID | PixID | Counts | Sigma | Mean | Median | Sigma |
| A | 10 | 83 | 125700 | 896.24 | 685 | 670 | 139.5 |
| A | 13 | 6 | 22004 | 152.93 | 685 | 670 | 139.5 |
| A | 9 | 143 | 14279 | 97.55 | 685 | 670 | 139.5 |
| B | 4 | 251 | 10995698 | 156383.5 | 358 | 348 | 70.3 |
| B | 5 | 172 | 131609 | 1866.89 | 358 | 348 | 70.3 |
| B | 5 | 236 | 87104 | 1233.9 | 358 | 348 | 70.3 |
| C | 3 | 233 | 269364 | 1746.81 | 660 | 664 | 153.8 |
| C | 0 | 10 | 259720 | 1684.11 | 660 | 664 | 153.8 |
| C | 15 | 214 | 240447 | 1558.82 | 660 | 664 | 153.8 |
| D | 12 | 235 | 1265664 | 7997.94 | 644 | 626 | 158.2 |
| D | 8 | 195 | 643967 | 4067.39 | 644 | 626 | 158.2 |
| D | 1 | 52 | 547746 | 3459.05 | 644 | 626 | 158.2 |
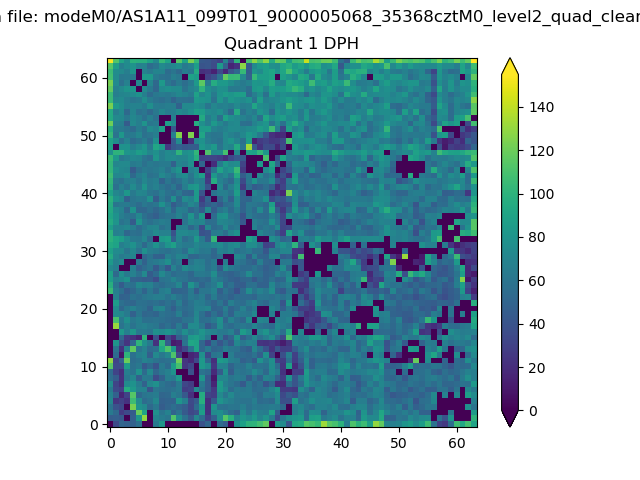
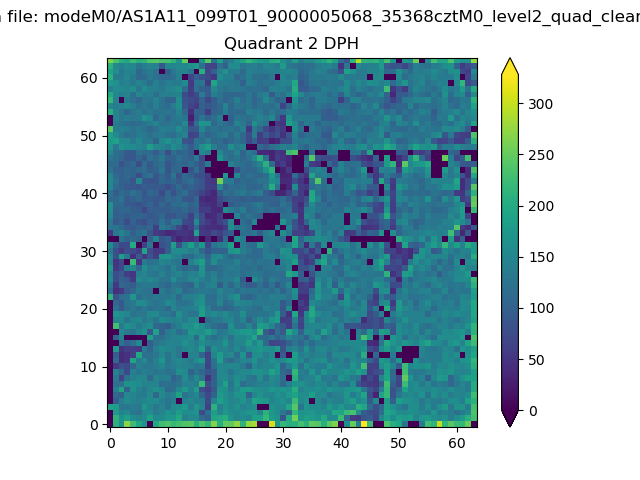
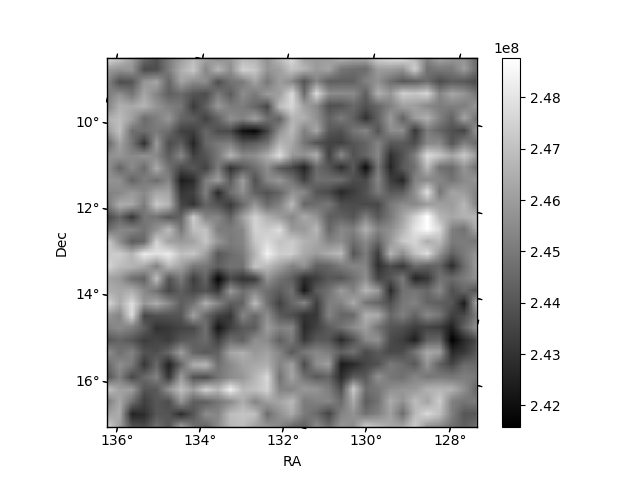
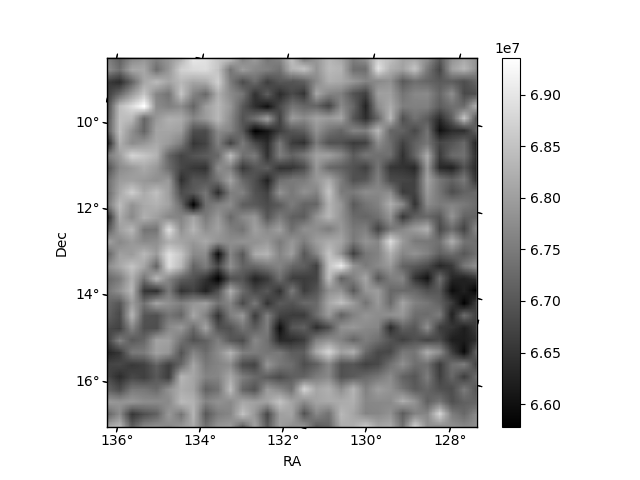
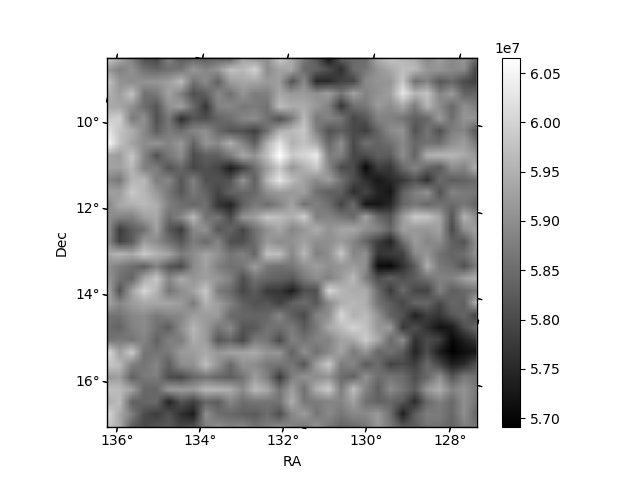
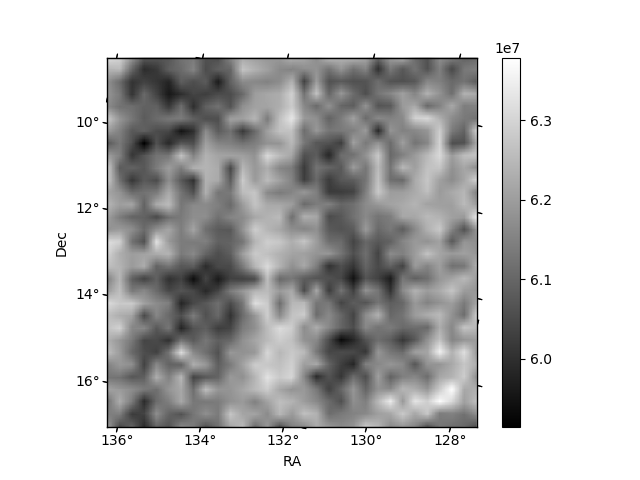
Histogram calculated using DETX and DETY for each event in the final _common_clean file
| Quadrant A |  |
 |
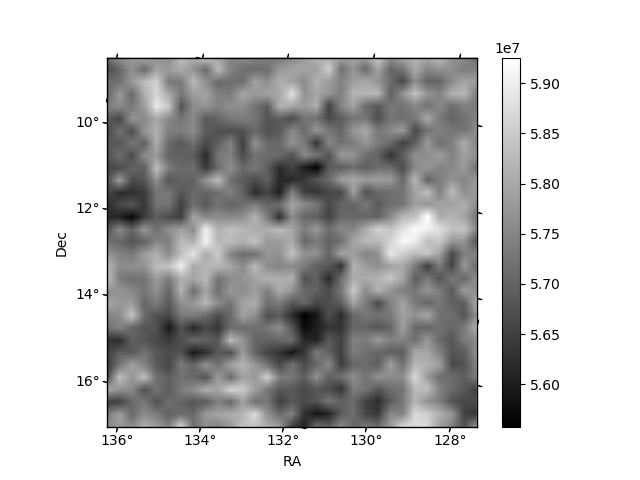
Quadrant B |
|---|---|---|---|
| Quadrant D | 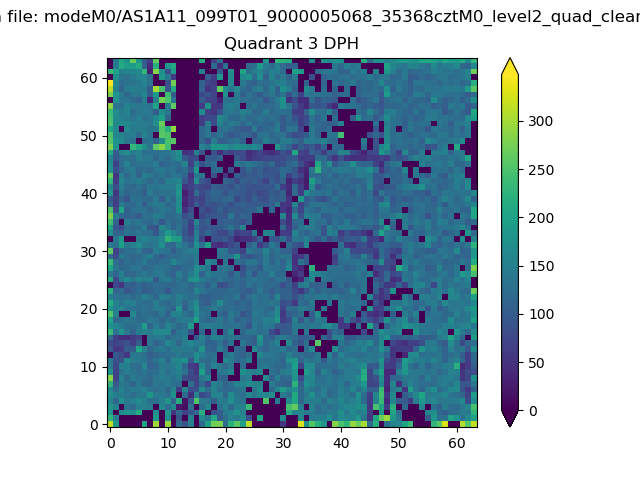 |
 |
Quadrant C |
| Plot type | Count rate plots | Images |
|---|---|---|
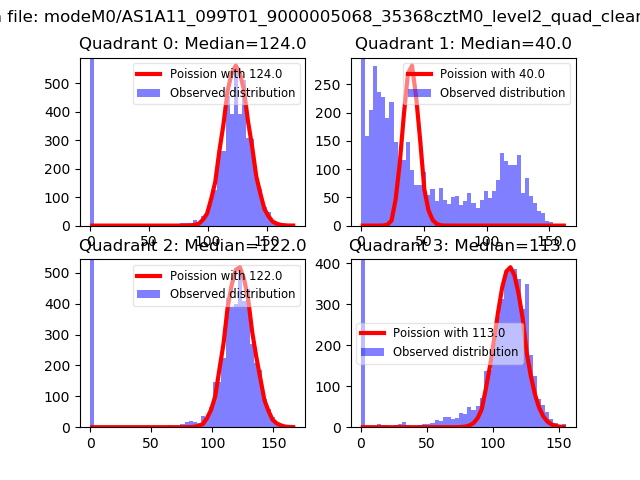
| Comparison with Poisson distribution Blue bars denote a histogram of data divided into 1 sec bins. Red curve is a Poisson curve with rate = median count rate of data. |
 |
 |
| Quadrant-wise count rates Data is divided into 100 sec bins |
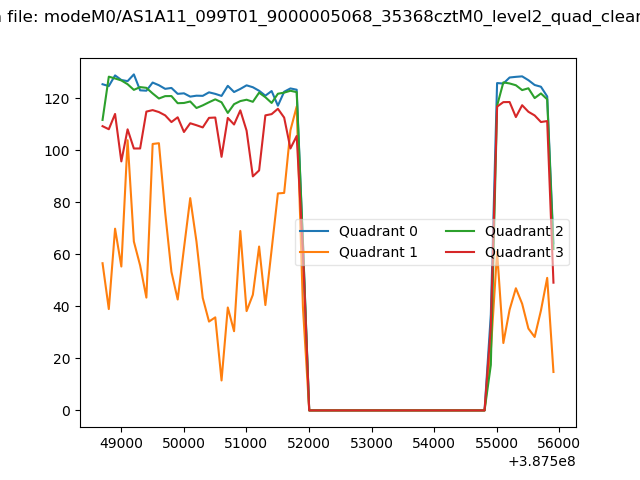 |
|
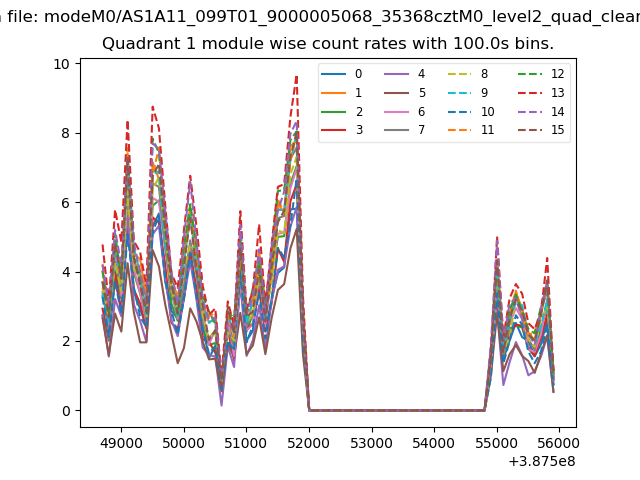
| Module-wise count rates for Quadrant A Data is divided into 100 sec bins |
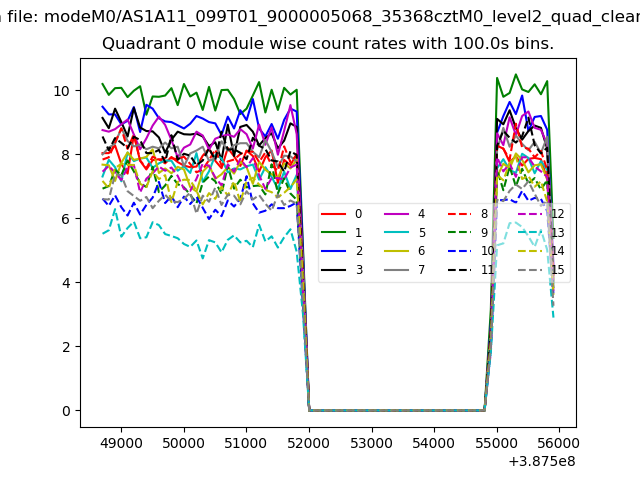 |
 |
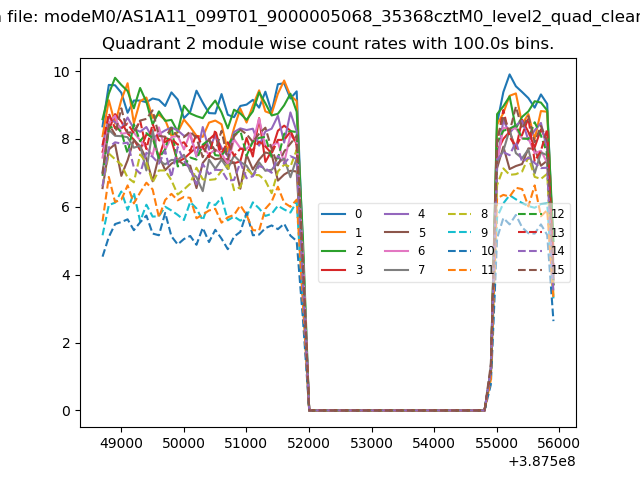
| Module-wise count rates for Quadrant B Data is divided into 100 sec bins |
 |
 |
| Module-wise count rates for Quadrant C Data is divided into 100 sec bins |
 |
 |
| Module-wise count rates for Quadrant D Data is divided into 100 sec bins |
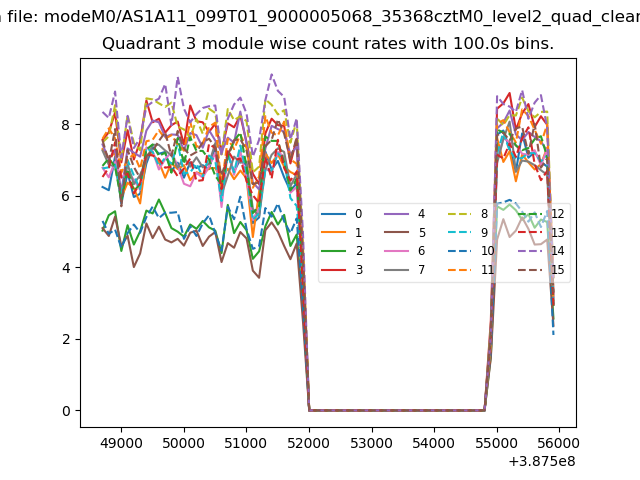 |
 |
| Parameter | Plot |
|---|---|
| CZT HV Monitor | 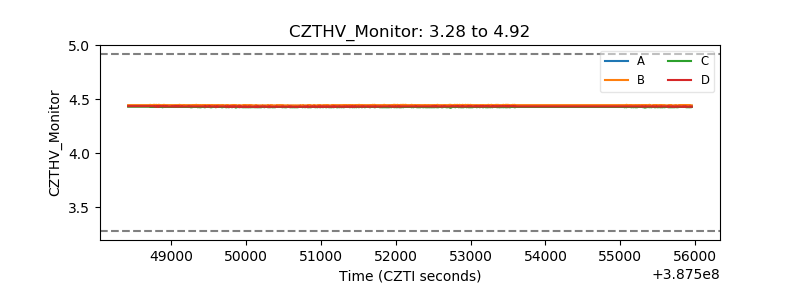 |
| D_VDD | 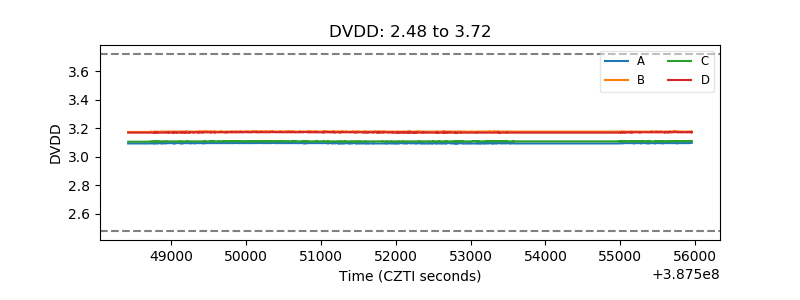 |
| Temperature 1 | 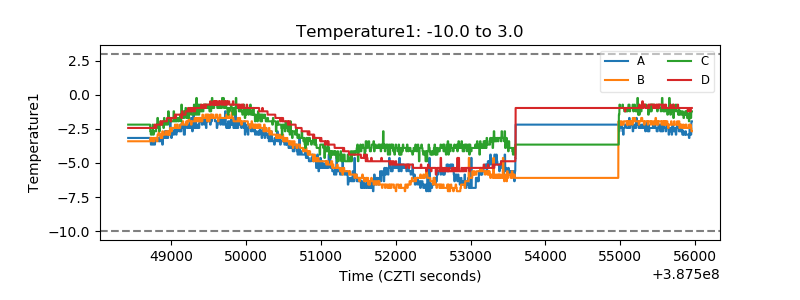 |
| Veto HV Monitor |  |
| Veto LLD | 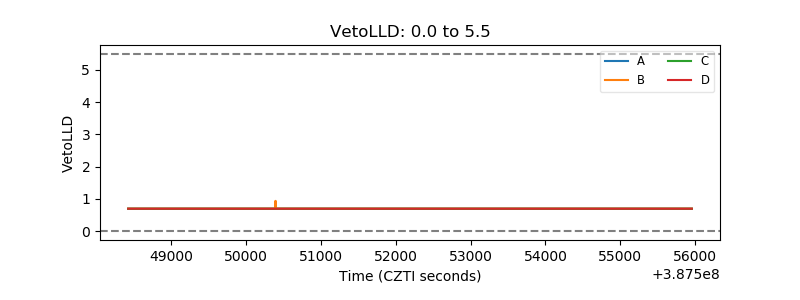 |
| Alpha Counter | 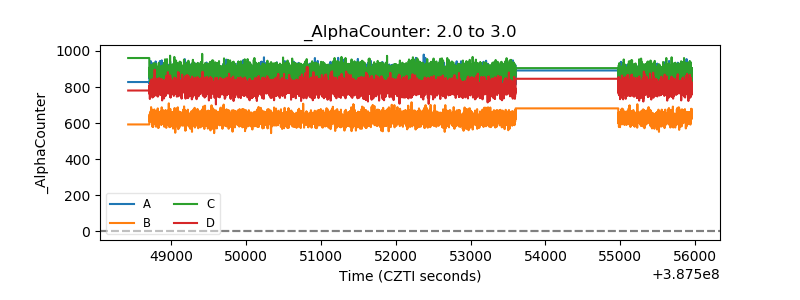 |
| _CPM_Rate | 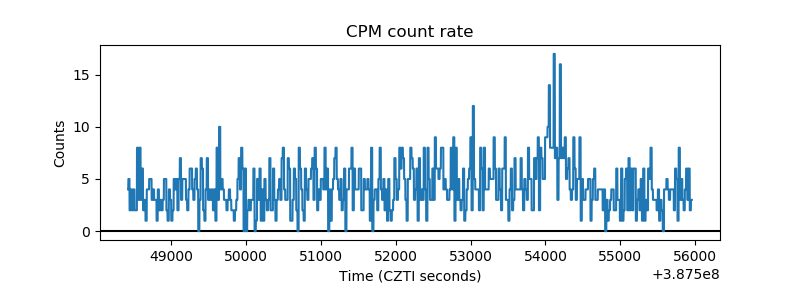 |
| CZT Counter | 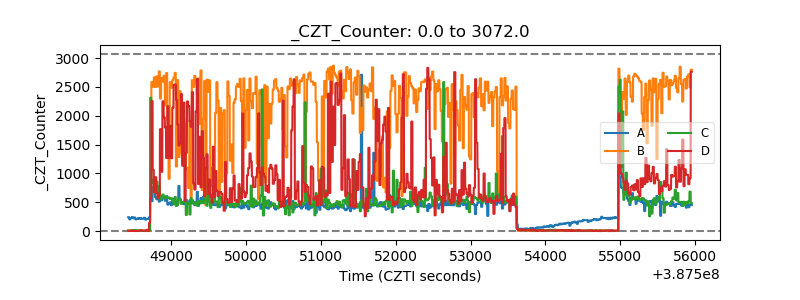 |
| +2.5 Volts monitor | 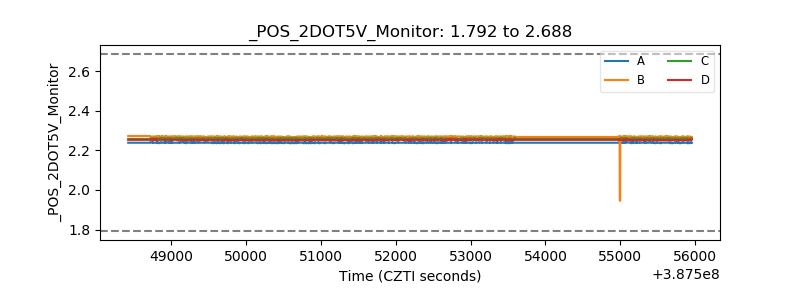 |
| +5 Volts monitor | 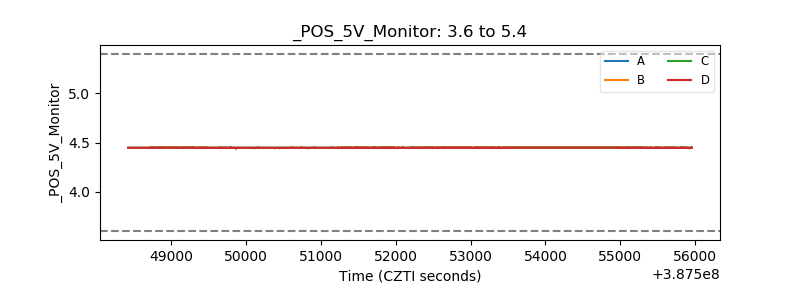 |
| _ROLL_ROT | 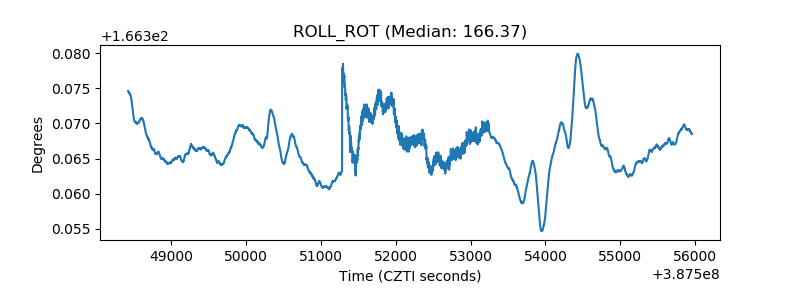 |
| _Roll_DEC | 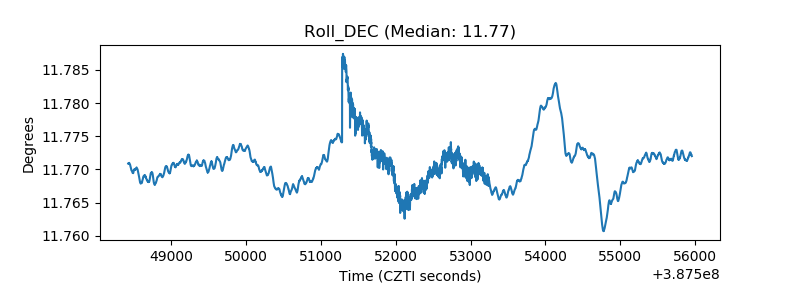 |
| _Roll_RA | 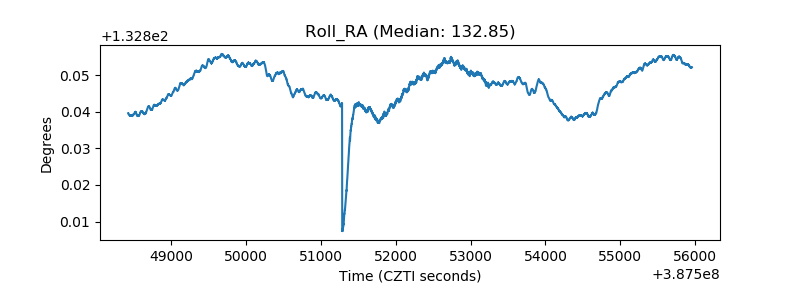 |
| Veto Counter | 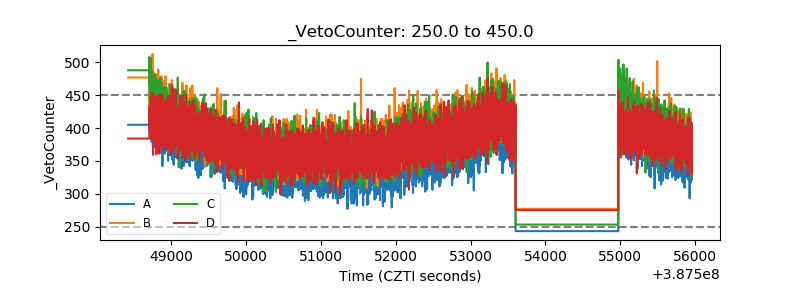 |