| Param | Original file | Final file |
|---|---|---|
| Filename | modeM0/AS1A11_037T01_9000005066_35354cztM0_level2.evt | modeM0/AS1A11_037T01_9000005066_35354cztM0_level2_quad_clean.evt |
| Size (bytes) | 525,574,080 | 84,049,920 |
| Size | 501.2 MB | 80.2 MB |
| Events in quadrant A | 2,730,645 | 556,661 |
| Events in quadrant B | 3,271,367 | 553,158 |
| Events in quadrant C | 3,978,858 | 536,219 |
| Events in quadrant D | 5,533,891 | 484,351 |
| Mode M0 | |||
|---|---|---|---|
| Quadrant | BADHDUFLAG | Total packets | Discarded packets |
| A | 0 | 12059 | 2 |
| B | 0 | 13595 | 1 |
| C | 0 | 15745 | 1 |
| D | 0 | 20576 | 1 |
| Mode M9 | |||
|---|---|---|---|
| Quadrant | BADHDUFLAG | Total packets | Discarded packets |
| A | 0 | 13 | 0 |
| B | 0 | 13 | 0 |
| C | 0 | 13 | 0 |
| D | 0 | 13 | 0 |
| Mode SS | |||
|---|---|---|---|
| Quadrant | BADHDUFLAG | Total packets | Discarded packets |
| A | 0 | 122 | 0 |
| B | 0 | 122 | 0 |
| C | 0 | 122 | 0 |
| D | 0 | 122 | 0 |
| Quadrant | Total seconds | Saturated seconds | Saturation percentage |
|---|---|---|---|
| A | 5929 | 5 | 0.084331% |
| B | 5929 | 102 | 1.720358% |
| C | 5929 | 167 | 2.816664% |
| D | 5929 | 620 | 10.457075% |
Noise dominated data is calculated using 1-second bins in cleaned event files. If a bin has >2000 counts, and if more than 50% of those come from <1% of pixels, then it is considered to be noise-dominated and hence unusable.
| Quadrant | # 1 sec bins | Bins with >0 counts | Bins with >2000 counts | High rate bins dominated by noise | Noise dominated (total time) | Noise dominated (detector-on time) | Marked lightcurve |
|---|---|---|---|---|---|---|---|
| A | 7241 | 5930 | 0 | 0 | 0.00% | 0.00% | 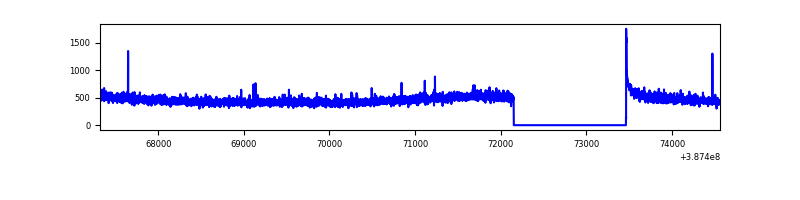 |
| B | 7241 | 5930 | 86 | 86 | 1.19% | 1.45% | 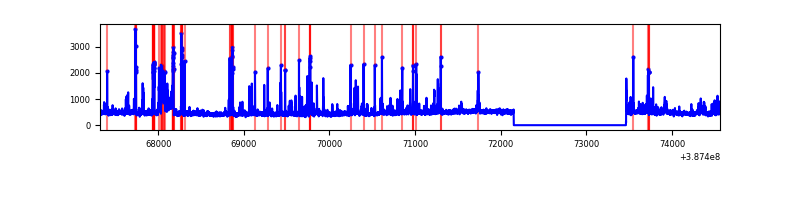 |
| C | 7241 | 5930 | 154 | 154 | 2.13% | 2.60% | 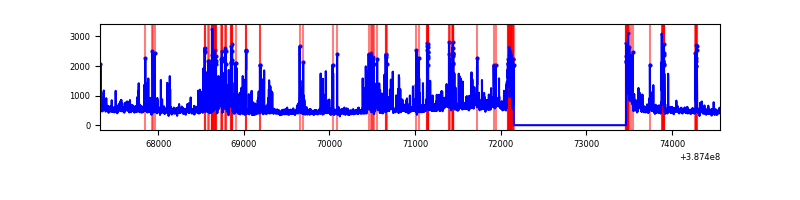 |
| D | 7241 | 5930 | 624 | 624 | 8.62% | 10.52% | 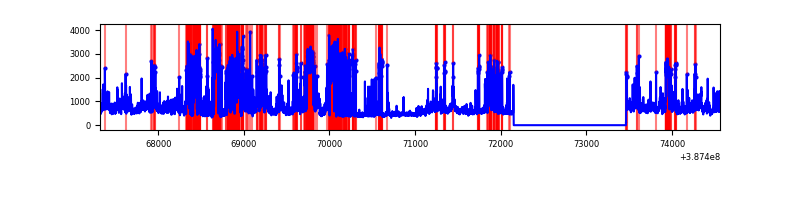 |
Top three noisy pixels from each quadrant. If the there are fewer than three noisy pixels in the level2.evt file, extra rows are filled as -1
| Pixel properties | Quadrant properties | ||||||
|---|---|---|---|---|---|---|---|
| Quadrant | DetID | PixID | Counts | Sigma | Mean | Median | Sigma |
| A | 10 | 83 | 101630 | 735.21 | 675 | 662 | 137.3 |
| A | 13 | 254 | 9217 | 62.29 | 675 | 662 | 137.3 |
| A | 13 | 6 | 7070 | 46.66 | 675 | 662 | 137.3 |
| B | 5 | 172 | 290678 | 2266.3 | 665 | 648 | 128.0 |
| B | 5 | 236 | 251113 | 1957.14 | 665 | 648 | 128.0 |
| B | 4 | 232 | 36854 | 282.91 | 665 | 648 | 128.0 |
| C | 15 | 208 | 673793 | 4491.21 | 641 | 646 | 149.9 |
| C | 0 | 10 | 449441 | 2994.34 | 641 | 646 | 149.9 |
| C | 15 | 214 | 243598 | 1620.96 | 641 | 646 | 149.9 |
| D | 7 | 80 | 1733921 | 11392.85 | 618 | 599 | 152.1 |
| D | 8 | 195 | 481703 | 3162.22 | 618 | 599 | 152.1 |
| D | 2 | 152 | 345204 | 2265.03 | 618 | 599 | 152.1 |
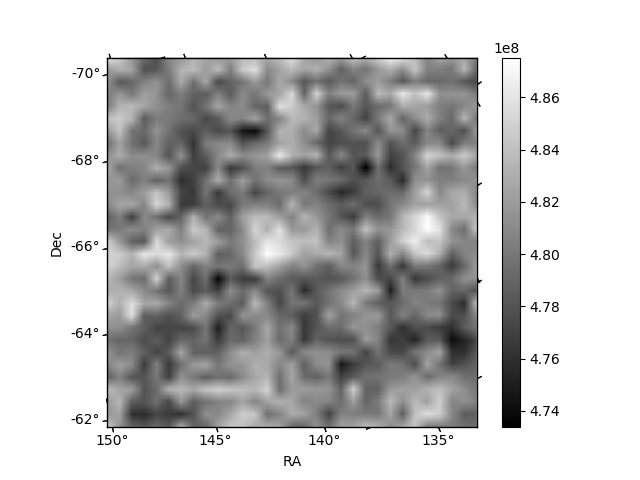
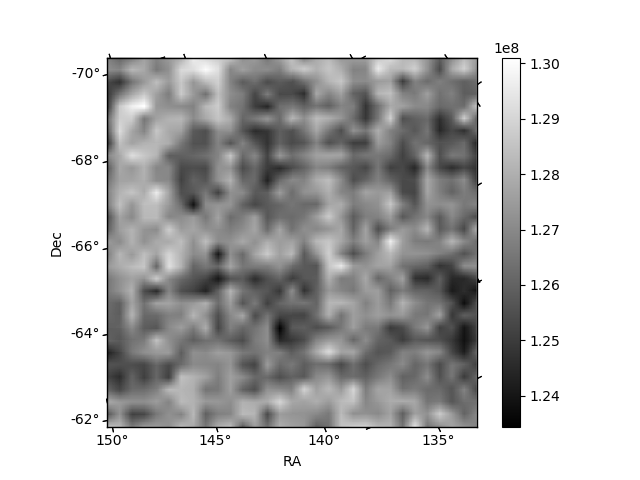
Histogram calculated using DETX and DETY for each event in the final _common_clean file
| Quadrant A | 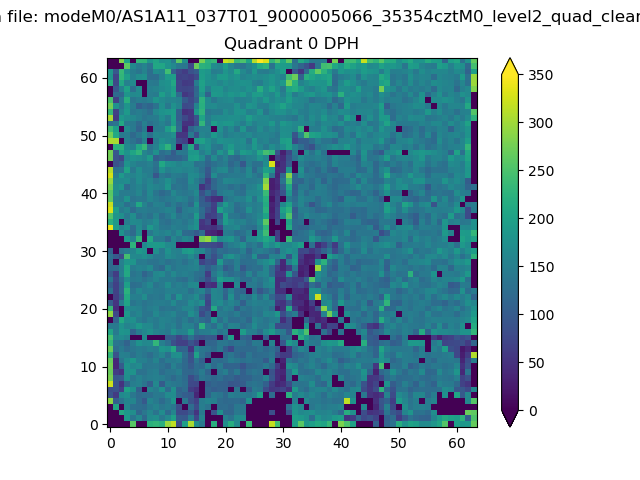 |
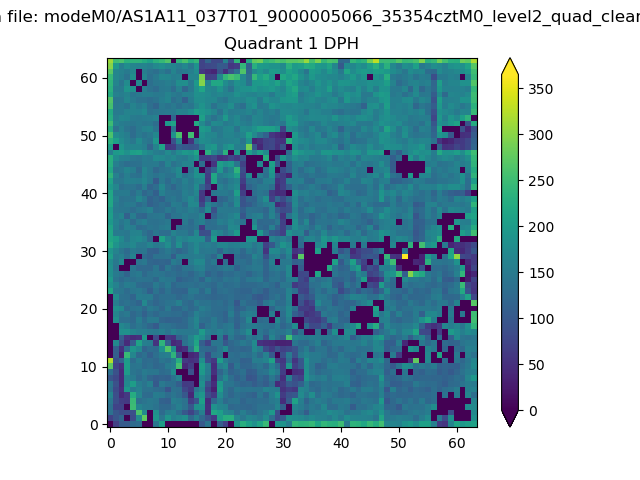 |
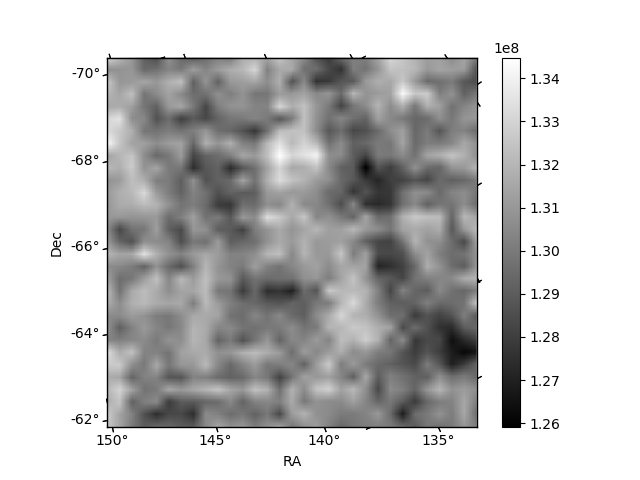
Quadrant B |
|---|---|---|---|
| Quadrant D | 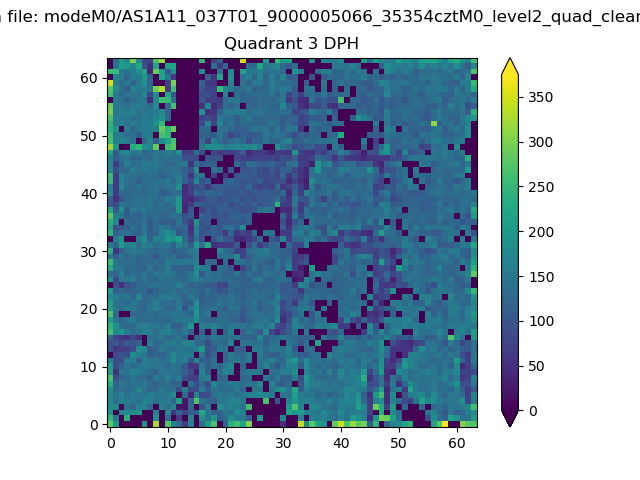 |
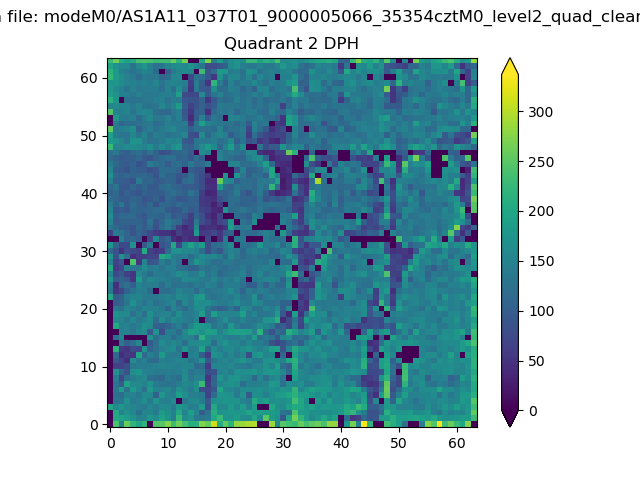 |
Quadrant C |
| Plot type | Count rate plots | Images |
|---|---|---|
| Comparison with Poisson distribution Blue bars denote a histogram of data divided into 1 sec bins. Red curve is a Poisson curve with rate = median count rate of data. |
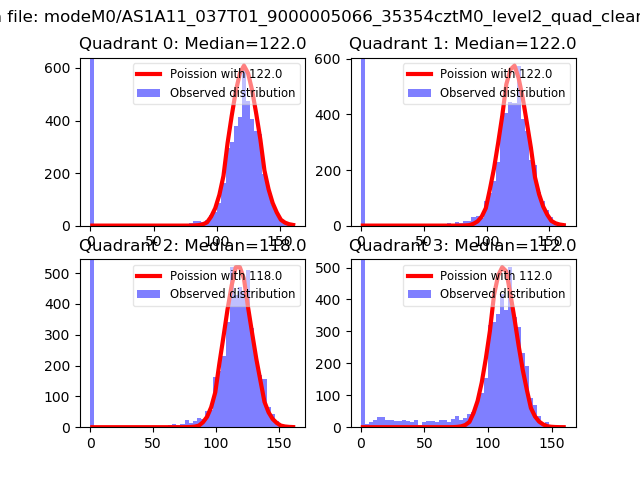 |
 |
| Quadrant-wise count rates Data is divided into 100 sec bins |
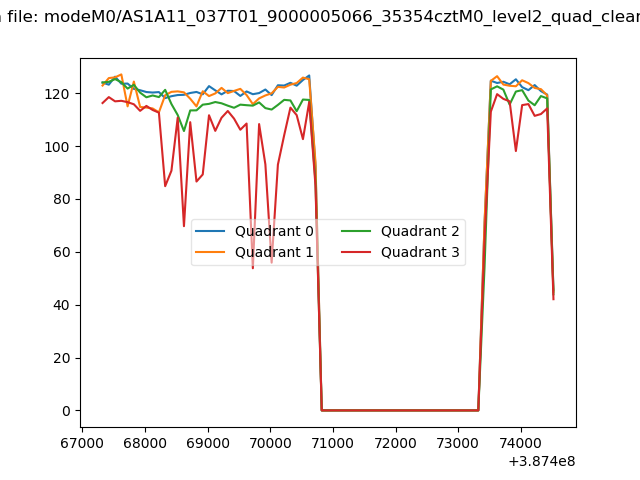 |
|
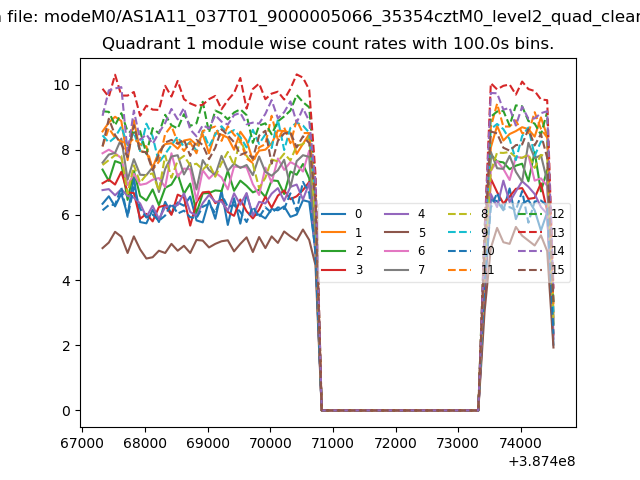
| Module-wise count rates for Quadrant A Data is divided into 100 sec bins |
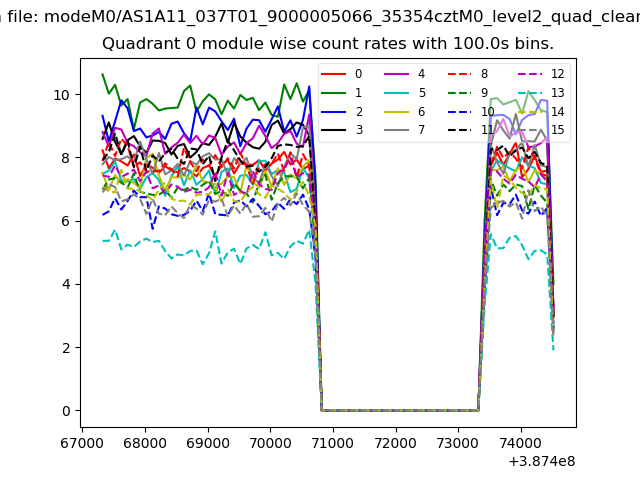 |
 |
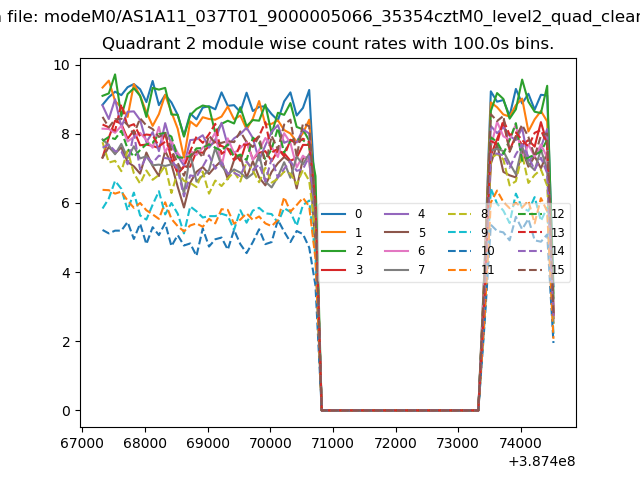
| Module-wise count rates for Quadrant B Data is divided into 100 sec bins |
 |
 |
| Module-wise count rates for Quadrant C Data is divided into 100 sec bins |
 |
 |
| Module-wise count rates for Quadrant D Data is divided into 100 sec bins |
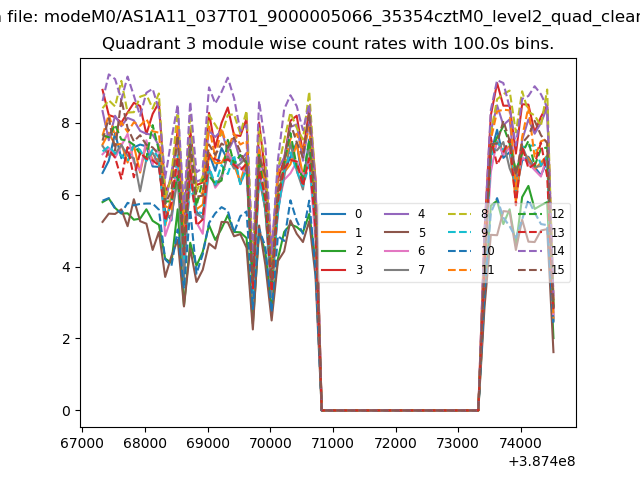 |
 |
| Parameter | Plot |
|---|---|
| CZT HV Monitor |  |
| D_VDD | 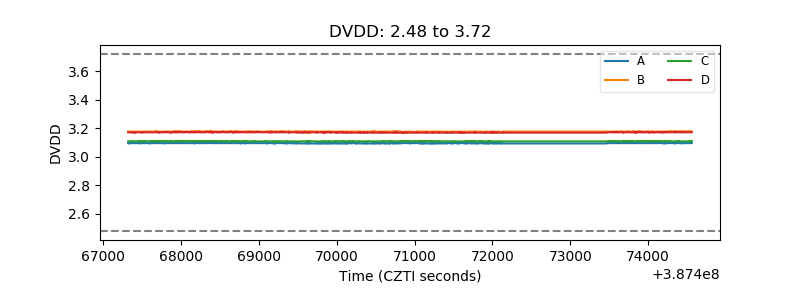 |
| Temperature 1 | 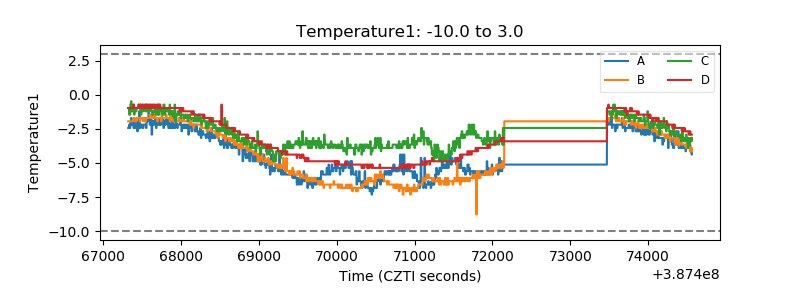 |
| Veto HV Monitor | 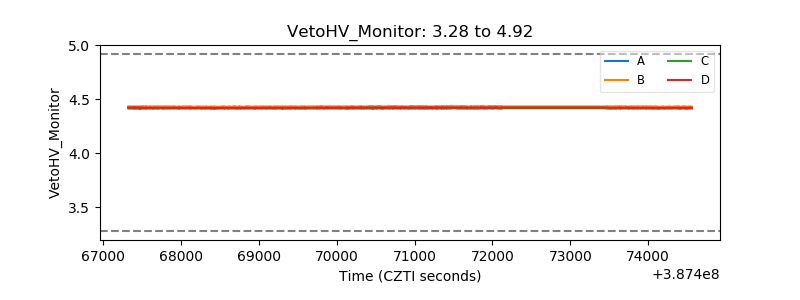 |
| Veto LLD | 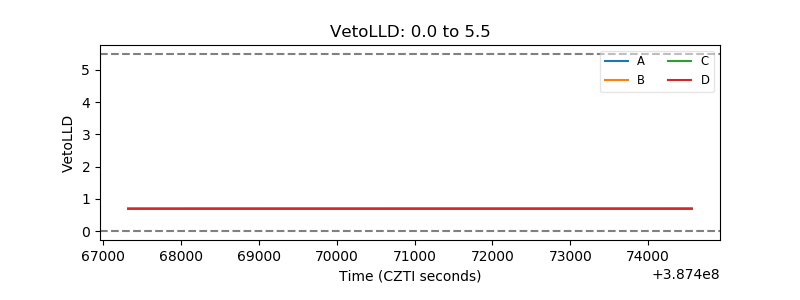 |
| Alpha Counter | 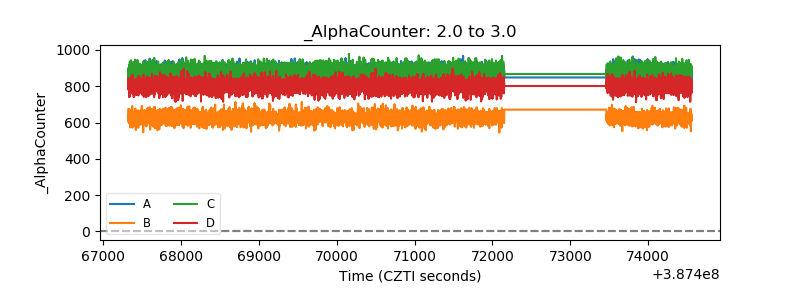 |
| _CPM_Rate | 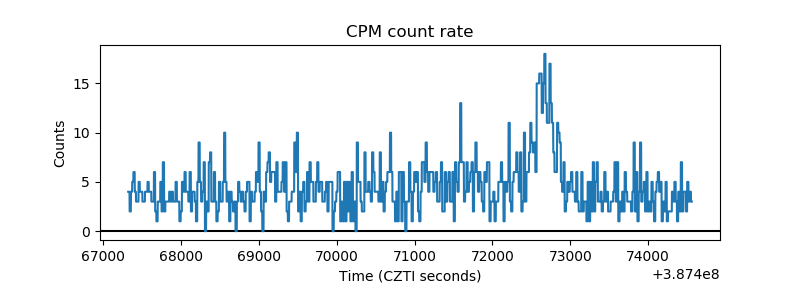 |
| CZT Counter | 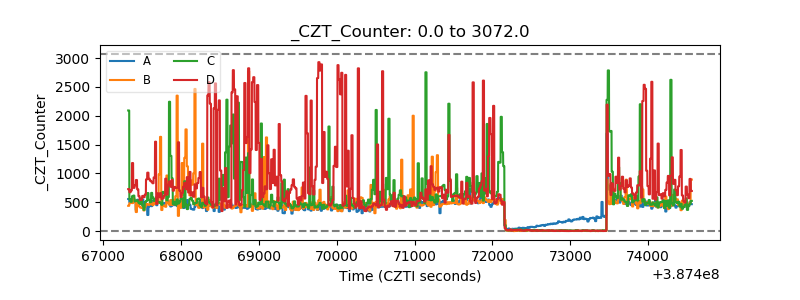 |
| +2.5 Volts monitor | 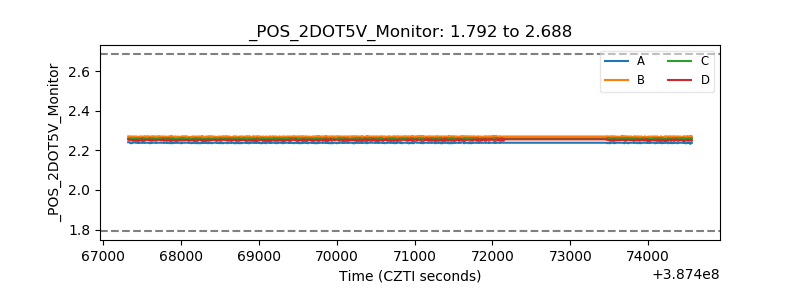 |
| +5 Volts monitor | 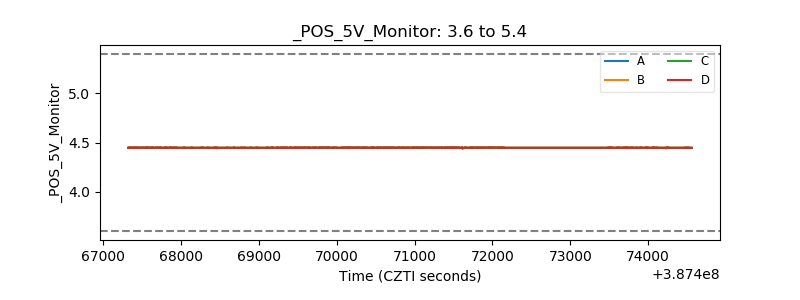 |
| _ROLL_ROT | 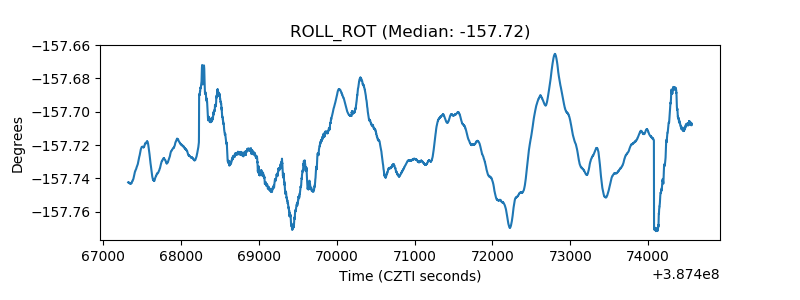 |
| _Roll_DEC | 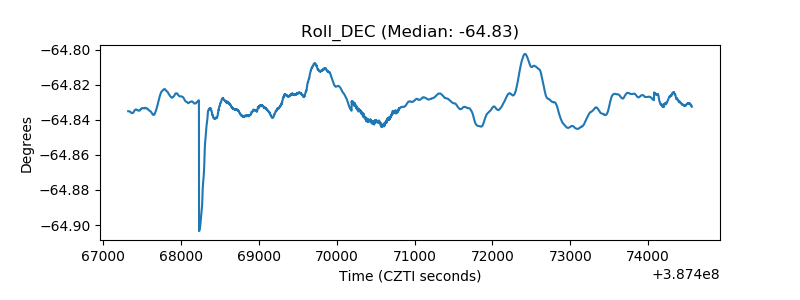 |
| _Roll_RA | 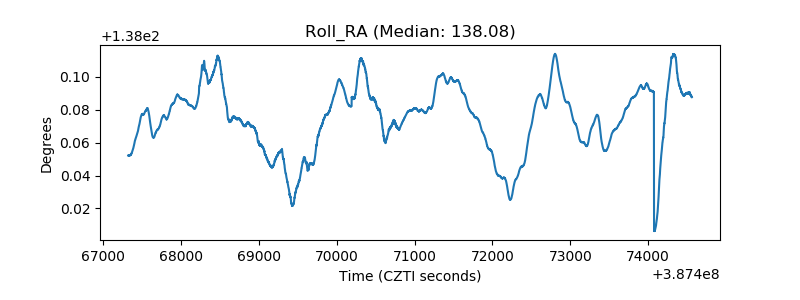 |
| Veto Counter | 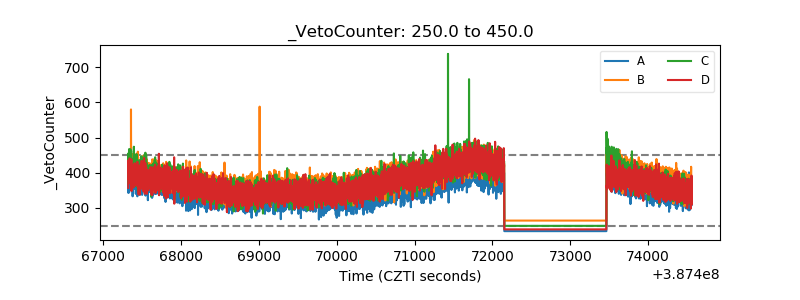 |