| Param | Original file | Final file |
|---|---|---|
| Filename | modeM0/AS1A11_037T01_9000005066_35353cztM0_level2.evt | modeM0/AS1A11_037T01_9000005066_35353cztM0_level2_quad_clean.evt |
| Size (bytes) | 131,829,120 | 20,508,480 |
| Size | 125.7 MB | 19.6 MB |
| Events in quadrant A | 763,628 | 131,082 |
| Events in quadrant B | 970,044 | 129,470 |
| Events in quadrant C | 1,062,966 | 122,345 |
| Events in quadrant D | 1,089,251 | 124,440 |
| Mode M0 | |||
|---|---|---|---|
| Quadrant | BADHDUFLAG | Total packets | Discarded packets |
| A | 0 | 3183 | 2 |
| B | 0 | 3842 | 1 |
| C | 0 | 4062 | 1 |
| D | 0 | 4263 | 1 |
| Mode M9 | |||
|---|---|---|---|
| Quadrant | BADHDUFLAG | Total packets | Discarded packets |
| A | 0 | 14 | 0 |
| B | 0 | 14 | 0 |
| C | 0 | 14 | 0 |
| D | 0 | 14 | 0 |
| Mode SS | |||
|---|---|---|---|
| Quadrant | BADHDUFLAG | Total packets | Discarded packets |
| A | 0 | 34 | 0 |
| B | 0 | 34 | 0 |
| C | 0 | 34 | 0 |
| D | 0 | 34 | 0 |
| Quadrant | Total seconds | Saturated seconds | Saturation percentage |
|---|---|---|---|
| A | 1525 | 3 | 0.196721% |
| B | 1525 | 56 | 3.672131% |
| C | 1525 | 101 | 6.622951% |
| D | 1525 | 12 | 0.786885% |
Noise dominated data is calculated using 1-second bins in cleaned event files. If a bin has >2000 counts, and if more than 50% of those come from <1% of pixels, then it is considered to be noise-dominated and hence unusable.
| Quadrant | # 1 sec bins | Bins with >0 counts | Bins with >2000 counts | High rate bins dominated by noise | Noise dominated (total time) | Noise dominated (detector-on time) | Marked lightcurve |
|---|---|---|---|---|---|---|---|
| A | 2956 | 1526 | 0 | 0 | 0.00% | 0.00% | 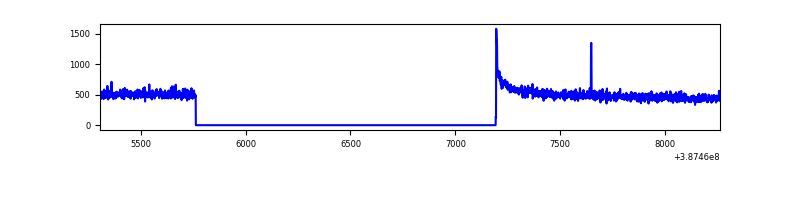 |
| B | 2956 | 1526 | 42 | 42 | 1.42% | 2.75% | 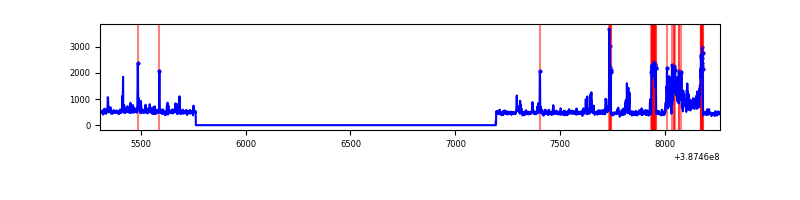 |
| C | 2956 | 1526 | 82 | 82 | 2.77% | 5.37% | 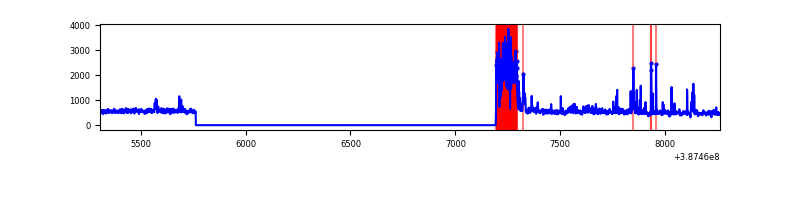 |
| D | 2956 | 1526 | 10 | 10 | 0.34% | 0.66% | 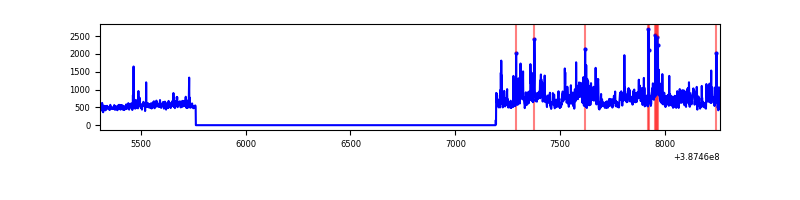 |
Top three noisy pixels from each quadrant. If the there are fewer than three noisy pixels in the level2.evt file, extra rows are filled as -1
| Pixel properties | Quadrant properties | ||||||
|---|---|---|---|---|---|---|---|
| Quadrant | DetID | PixID | Counts | Sigma | Mean | Median | Sigma |
| A | 10 | 83 | 47703 | 1194.44 | 183 | 179 | 39.8 |
| A | 7 | 191 | 3106 | 73.57 | 183 | 179 | 39.8 |
| A | 13 | 254 | 2170 | 50.04 | 183 | 179 | 39.8 |
| B | 5 | 236 | 199967 | 5441.99 | 178 | 174 | 36.7 |
| B | 5 | 172 | 56892 | 1544.89 | 178 | 174 | 36.7 |
| B | 0 | 155 | 5211 | 137.2 | 178 | 174 | 36.7 |
| C | 0 | 10 | 294045 | 7142.08 | 170 | 170 | 41.1 |
| C | 15 | 214 | 63622 | 1542.08 | 170 | 170 | 41.1 |
| C | 15 | 208 | 15633 | 375.8 | 170 | 170 | 41.1 |
| D | 7 | 80 | 135828 | 3049.73 | 178 | 173 | 44.5 |
| D | 8 | 195 | 131421 | 2950.65 | 178 | 173 | 44.5 |
| D | 2 | 152 | 48926 | 1096.04 | 178 | 173 | 44.5 |
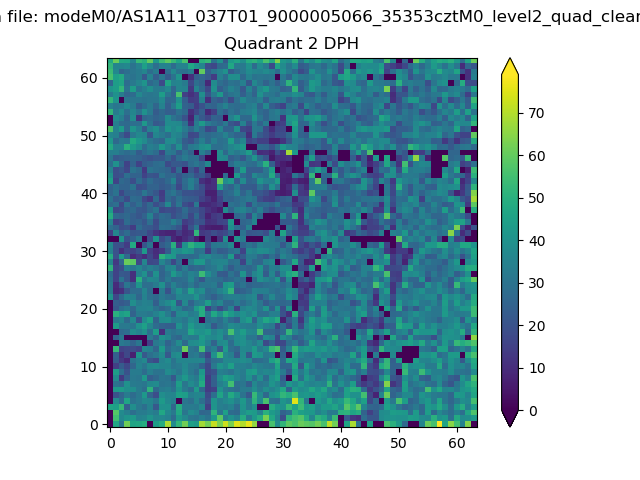
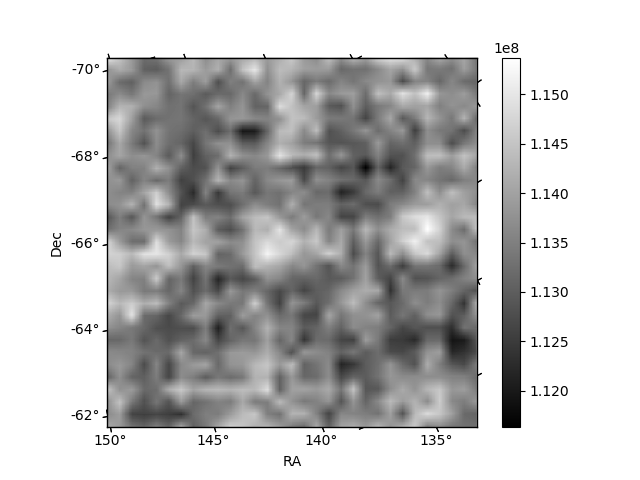
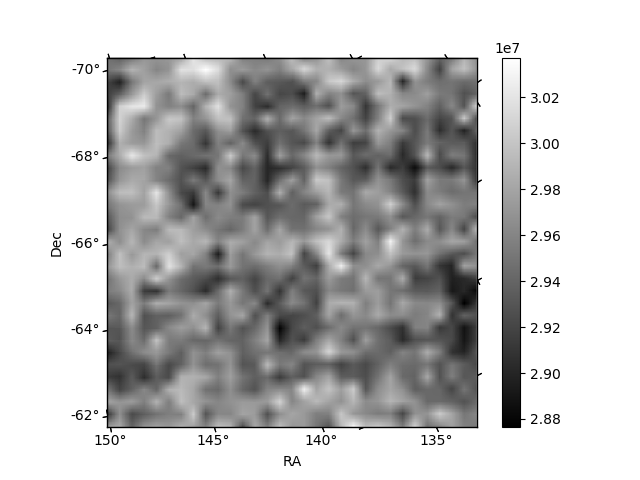
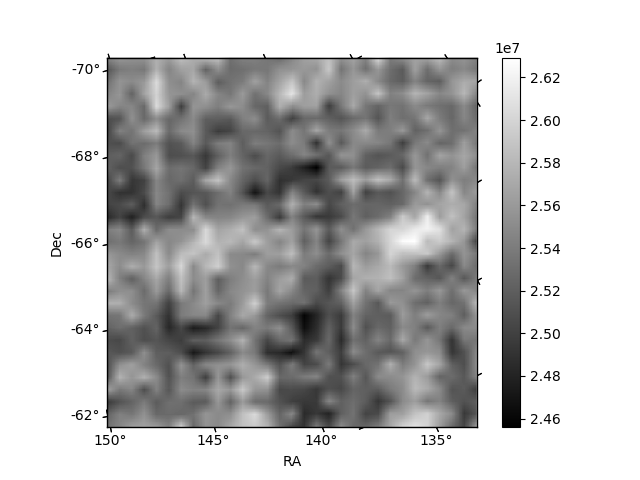
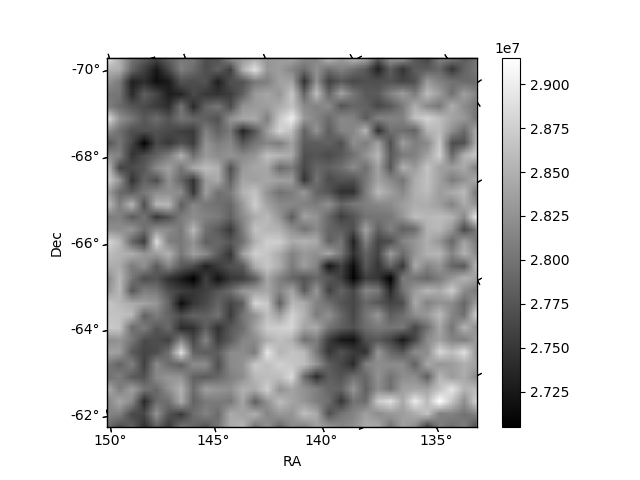
Histogram calculated using DETX and DETY for each event in the final _common_clean file
| Quadrant A | 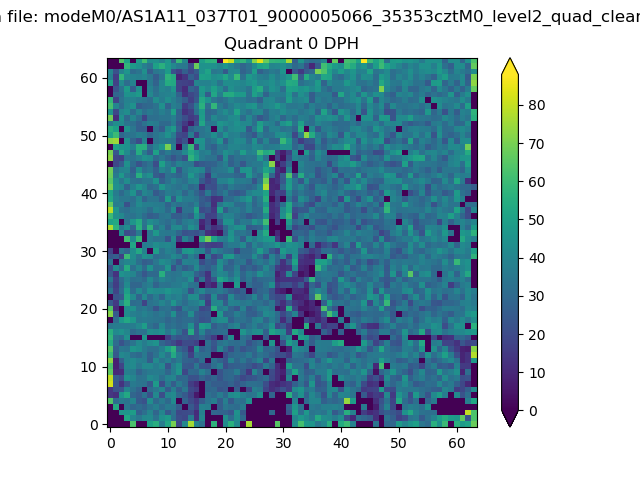 |
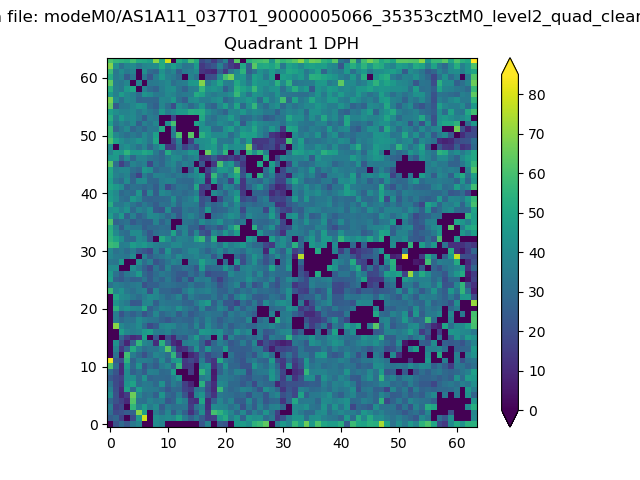 |
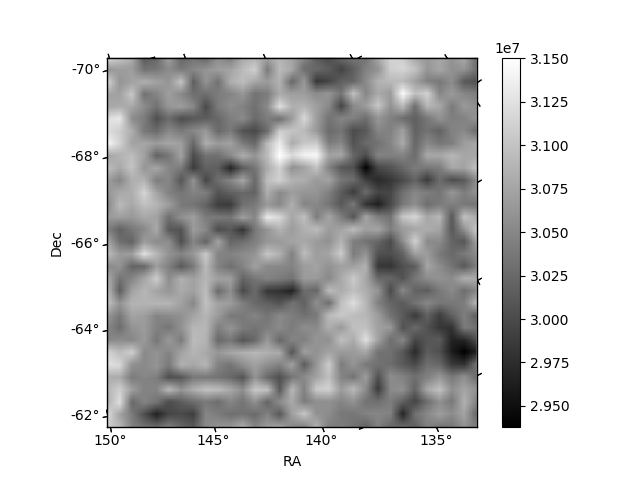
Quadrant B |
|---|---|---|---|
| Quadrant D | 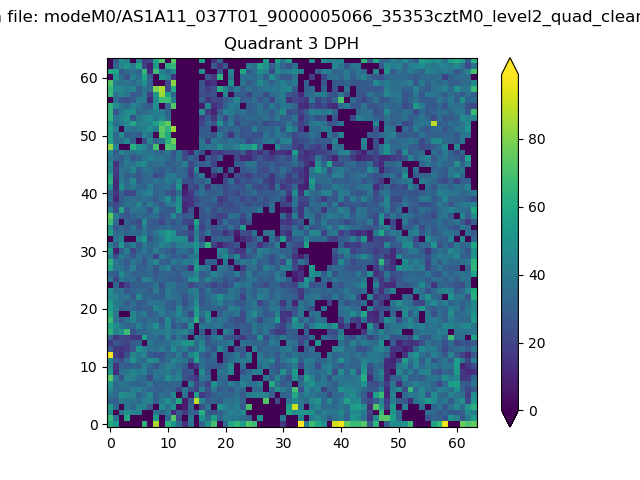 |
 |
Quadrant C |
| Plot type | Count rate plots | Images |
|---|---|---|
| Comparison with Poisson distribution Blue bars denote a histogram of data divided into 1 sec bins. Red curve is a Poisson curve with rate = median count rate of data. |
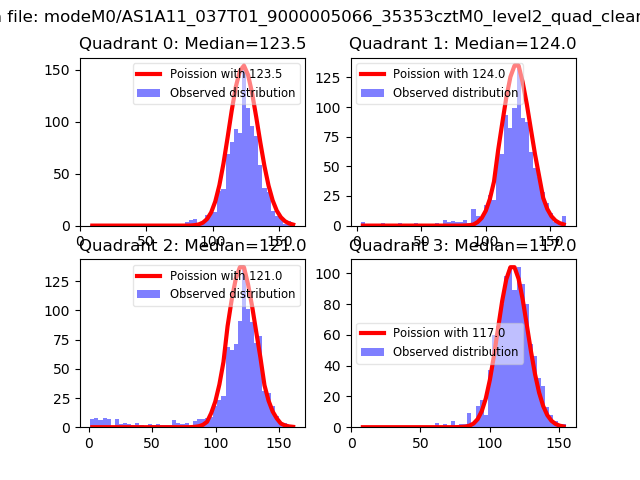 |
 |
| Quadrant-wise count rates Data is divided into 100 sec bins |
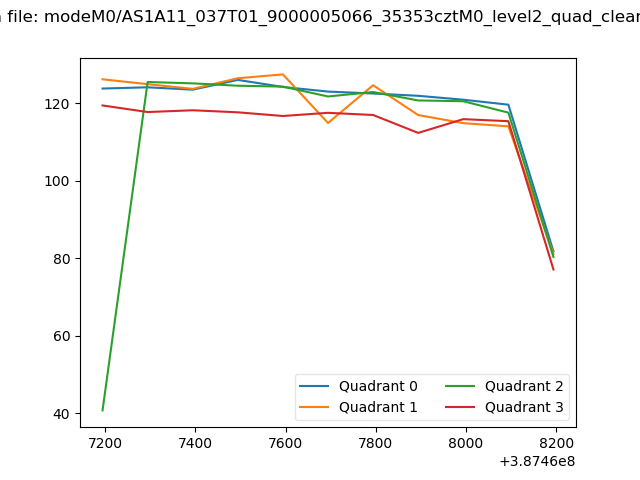 |
|
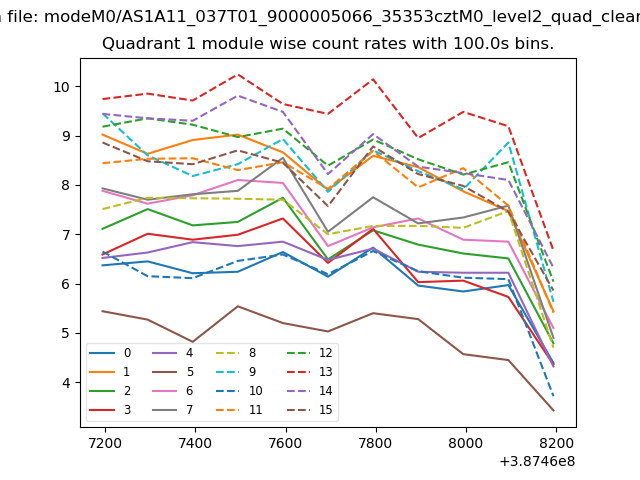
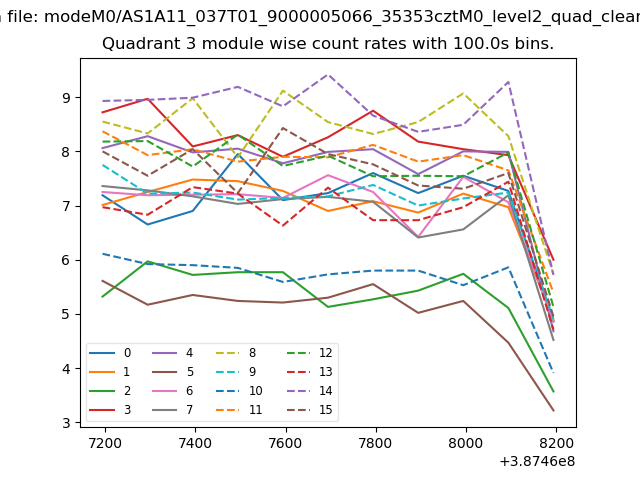
| Module-wise count rates for Quadrant A Data is divided into 100 sec bins |
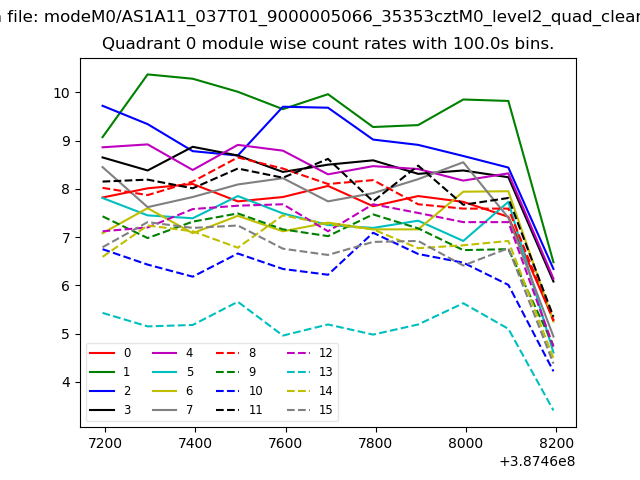 |
 |
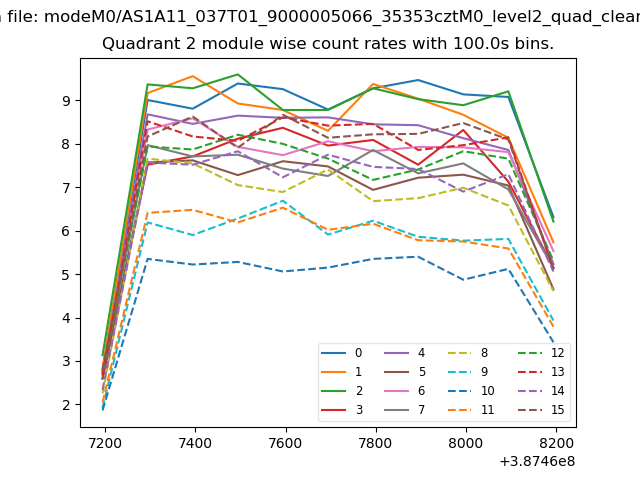
| Module-wise count rates for Quadrant B Data is divided into 100 sec bins |
 |
 |
| Module-wise count rates for Quadrant C Data is divided into 100 sec bins |
 |
 |
| Module-wise count rates for Quadrant D Data is divided into 100 sec bins |
 |
 |
| Parameter | Plot |
|---|---|
| CZT HV Monitor | 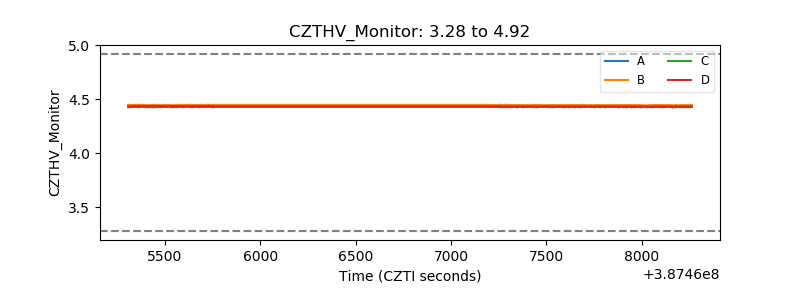 |
| D_VDD | 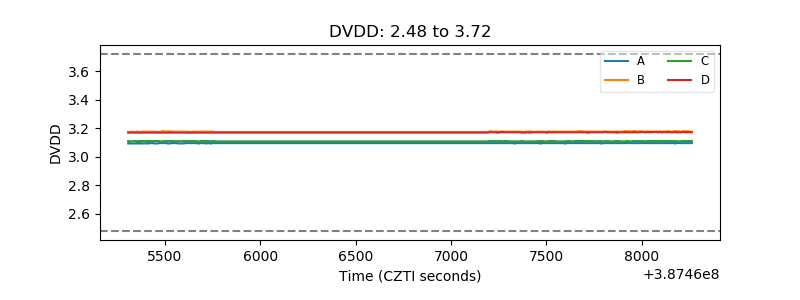 |
| Temperature 1 | 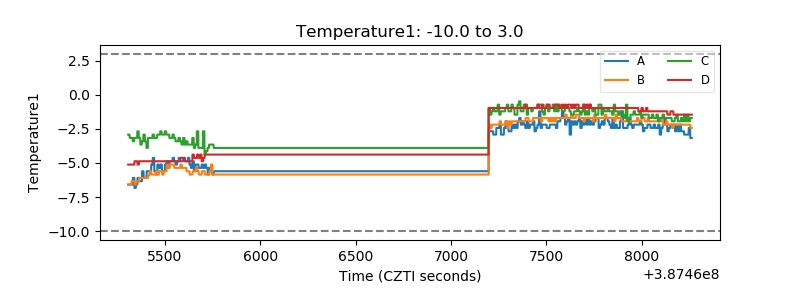 |
| Veto HV Monitor | 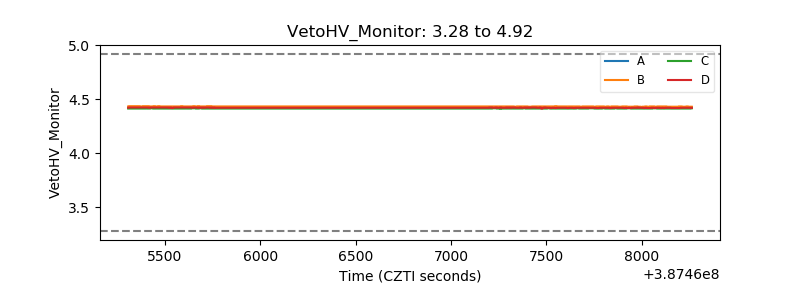 |
| Veto LLD | 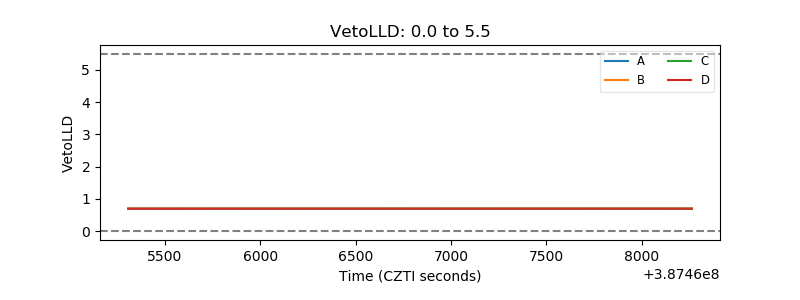 |
| Alpha Counter | 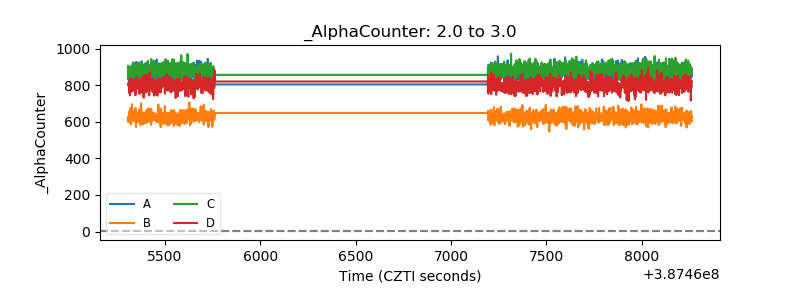 |
| _CPM_Rate | 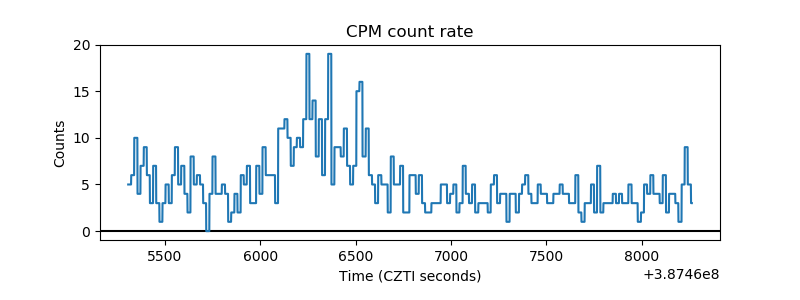 |
| CZT Counter | 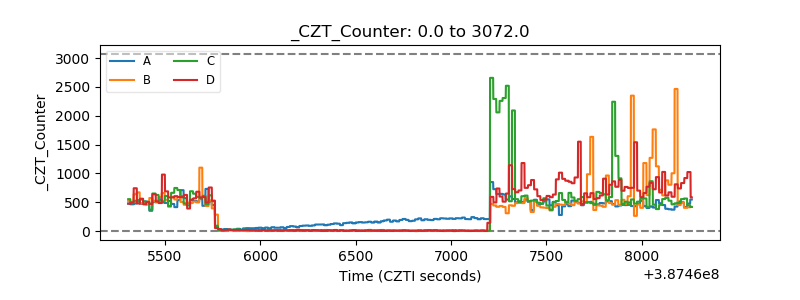 |
| +2.5 Volts monitor | 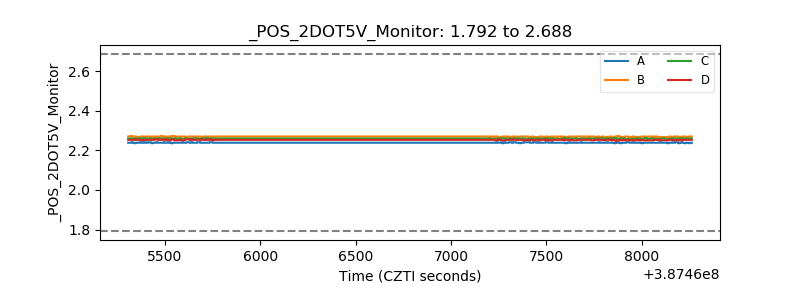 |
| +5 Volts monitor | 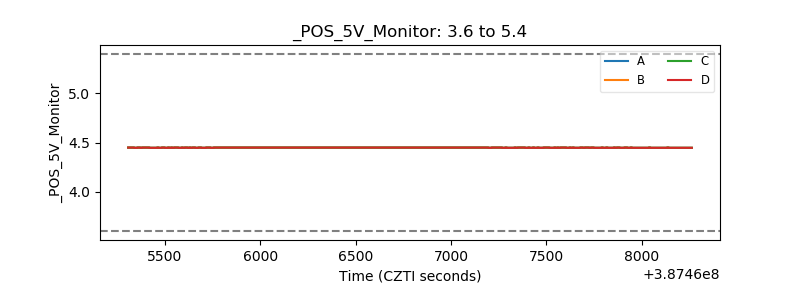 |
| _ROLL_ROT | 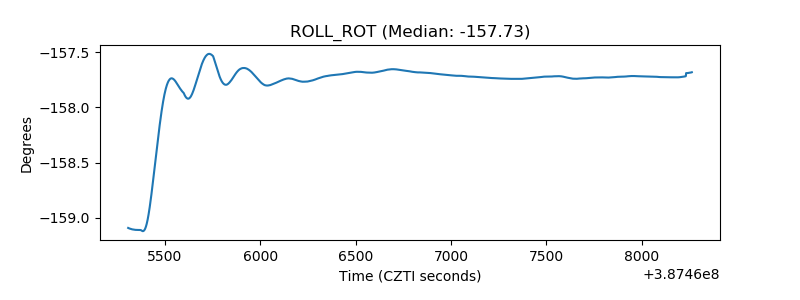 |
| _Roll_DEC |  |
| _Roll_RA | 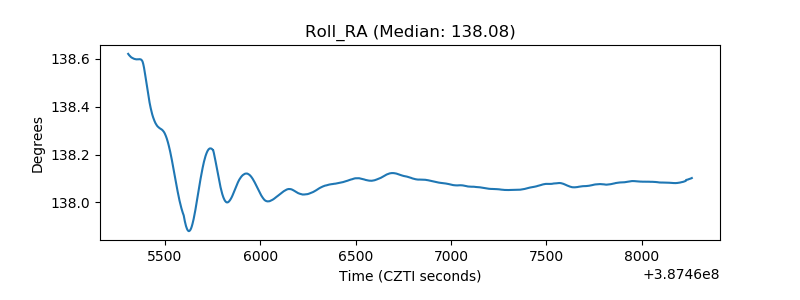 |
| Veto Counter | 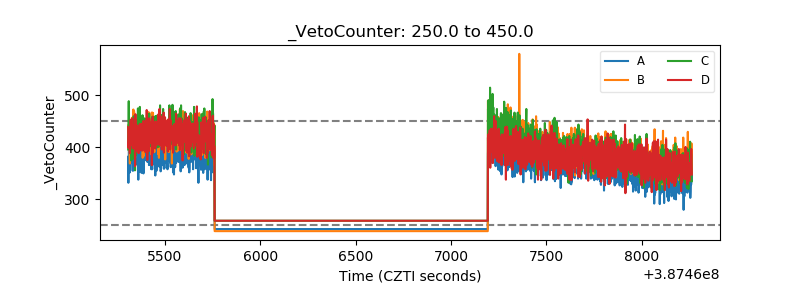 |