| Param | Original file | Final file |
|---|---|---|
| Filename | modeM0/AS1A11_093T01_9000005064_35352cztM0_level2.evt | modeM0/AS1A11_093T01_9000005064_35352cztM0_level2_quad_clean.evt |
| Size (bytes) | 465,880,320 | 63,927,360 |
| Size | 444.3 MB | 61.0 MB |
| Events in quadrant A | 2,870,416 | 391,285 |
| Events in quadrant B | 3,563,907 | 388,727 |
| Events in quadrant C | 3,229,490 | 396,251 |
| Events in quadrant D | 4,068,229 | 370,366 |
| Mode M0 | |||
|---|---|---|---|
| Quadrant | BADHDUFLAG | Total packets | Discarded packets |
| A | 0 | 12077 | 3 |
| B | 0 | 14139 | 2 |
| C | 0 | 12831 | 2 |
| D | 0 | 15739 | 2 |
| Mode SS | |||
|---|---|---|---|
| Quadrant | BADHDUFLAG | Total packets | Discarded packets |
| A | 0 | 112 | 0 |
| B | 0 | 112 | 0 |
| C | 0 | 112 | 0 |
| D | 0 | 112 | 0 |
| Mode M9 | |||
|---|---|---|---|
| Quadrant | BADHDUFLAG | Total packets | Discarded packets |
| A | 0 | 24 | 0 |
| B | 0 | 24 | 0 |
| C | 0 | 24 | 0 |
| D | 0 | 25 | 0 |
| Quadrant | Total seconds | Saturated seconds | Saturation percentage |
|---|---|---|---|
| A | 5560 | 95 | 1.708633% |
| B | 5560 | 268 | 4.820144% |
| C | 5560 | 116 | 2.086331% |
| D | 5560 | 196 | 3.525180% |
Noise dominated data is calculated using 1-second bins in cleaned event files. If a bin has >2000 counts, and if more than 50% of those come from <1% of pixels, then it is considered to be noise-dominated and hence unusable.
| Quadrant | # 1 sec bins | Bins with >0 counts | Bins with >2000 counts | High rate bins dominated by noise | Noise dominated (total time) | Noise dominated (detector-on time) | Marked lightcurve |
|---|---|---|---|---|---|---|---|
| A | 7293 | 5561 | 64 | 64 | 0.88% | 1.15% | 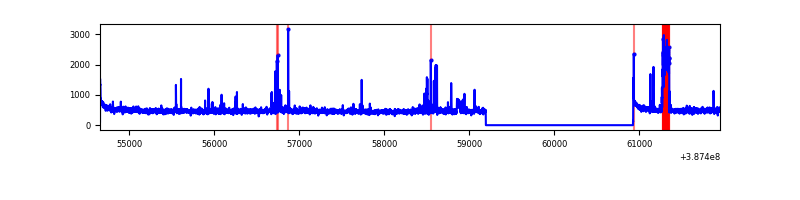 |
| B | 7293 | 5561 | 162 | 162 | 2.22% | 2.91% | 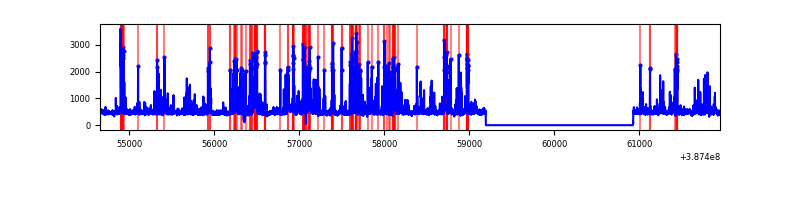 |
| C | 7293 | 5561 | 104 | 104 | 1.43% | 1.87% | 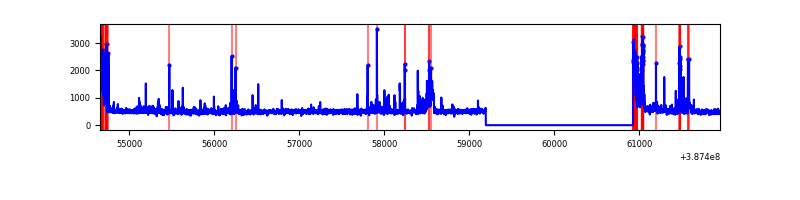 |
| D | 7293 | 5561 | 183 | 183 | 2.51% | 3.29% | 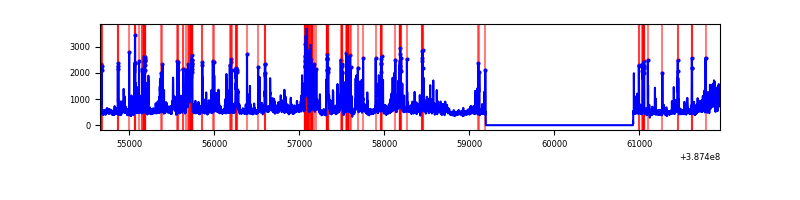 |
Top three noisy pixels from each quadrant. If the there are fewer than three noisy pixels in the level2.evt file, extra rows are filled as -1
| Pixel properties | Quadrant properties | ||||||
|---|---|---|---|---|---|---|---|
| Quadrant | DetID | PixID | Counts | Sigma | Mean | Median | Sigma |
| A | 15 | 169 | 233143 | 1807.89 | 637 | 625 | 128.6 |
| A | 10 | 83 | 112654 | 871.06 | 637 | 625 | 128.6 |
| A | 9 | 143 | 37722 | 288.44 | 637 | 625 | 128.6 |
| B | 5 | 236 | 637758 | 5324.13 | 625 | 608 | 119.7 |
| B | 5 | 172 | 383447 | 3199.07 | 625 | 608 | 119.7 |
| B | 4 | 232 | 31081 | 254.64 | 625 | 608 | 119.7 |
| C | 0 | 10 | 322436 | 2275.46 | 617 | 620 | 141.4 |
| C | 15 | 214 | 228111 | 1608.52 | 617 | 620 | 141.4 |
| C | 1 | 23 | 175913 | 1239.44 | 617 | 620 | 141.4 |
| D | 7 | 80 | 539959 | 3627.12 | 616 | 600 | 148.7 |
| D | 8 | 195 | 384688 | 2582.94 | 616 | 600 | 148.7 |
| D | 12 | 235 | 186856 | 1252.55 | 616 | 600 | 148.7 |
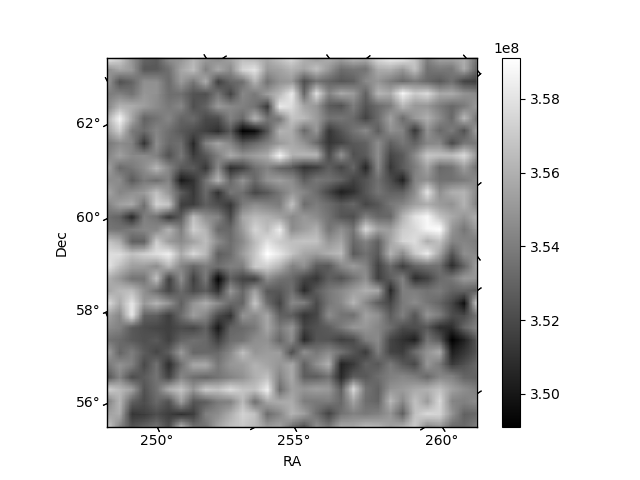
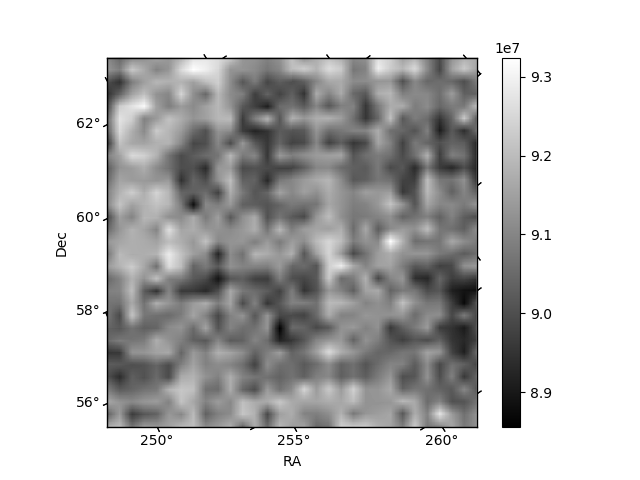
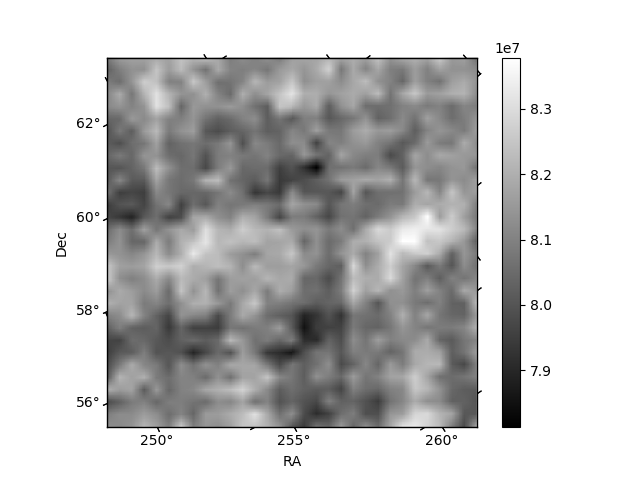
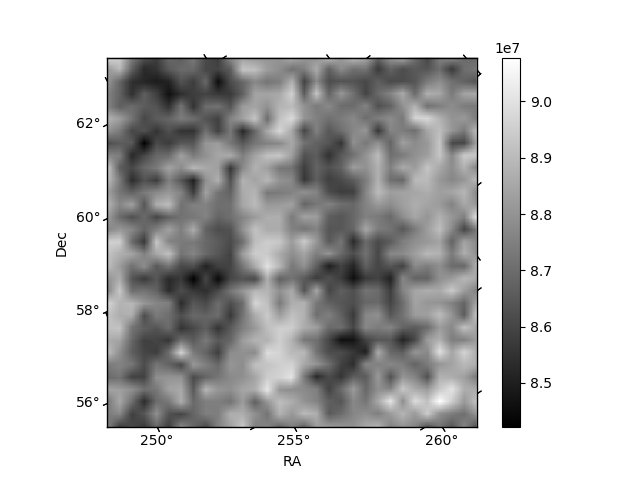
Histogram calculated using DETX and DETY for each event in the final _common_clean file
| Quadrant A | 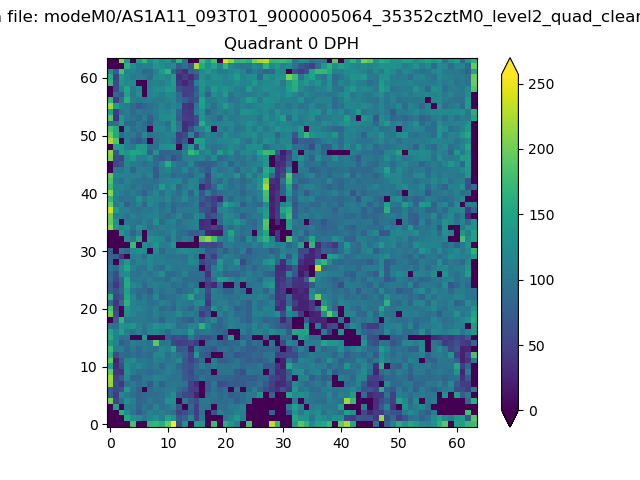 |
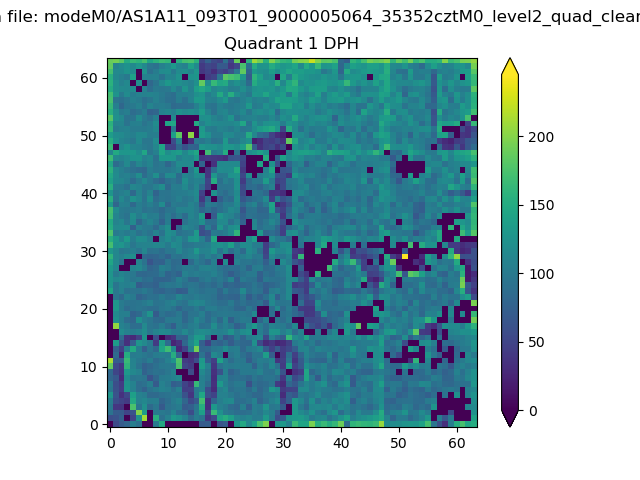 |
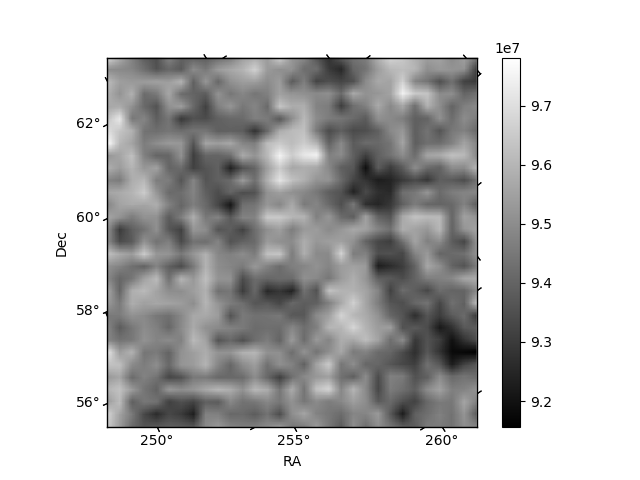
Quadrant B |
|---|---|---|---|
| Quadrant D | 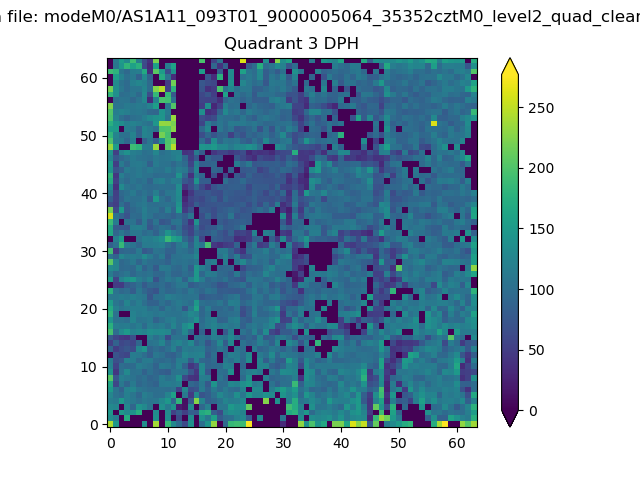 |
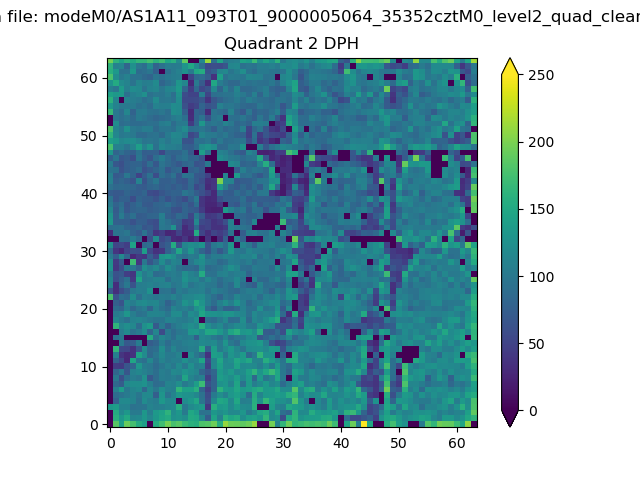 |
Quadrant C |
| Plot type | Count rate plots | Images |
|---|---|---|
| Comparison with Poisson distribution Blue bars denote a histogram of data divided into 1 sec bins. Red curve is a Poisson curve with rate = median count rate of data. |
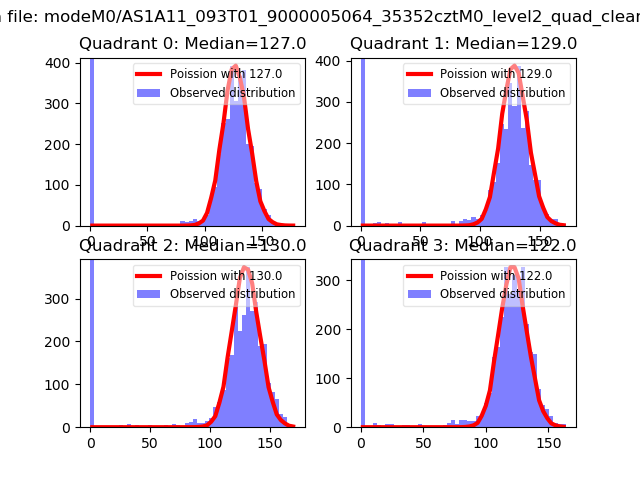 |
 |
| Quadrant-wise count rates Data is divided into 100 sec bins |
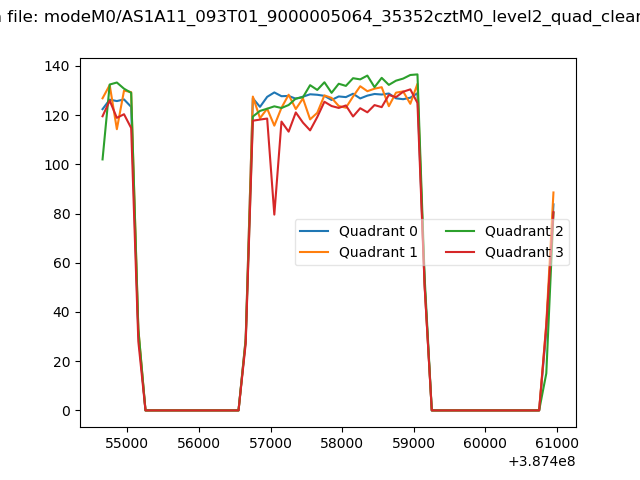 |
|
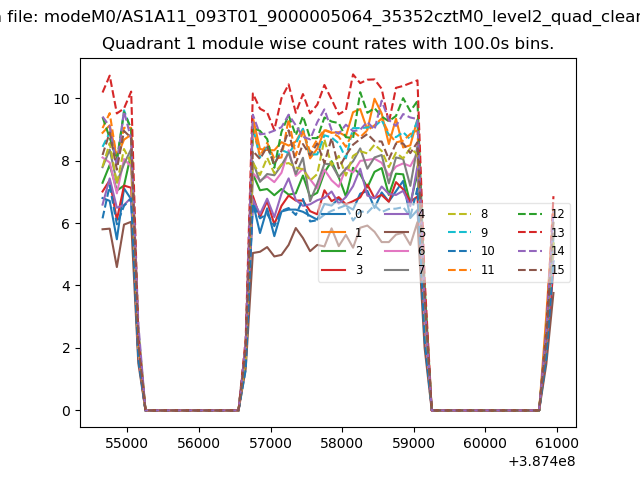
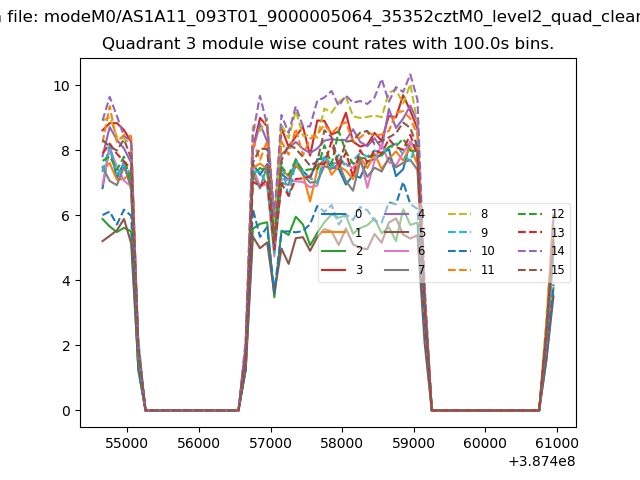
| Module-wise count rates for Quadrant A Data is divided into 100 sec bins |
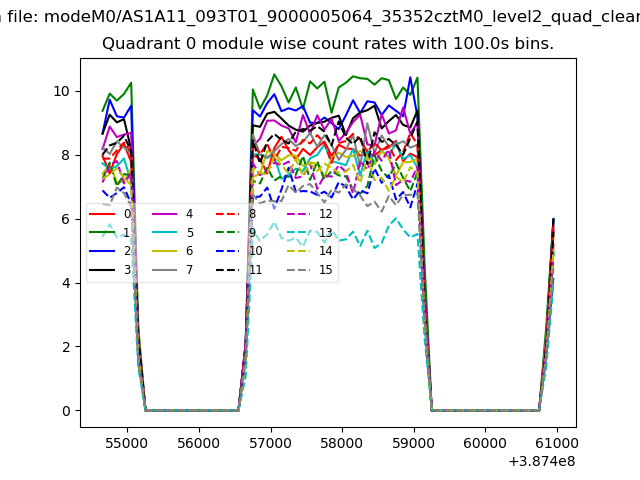 |
 |
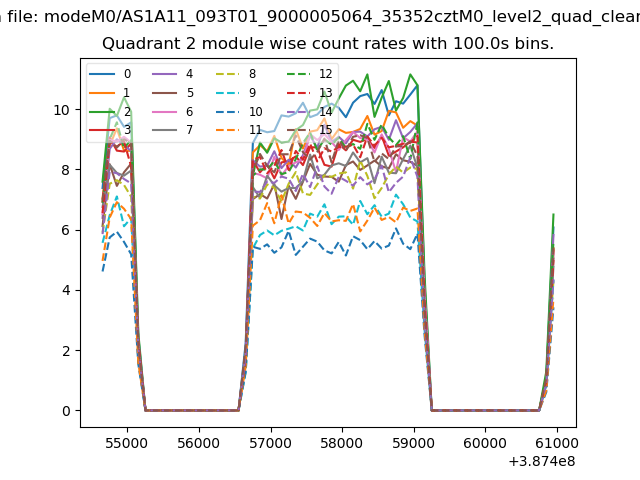
| Module-wise count rates for Quadrant B Data is divided into 100 sec bins |
 |
 |
| Module-wise count rates for Quadrant C Data is divided into 100 sec bins |
 |
 |
| Module-wise count rates for Quadrant D Data is divided into 100 sec bins |
 |
 |
| Parameter | Plot |
|---|---|
| CZT HV Monitor | 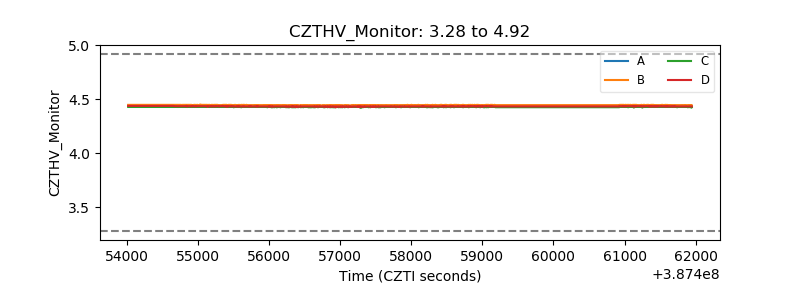 |
| D_VDD | 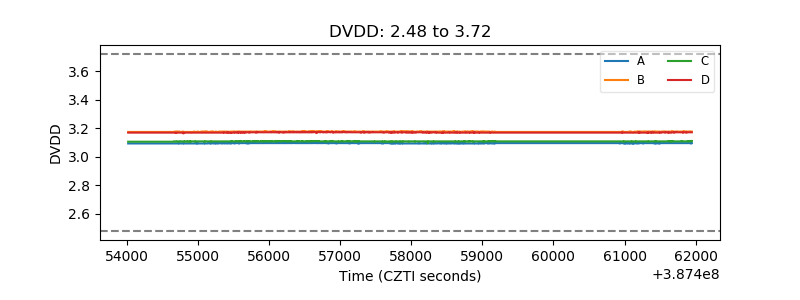 |
| Temperature 1 | 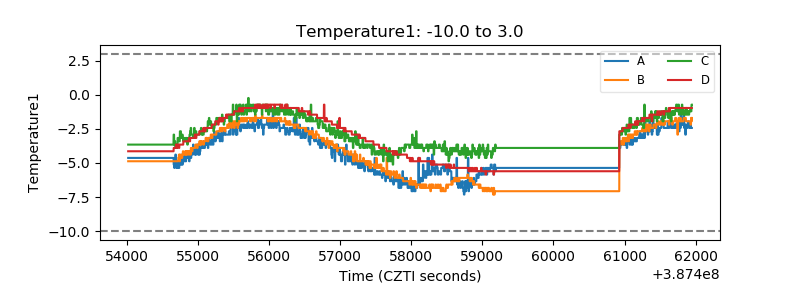 |
| Veto HV Monitor | 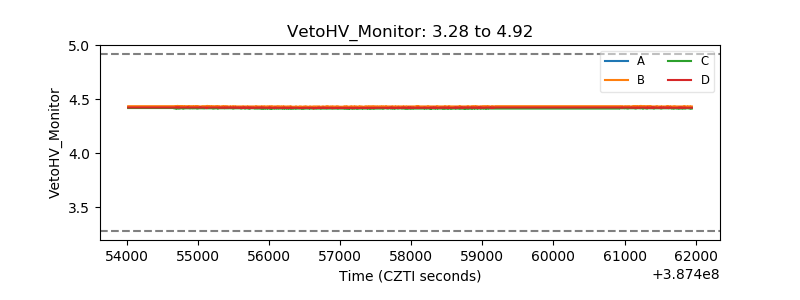 |
| Veto LLD | 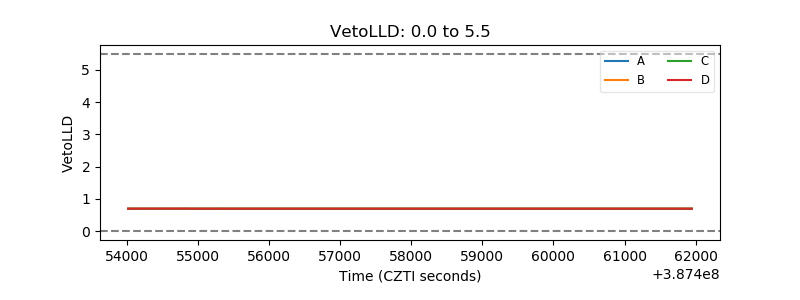 |
| Alpha Counter | 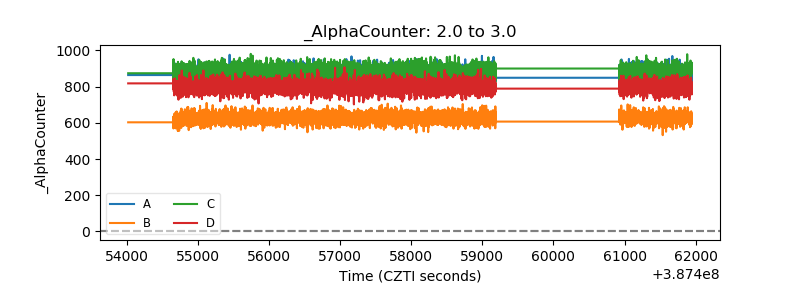 |
| _CPM_Rate | 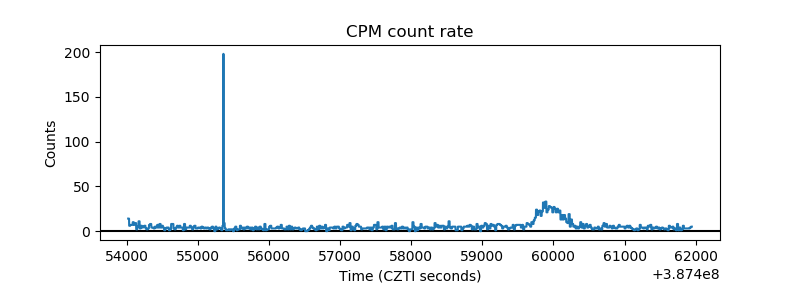 |
| CZT Counter | 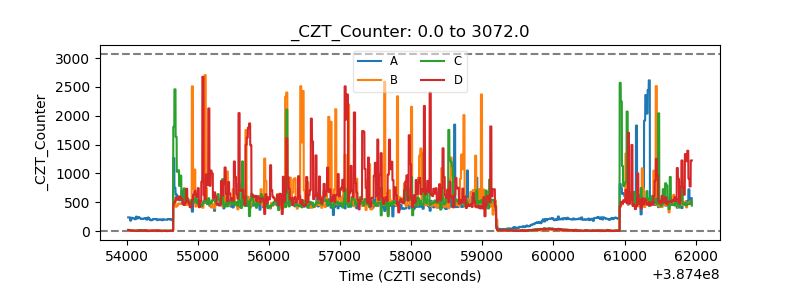 |
| +2.5 Volts monitor | 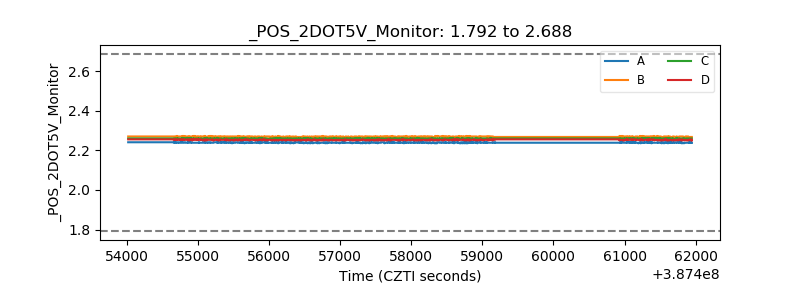 |
| +5 Volts monitor | 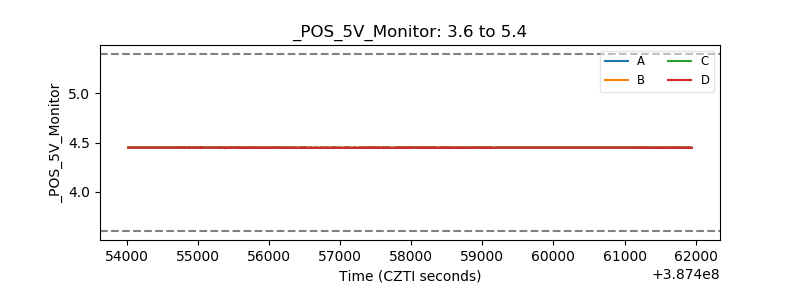 |
| _ROLL_ROT | 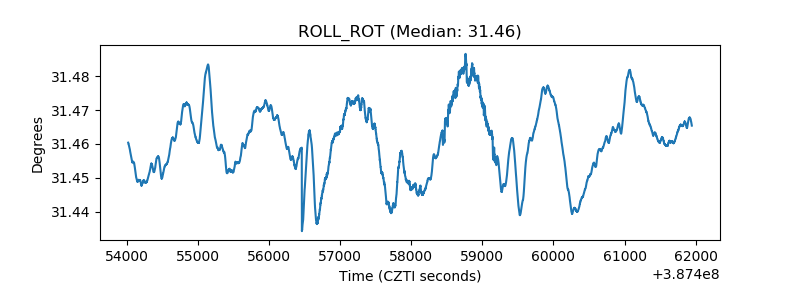 |
| _Roll_DEC | 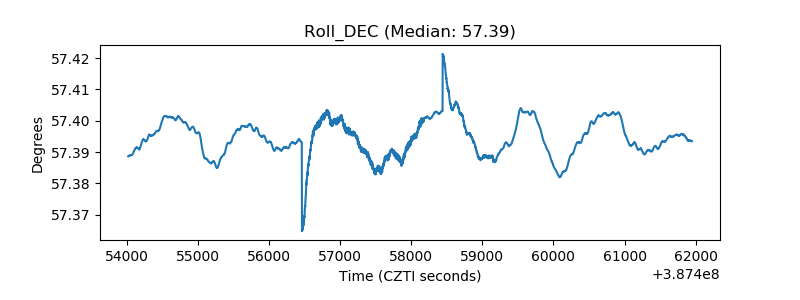 |
| _Roll_RA | 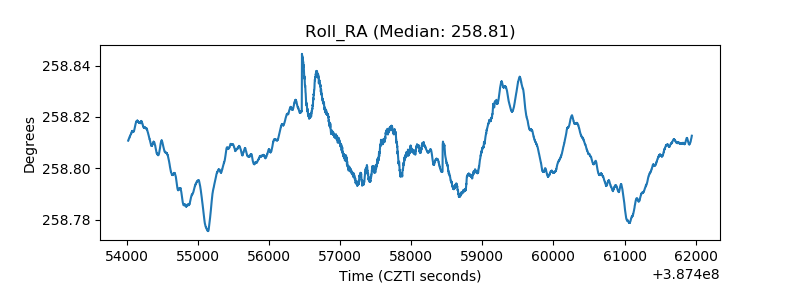 |
| Veto Counter | 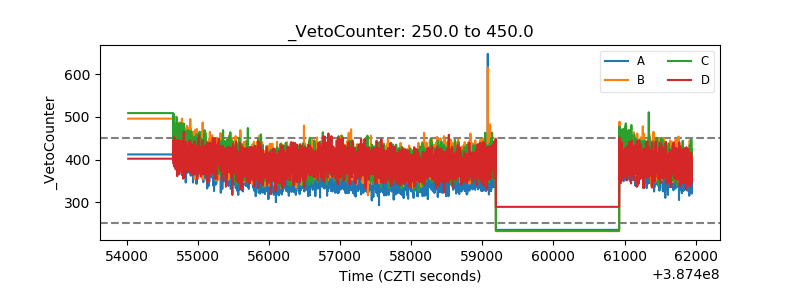 |