| Param | Original file | Final file |
|---|---|---|
| Filename | modeM0/AS1A11_093T01_9000005064_35351cztM0_level2.evt | modeM0/AS1A11_093T01_9000005064_35351cztM0_level2_quad_clean.evt |
| Size (bytes) | 1,416,960,000 | 220,115,520 |
| Size | 1.3 GB | 209.9 MB |
| Events in quadrant A | 8,267,598 | 1,399,166 |
| Events in quadrant B | 9,784,000 | 1,416,886 |
| Events in quadrant C | 9,755,466 | 1,404,169 |
| Events in quadrant D | 13,970,245 | 1,284,813 |
| Mode M0 | |||
|---|---|---|---|
| Quadrant | BADHDUFLAG | Total packets | Discarded packets |
| A | 0 | 34535 | 5 |
| B | 0 | 39399 | 4 |
| C | 0 | 38697 | 4 |
| D | 0 | 52871 | 6 |
| Mode SS | |||
|---|---|---|---|
| Quadrant | BADHDUFLAG | Total packets | Discarded packets |
| A | 0 | 346 | 0 |
| B | 0 | 346 | 0 |
| C | 0 | 346 | 0 |
| D | 0 | 346 | 0 |
| Mode M9 | |||
|---|---|---|---|
| Quadrant | BADHDUFLAG | Total packets | Discarded packets |
| A | 0 | 83 | 0 |
| B | 0 | 83 | 0 |
| C | 0 | 83 | 0 |
| D | 0 | 83 | 0 |
| Quadrant | Total seconds | Saturated seconds | Saturation percentage |
|---|---|---|---|
| A | 16839 | 21 | 0.124710% |
| B | 16839 | 392 | 2.327929% |
| C | 16839 | 280 | 1.662807% |
| D | 16838 | 969 | 5.754840% |
Noise dominated data is calculated using 1-second bins in cleaned event files. If a bin has >2000 counts, and if more than 50% of those come from <1% of pixels, then it is considered to be noise-dominated and hence unusable.
| Quadrant | # 1 sec bins | Bins with >0 counts | Bins with >2000 counts | High rate bins dominated by noise | Noise dominated (total time) | Noise dominated (detector-on time) | Marked lightcurve |
|---|---|---|---|---|---|---|---|
| A | 25148 | 16843 | 2 | 2 | 0.01% | 0.01% | 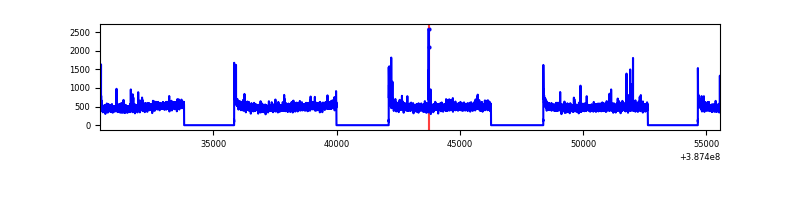 |
| B | 25148 | 16843 | 292 | 292 | 1.16% | 1.73% | 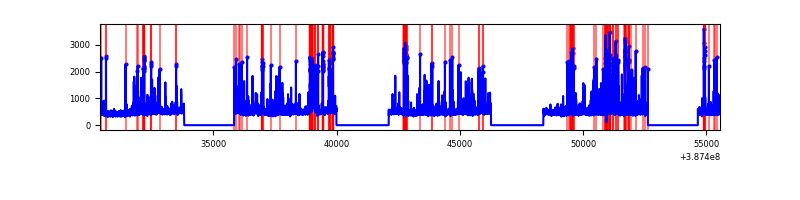 |
| C | 25148 | 16843 | 257 | 257 | 1.02% | 1.53% | 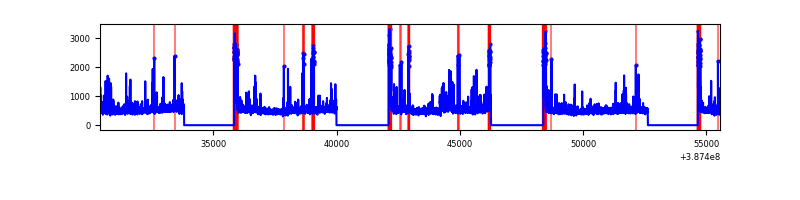 |
| D | 25148 | 16843 | 894 | 894 | 3.55% | 5.31% | 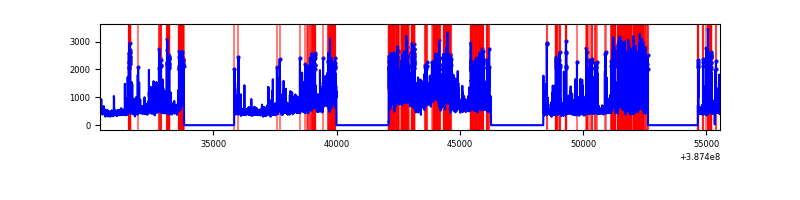 |
Top three noisy pixels from each quadrant. If the there are fewer than three noisy pixels in the level2.evt file, extra rows are filled as -1
| Pixel properties | Quadrant properties | ||||||
|---|---|---|---|---|---|---|---|
| Quadrant | DetID | PixID | Counts | Sigma | Mean | Median | Sigma |
| A | 10 | 83 | 281742 | 701.15 | 2024 | 1990 | 399.0 |
| A | 13 | 6 | 55171 | 133.29 | 2024 | 1990 | 399.0 |
| A | 9 | 143 | 43893 | 105.02 | 2024 | 1990 | 399.0 |
| B | 5 | 172 | 1029789 | 2795.91 | 1984 | 1931 | 367.6 |
| B | 5 | 236 | 574538 | 1557.57 | 1984 | 1931 | 367.6 |
| B | 4 | 232 | 134910 | 361.72 | 1984 | 1931 | 367.6 |
| C | 0 | 10 | 921570 | 2100.58 | 1935 | 1949 | 437.8 |
| C | 15 | 214 | 693361 | 1579.31 | 1935 | 1949 | 437.8 |
| C | 3 | 233 | 297369 | 674.79 | 1935 | 1949 | 437.8 |
| D | 7 | 80 | 3211205 | 7002.75 | 1917 | 1865 | 458.3 |
| D | 8 | 195 | 913030 | 1988.15 | 1917 | 1865 | 458.3 |
| D | 10 | 118 | 617235 | 1342.73 | 1917 | 1865 | 458.3 |
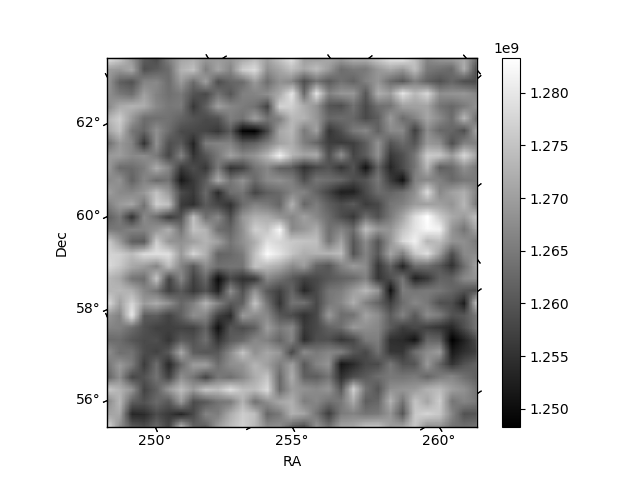
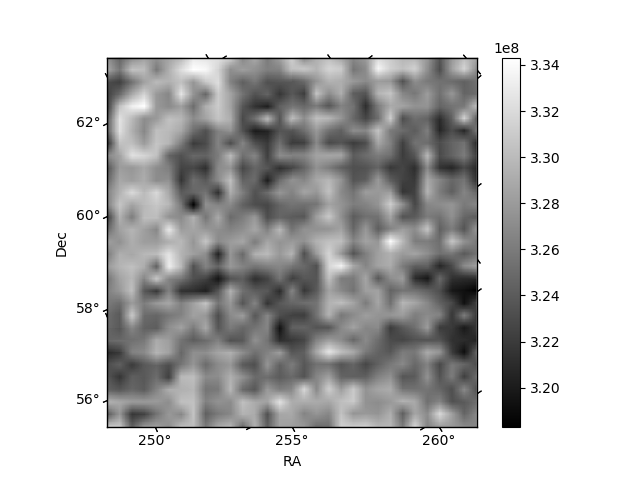
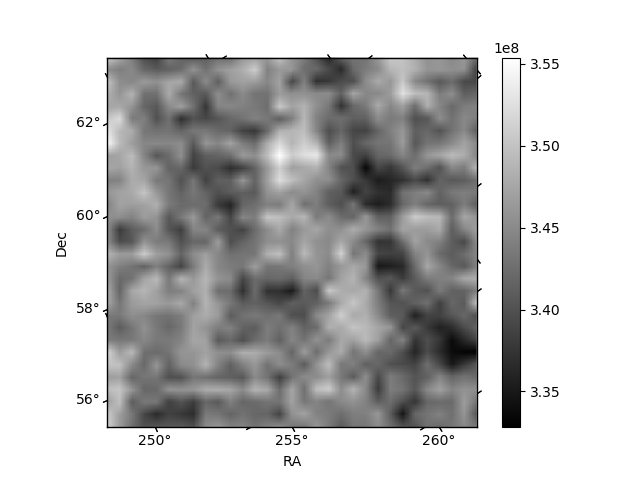
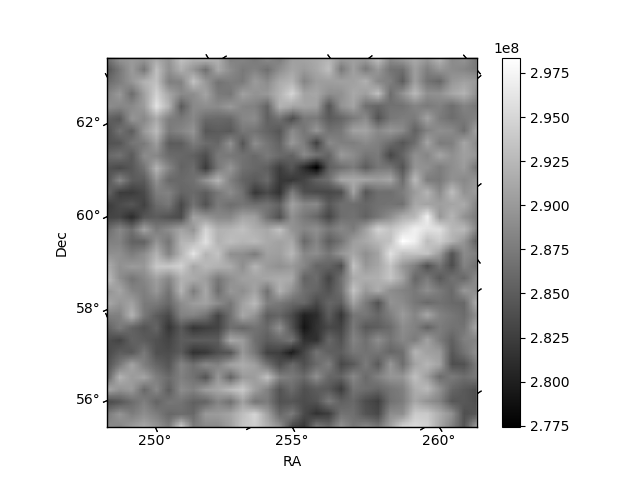
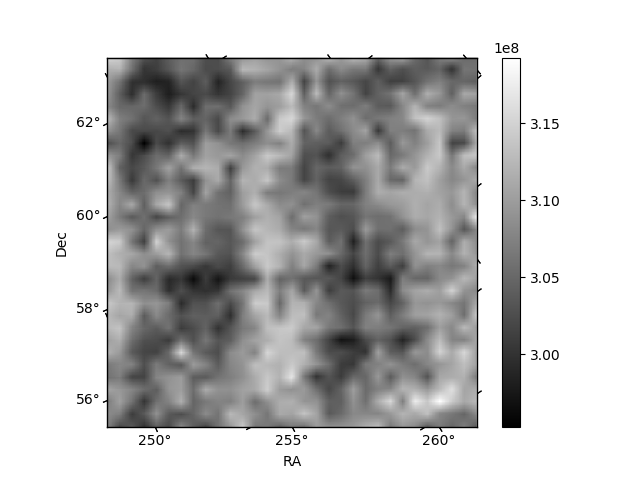
Histogram calculated using DETX and DETY for each event in the final _common_clean file
| Quadrant A | 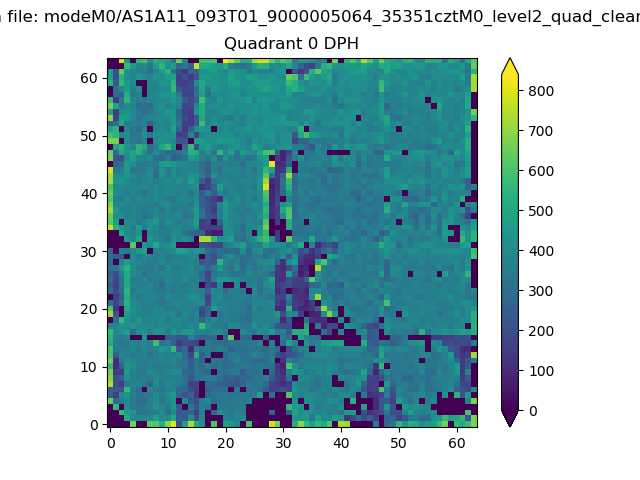 |
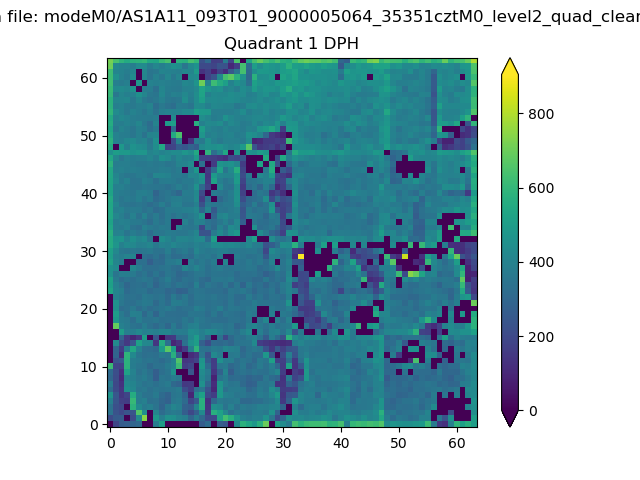 |
Quadrant B |
|---|---|---|---|
| Quadrant D | 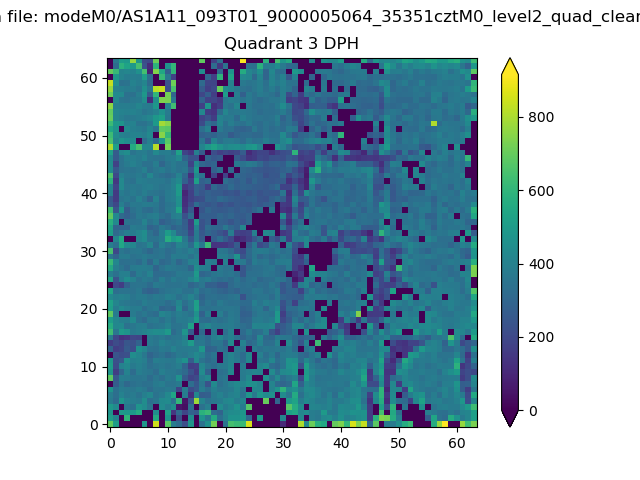 |
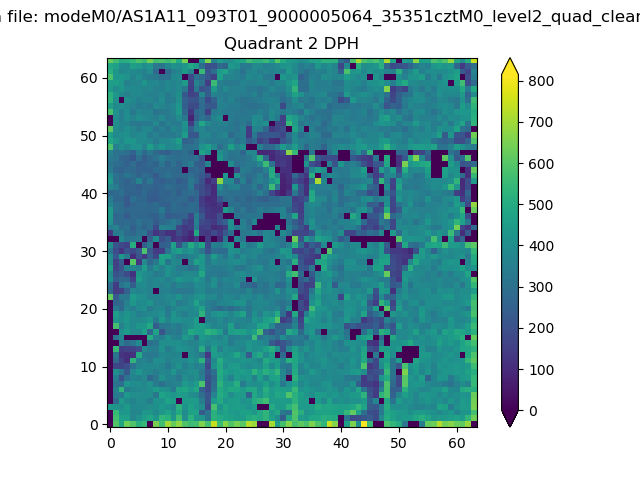 |
Quadrant C |
| Plot type | Count rate plots | Images |
|---|---|---|
| Comparison with Poisson distribution Blue bars denote a histogram of data divided into 1 sec bins. Red curve is a Poisson curve with rate = median count rate of data. |
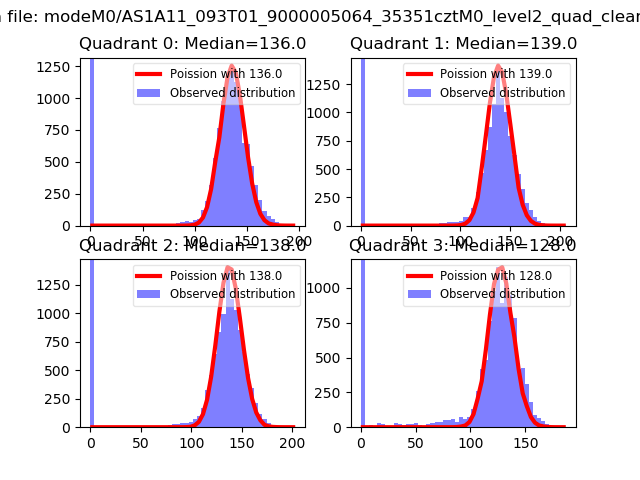 |
 |
| Quadrant-wise count rates Data is divided into 100 sec bins |
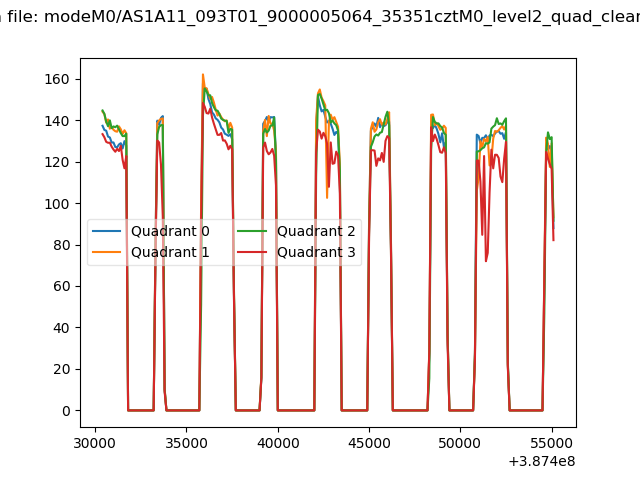 |
|
| Module-wise count rates for Quadrant A Data is divided into 100 sec bins |
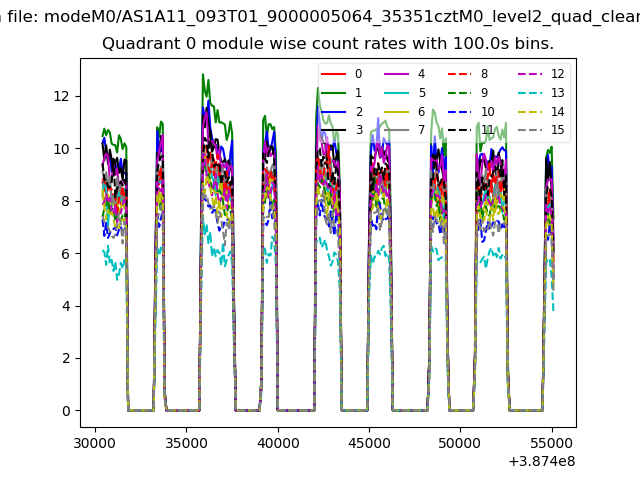 |
 |
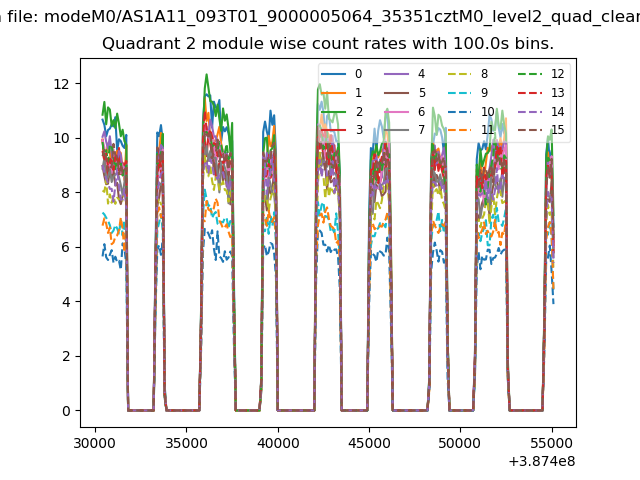
| Module-wise count rates for Quadrant B Data is divided into 100 sec bins |
 |
 |
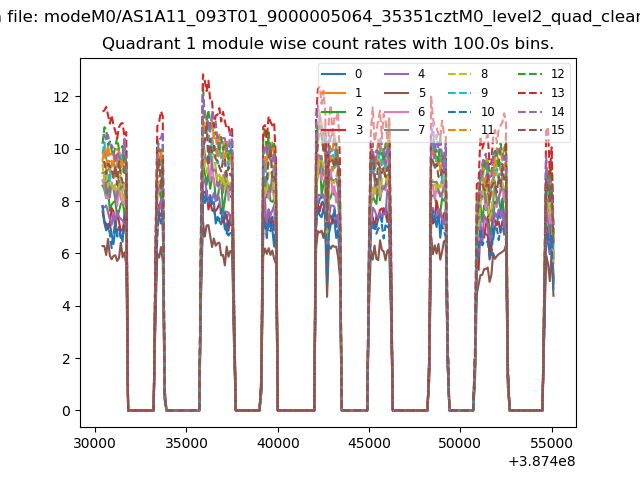
| Module-wise count rates for Quadrant C Data is divided into 100 sec bins |
 |
 |
| Module-wise count rates for Quadrant D Data is divided into 100 sec bins |
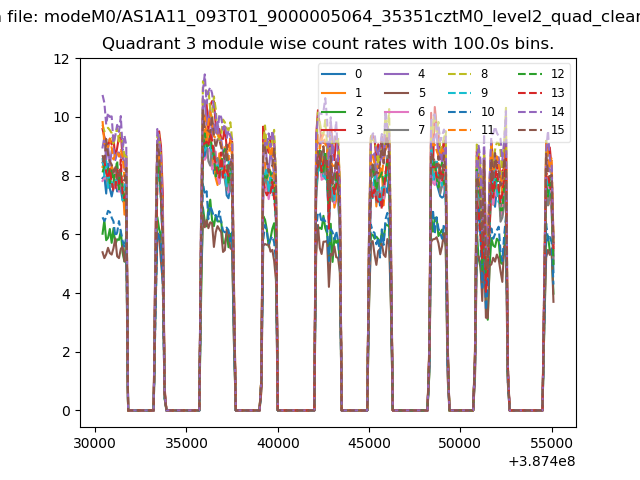 |
 |
| Parameter | Plot |
|---|---|
| CZT HV Monitor | 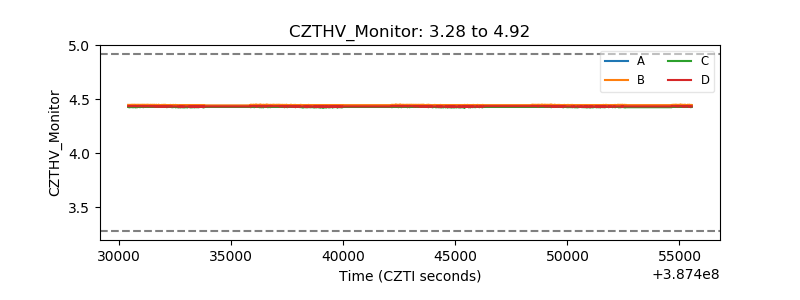 |
| D_VDD | 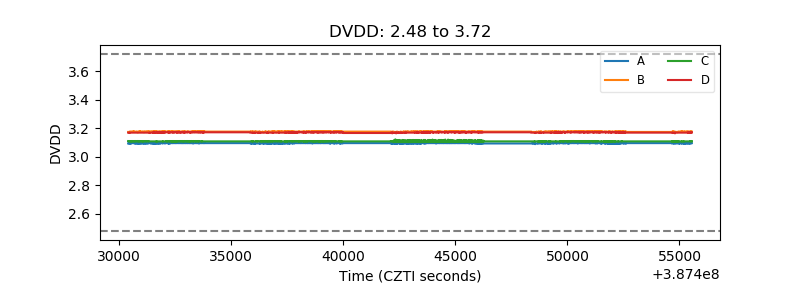 |
| Temperature 1 | 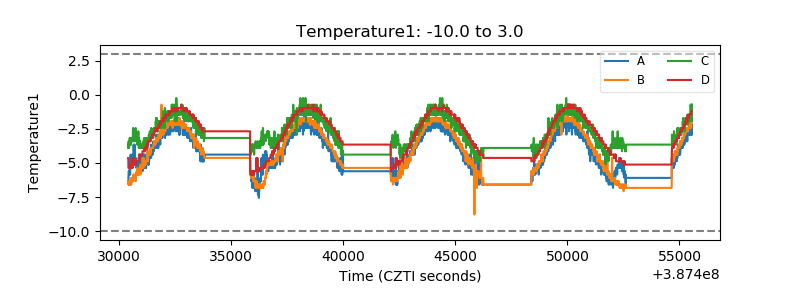 |
| Veto HV Monitor | 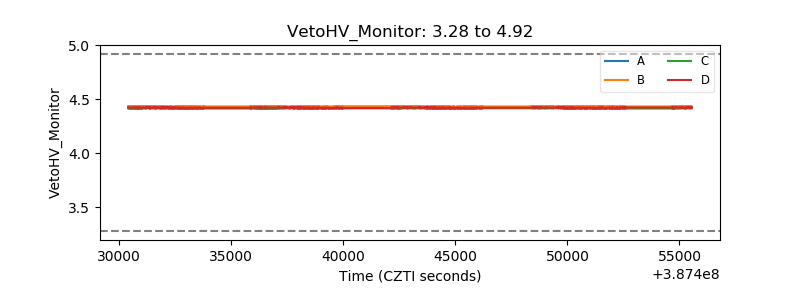 |
| Veto LLD | 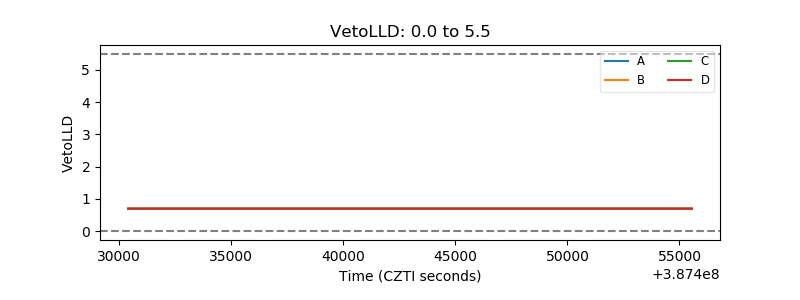 |
| Alpha Counter | 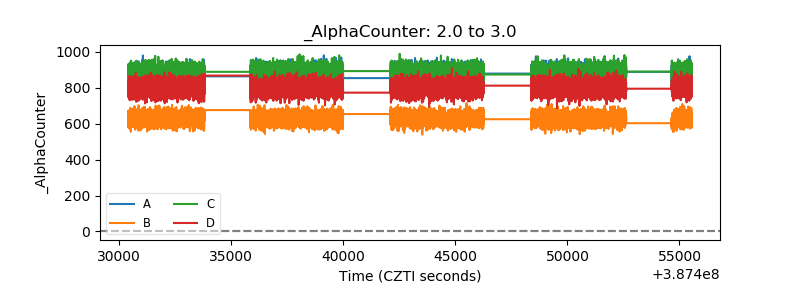 |
| _CPM_Rate | 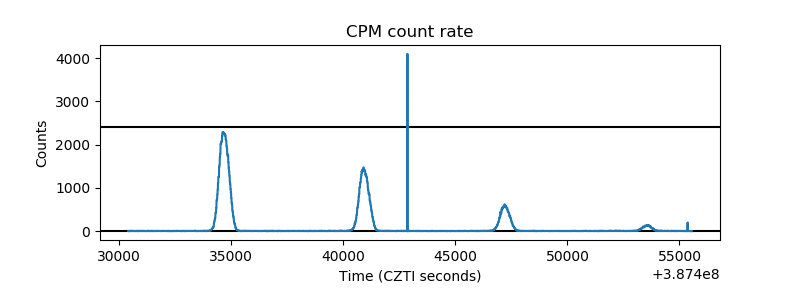 |
| CZT Counter | 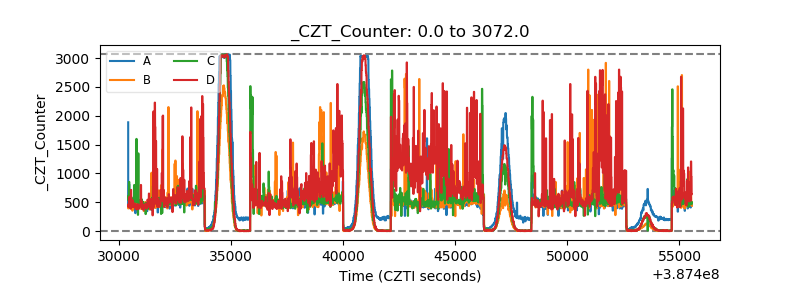 |
| +2.5 Volts monitor | 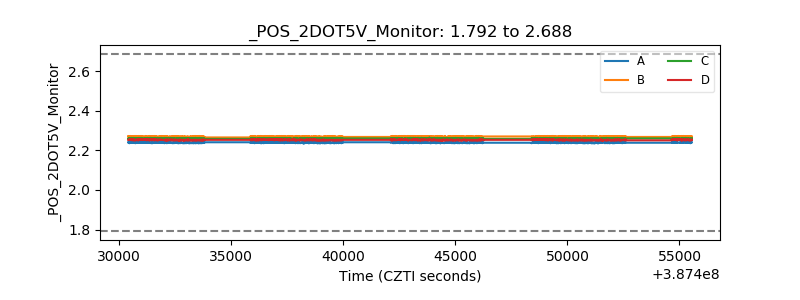 |
| +5 Volts monitor | 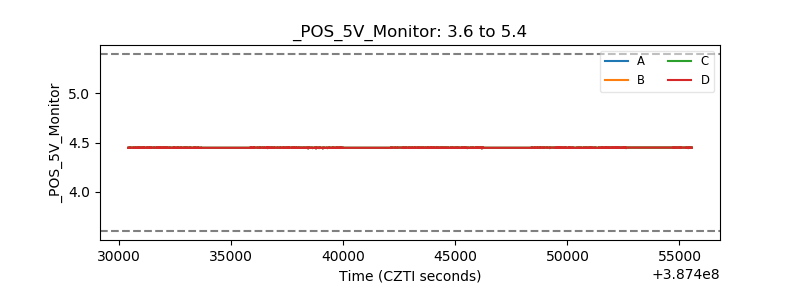 |
| _ROLL_ROT | 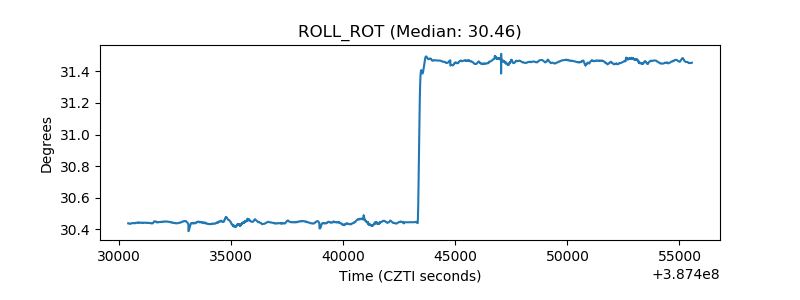 |
| _Roll_DEC | 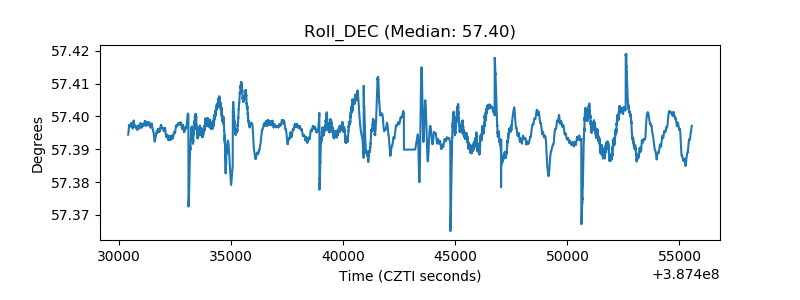 |
| _Roll_RA | 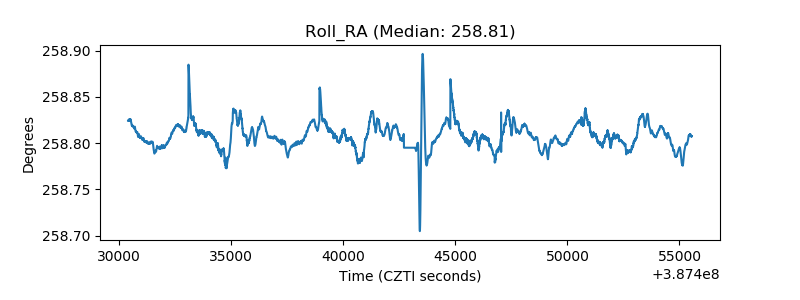 |
| Veto Counter | 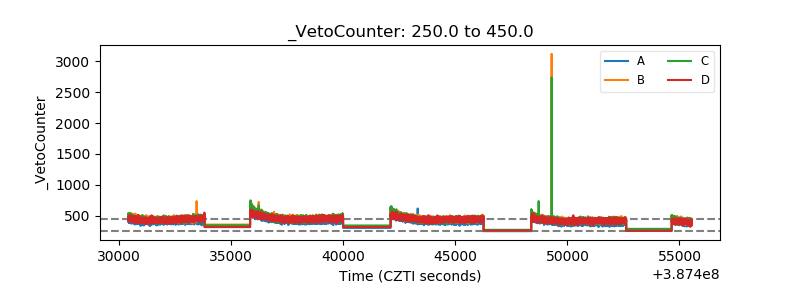 |