| Param | Original file | Final file |
|---|---|---|
| Filename | modeM0/AS1A11_093T01_9000005064_35346cztM0_level2.evt | modeM0/AS1A11_093T01_9000005064_35346cztM0_level2_quad_clean.evt |
| Size (bytes) | 417,769,920 | 84,985,920 |
| Size | 398.4 MB | 81.0 MB |
| Events in quadrant A | 2,707,669 | 538,220 |
| Events in quadrant B | 3,022,707 | 561,771 |
| Events in quadrant C | 3,115,721 | 560,203 |
| Events in quadrant D | 3,423,467 | 519,969 |
| Mode M0 | |||
|---|---|---|---|
| Quadrant | BADHDUFLAG | Total packets | Discarded packets |
| A | 0 | 11862 | 3 |
| B | 0 | 12716 | 2 |
| C | 0 | 12704 | 2 |
| D | 0 | 14104 | 2 |
| Mode SS | |||
|---|---|---|---|
| Quadrant | BADHDUFLAG | Total packets | Discarded packets |
| A | 0 | 114 | 0 |
| B | 0 | 114 | 0 |
| C | 0 | 114 | 0 |
| D | 0 | 114 | 0 |
| Mode M9 | |||
|---|---|---|---|
| Quadrant | BADHDUFLAG | Total packets | Discarded packets |
| A | 0 | 31 | 0 |
| B | 0 | 31 | 0 |
| C | 0 | 31 | 0 |
| D | 0 | 32 | 0 |
| Quadrant | Total seconds | Saturated seconds | Saturation percentage |
|---|---|---|---|
| A | 5629 | 29 | 0.515189% |
| B | 5629 | 104 | 1.847575% |
| C | 5629 | 102 | 1.812045% |
| D | 5629 | 144 | 2.558181% |
Noise dominated data is calculated using 1-second bins in cleaned event files. If a bin has >2000 counts, and if more than 50% of those come from <1% of pixels, then it is considered to be noise-dominated and hence unusable.
| Quadrant | # 1 sec bins | Bins with >0 counts | Bins with >2000 counts | High rate bins dominated by noise | Noise dominated (total time) | Noise dominated (detector-on time) | Marked lightcurve |
|---|---|---|---|---|---|---|---|
| A | 7423 | 5630 | 23 | 23 | 0.31% | 0.41% | 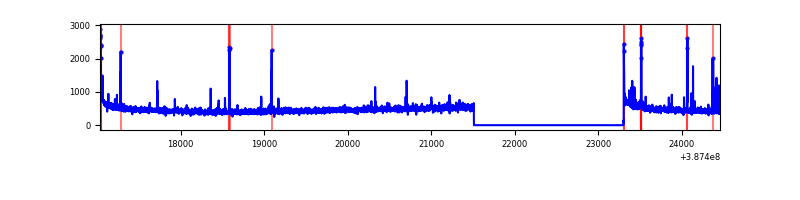 |
| B | 7423 | 5630 | 73 | 73 | 0.98% | 1.30% | 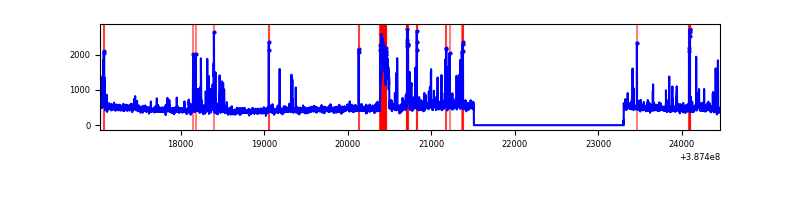 |
| C | 7423 | 5630 | 76 | 76 | 1.02% | 1.35% | 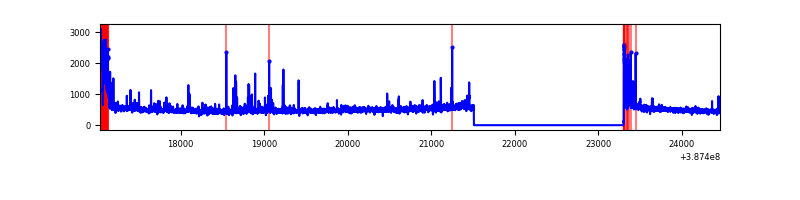 |
| D | 7423 | 5630 | 103 | 103 | 1.39% | 1.83% | 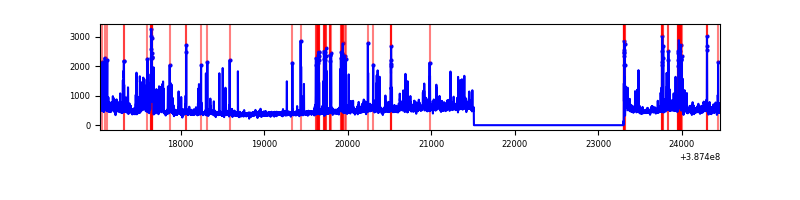 |
Top three noisy pixels from each quadrant. If the there are fewer than three noisy pixels in the level2.evt file, extra rows are filled as -1
| Pixel properties | Quadrant properties | ||||||
|---|---|---|---|---|---|---|---|
| Quadrant | DetID | PixID | Counts | Sigma | Mean | Median | Sigma |
| A | 10 | 83 | 109563 | 857.86 | 636 | 625 | 127.0 |
| A | 9 | 143 | 75408 | 588.9 | 636 | 625 | 127.0 |
| A | 8 | 192 | 23464 | 179.85 | 636 | 625 | 127.0 |
| B | 5 | 236 | 234135 | 1937.95 | 638 | 621 | 120.5 |
| B | 5 | 172 | 217776 | 1802.19 | 638 | 621 | 120.5 |
| B | 15 | 85 | 21512 | 173.38 | 638 | 621 | 120.5 |
| C | 0 | 10 | 375605 | 2618.57 | 622 | 628 | 143.2 |
| C | 15 | 214 | 231370 | 1611.34 | 622 | 628 | 143.2 |
| C | 14 | 67 | 20299 | 137.37 | 622 | 628 | 143.2 |
| D | 8 | 195 | 240261 | 1618.42 | 610 | 592 | 148.1 |
| D | 1 | 52 | 204362 | 1376.0 | 610 | 592 | 148.1 |
| D | 7 | 80 | 188875 | 1271.42 | 610 | 592 | 148.1 |
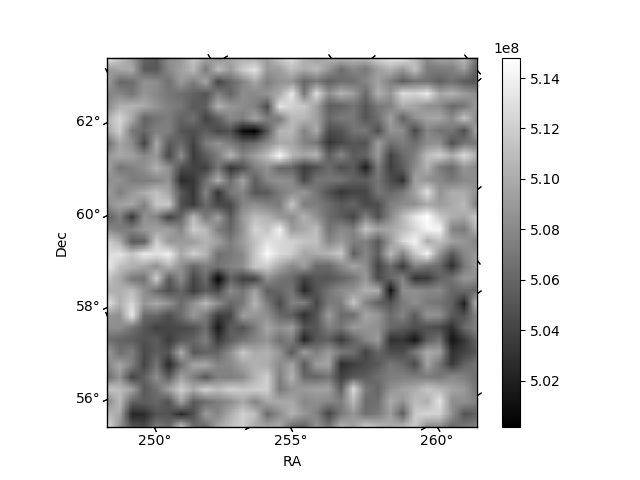
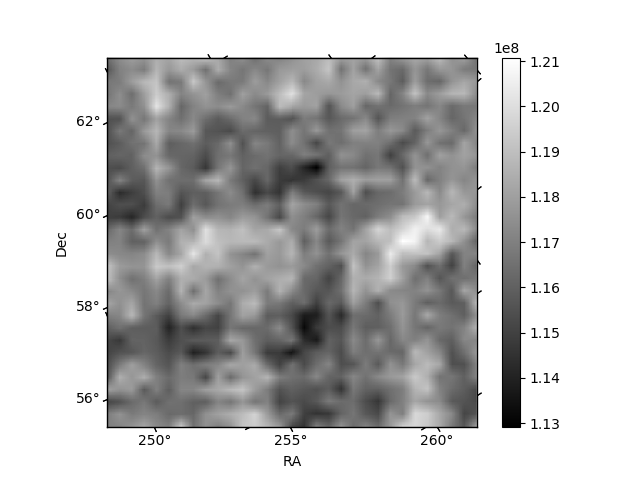
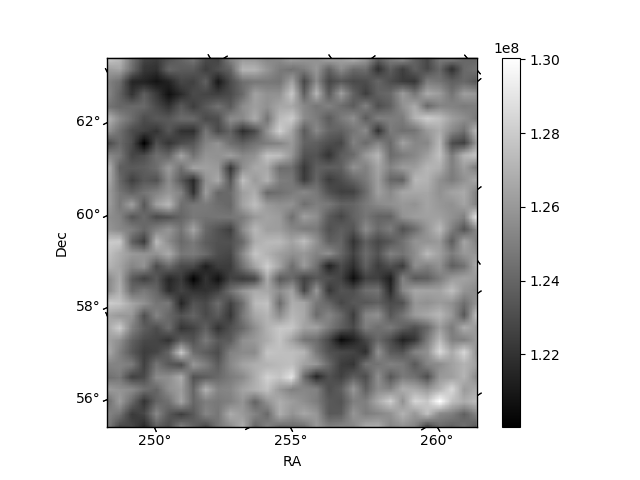
Histogram calculated using DETX and DETY for each event in the final _common_clean file
| Quadrant A | 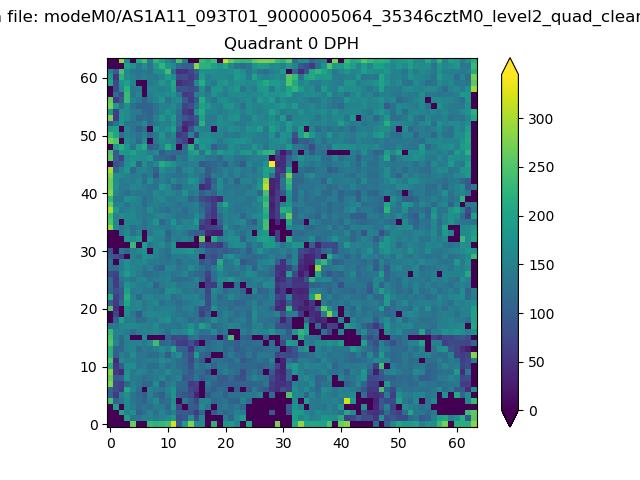 |
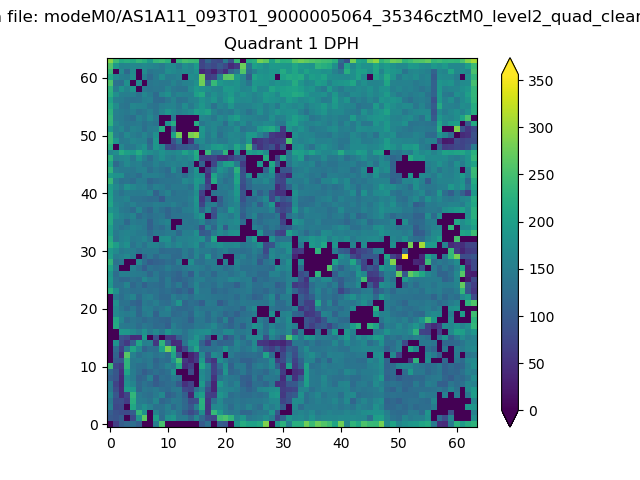 |
Quadrant B |
|---|---|---|---|
| Quadrant D | 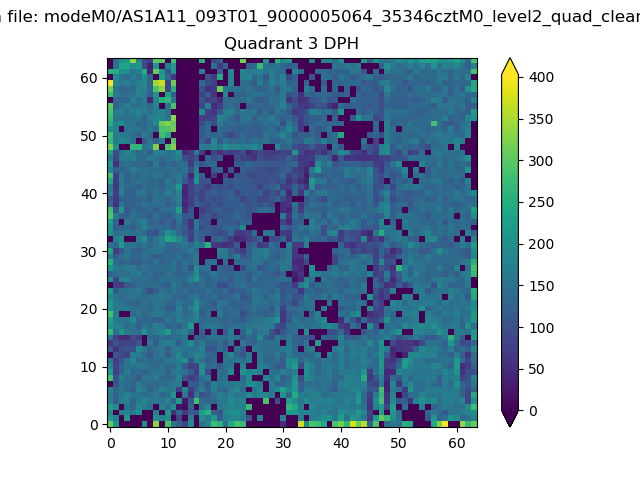 |
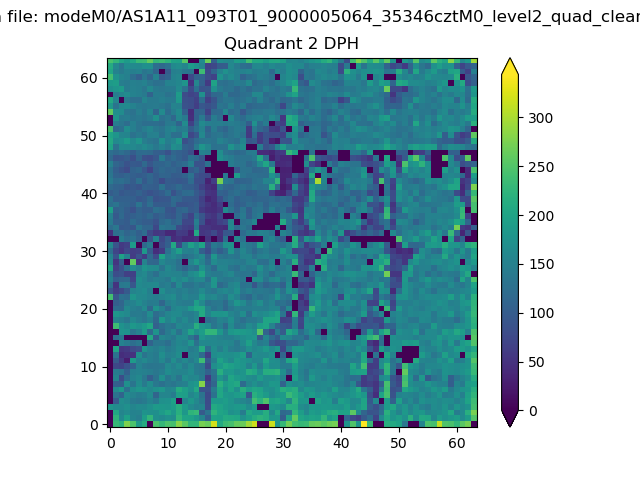 |
Quadrant C |
| Plot type | Count rate plots | Images |
|---|---|---|
| Comparison with Poisson distribution Blue bars denote a histogram of data divided into 1 sec bins. Red curve is a Poisson curve with rate = median count rate of data. |
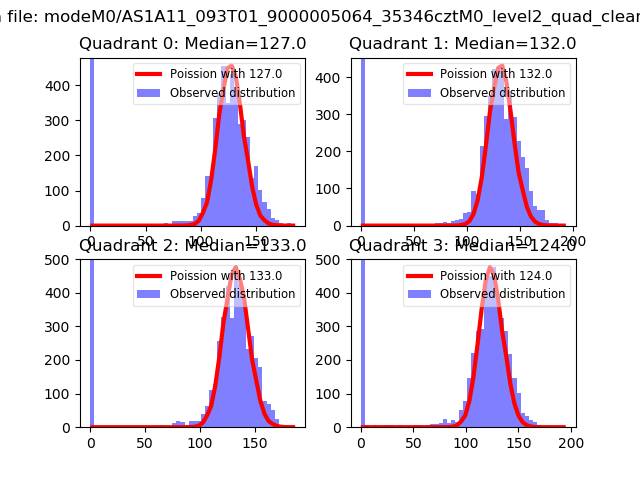 |
 |
| Quadrant-wise count rates Data is divided into 100 sec bins |
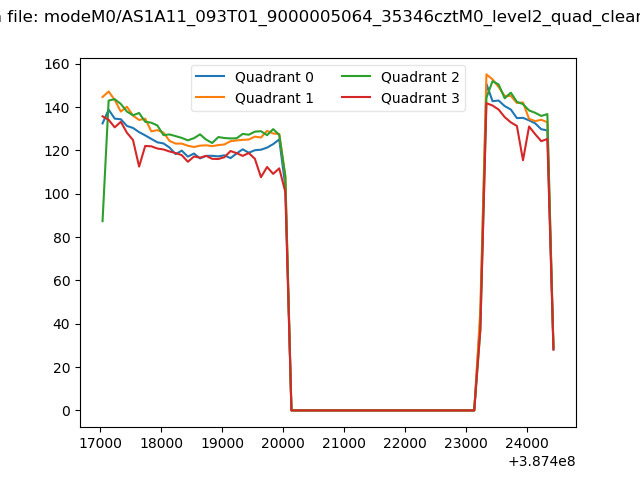 |
|
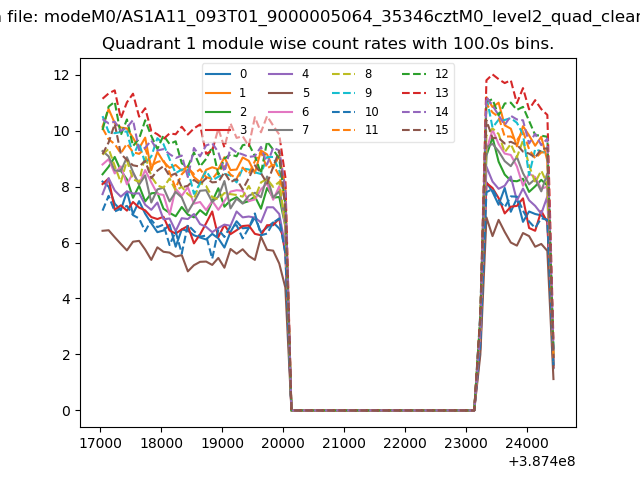
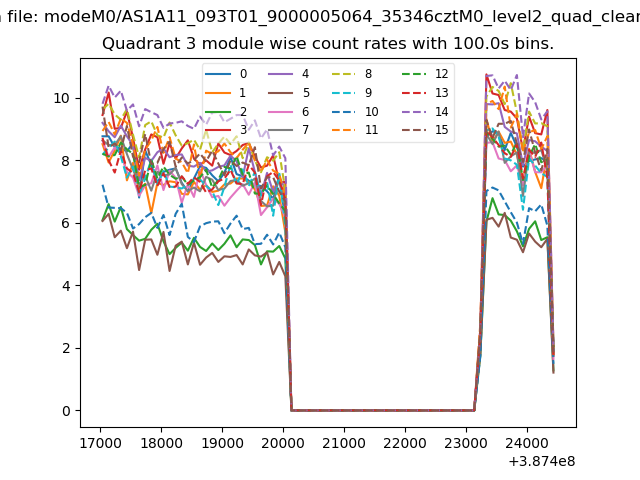
| Module-wise count rates for Quadrant A Data is divided into 100 sec bins |
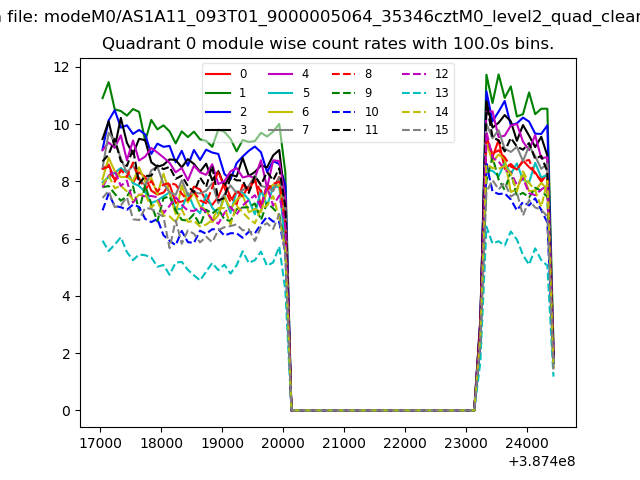 |
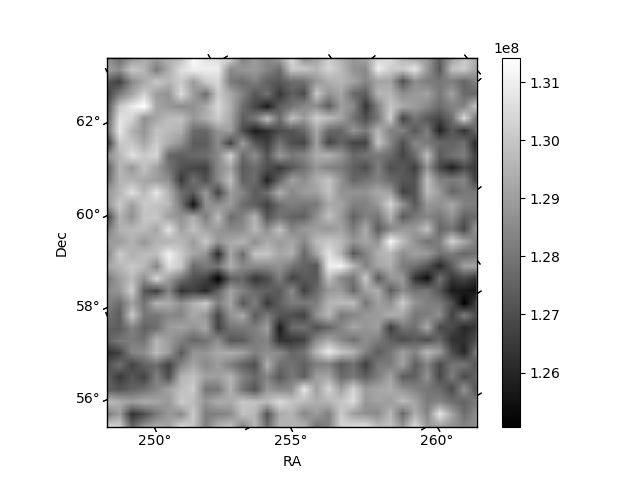 |
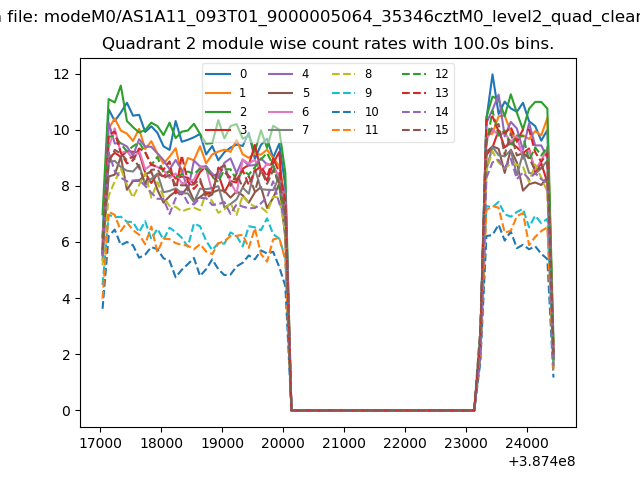
| Module-wise count rates for Quadrant B Data is divided into 100 sec bins |
 |
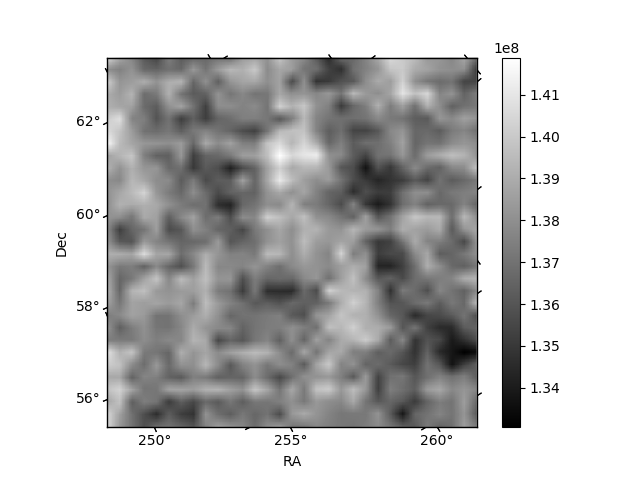 |
| Module-wise count rates for Quadrant C Data is divided into 100 sec bins |
 |
 |
| Module-wise count rates for Quadrant D Data is divided into 100 sec bins |
 |
 |
| Parameter | Plot |
|---|---|
| CZT HV Monitor | 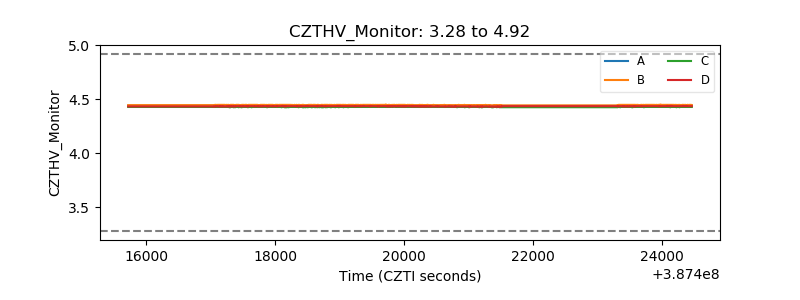 |
| D_VDD | 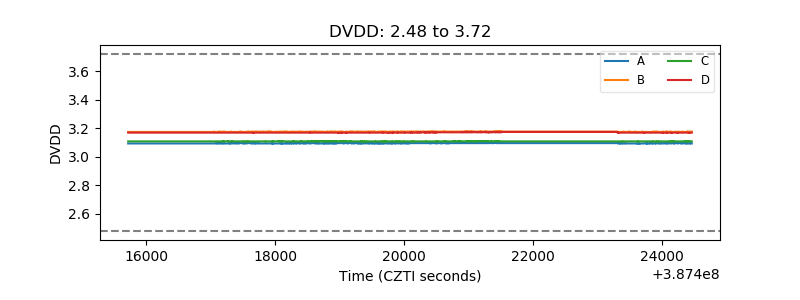 |
| Temperature 1 | 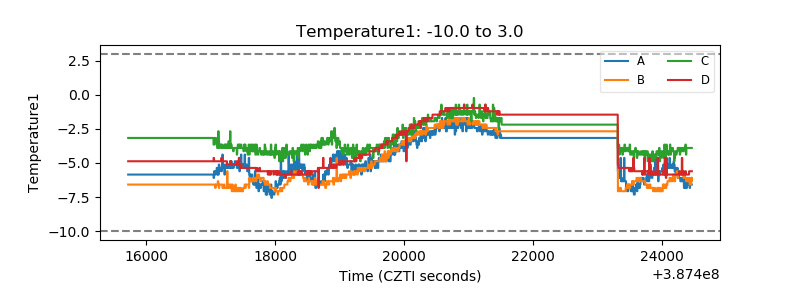 |
| Veto HV Monitor | 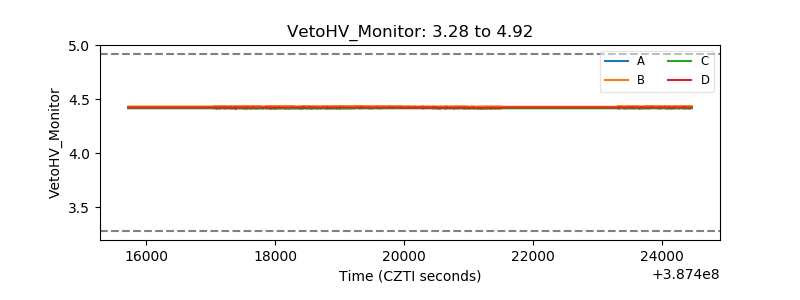 |
| Veto LLD | 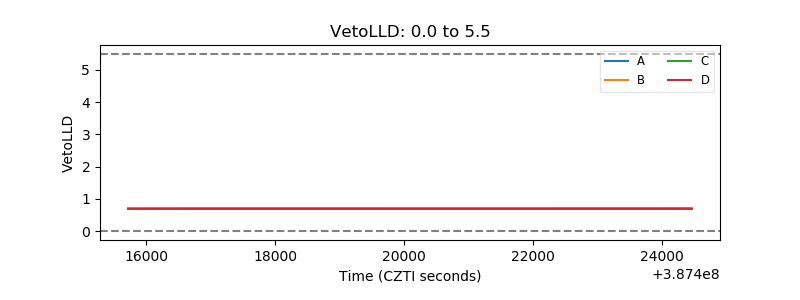 |
| Alpha Counter | 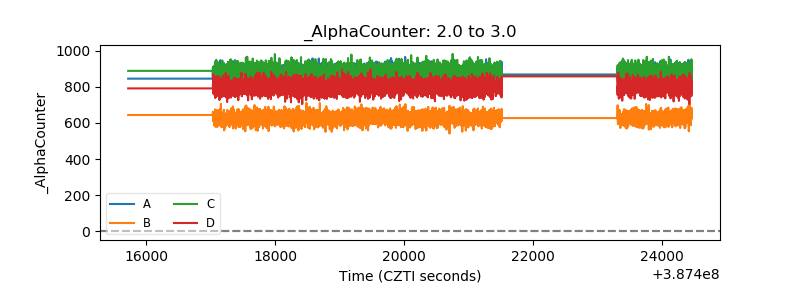 |
| _CPM_Rate | 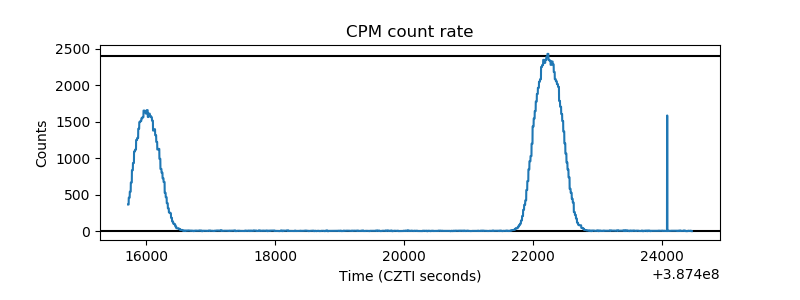 |
| CZT Counter | 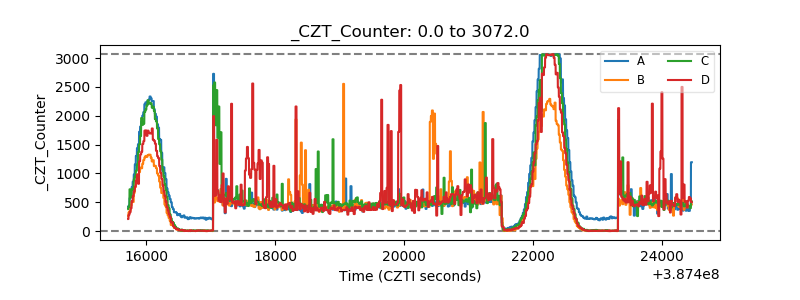 |
| +2.5 Volts monitor | 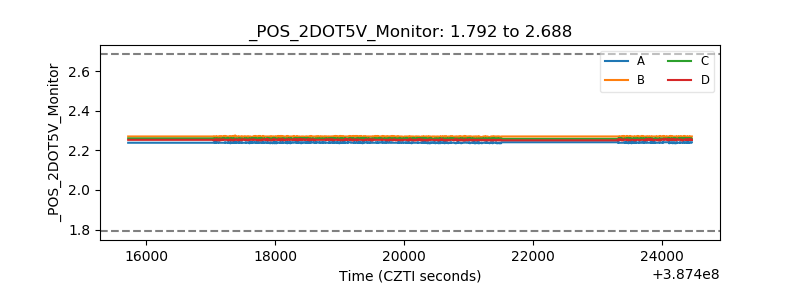 |
| +5 Volts monitor | 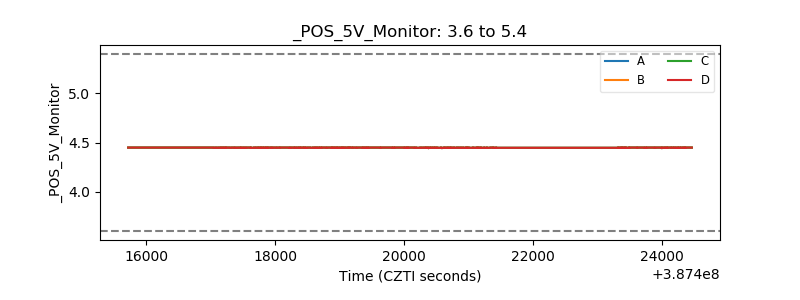 |
| _ROLL_ROT | 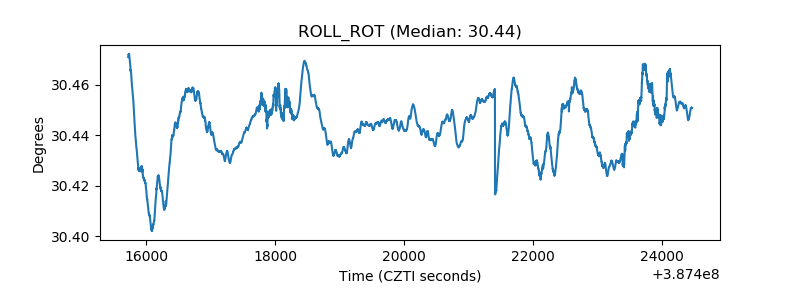 |
| _Roll_DEC | 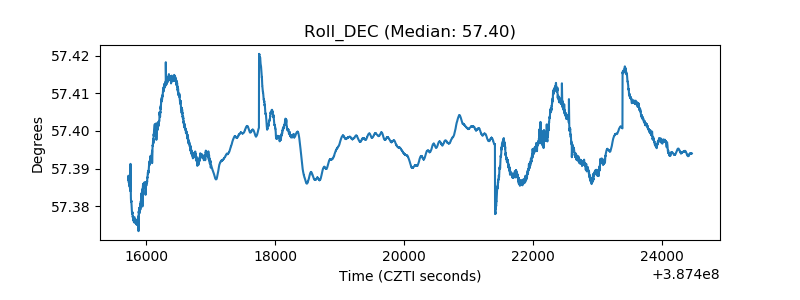 |
| _Roll_RA | 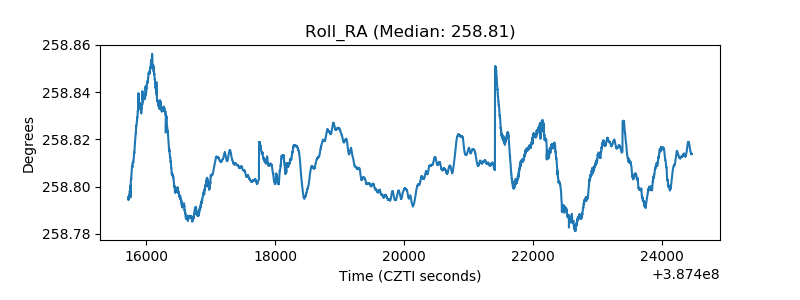 |
| Veto Counter |  |