| Param | Original file | Final file |
|---|---|---|
| Filename | modeM0/AS1A11_093T01_9000005064_35340cztM0_level2.evt | modeM0/AS1A11_093T01_9000005064_35340cztM0_level2_quad_clean.evt |
| Size (bytes) | 657,794,880 | 84,286,080 |
| Size | 627.3 MB | 80.4 MB |
| Events in quadrant A | 2,858,206 | 561,654 |
| Events in quadrant B | 9,105,415 | 466,902 |
| Events in quadrant C | 3,313,126 | 572,590 |
| Events in quadrant D | 4,241,466 | 534,425 |
| Mode M0 | |||
|---|---|---|---|
| Quadrant | BADHDUFLAG | Total packets | Discarded packets |
| A | 0 | 12432 | 3 |
| B | 0 | 31205 | 2 |
| C | 0 | 13395 | 2 |
| D | 0 | 16505 | 2 |
| Mode SS | |||
|---|---|---|---|
| Quadrant | BADHDUFLAG | Total packets | Discarded packets |
| A | 0 | 122 | 0 |
| B | 0 | 122 | 0 |
| C | 0 | 122 | 0 |
| D | 0 | 122 | 0 |
| Mode M9 | |||
|---|---|---|---|
| Quadrant | BADHDUFLAG | Total packets | Discarded packets |
| A | 0 | 16 | 0 |
| B | 0 | 16 | 0 |
| C | 0 | 16 | 0 |
| D | 0 | 17 | 0 |
| Quadrant | Total seconds | Saturated seconds | Saturation percentage |
|---|---|---|---|
| A | 5952 | 29 | 0.487231% |
| B | 5952 | 2564 | 43.077957% |
| C | 5952 | 78 | 1.310484% |
| D | 5952 | 301 | 5.057124% |
Noise dominated data is calculated using 1-second bins in cleaned event files. If a bin has >2000 counts, and if more than 50% of those come from <1% of pixels, then it is considered to be noise-dominated and hence unusable.
| Quadrant | # 1 sec bins | Bins with >0 counts | Bins with >2000 counts | High rate bins dominated by noise | Noise dominated (total time) | Noise dominated (detector-on time) | Marked lightcurve |
|---|---|---|---|---|---|---|---|
| A | 7236 | 5953 | 26 | 26 | 0.36% | 0.44% | 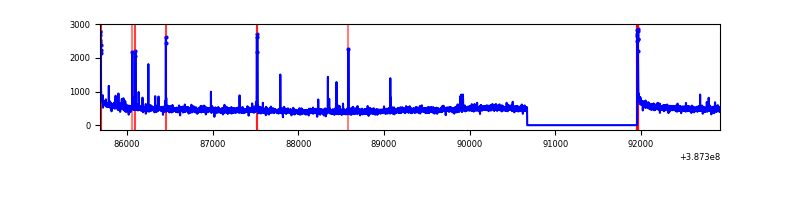 |
| B | 7235 | 5951 | 2023 | 2023 | 27.96% | 33.99% | 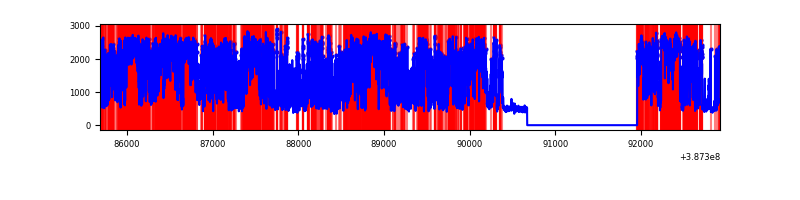 |
| C | 7235 | 5951 | 63 | 63 | 0.87% | 1.06% | 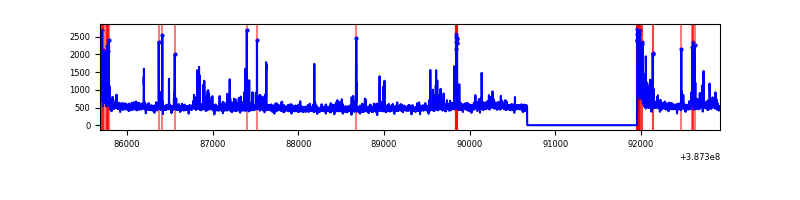 |
| D | 7235 | 5951 | 278 | 278 | 3.84% | 4.67% | 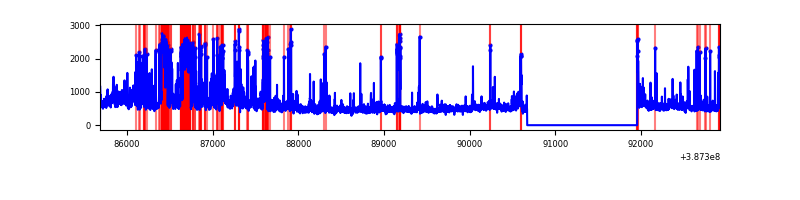 |
Top three noisy pixels from each quadrant. If the there are fewer than three noisy pixels in the level2.evt file, extra rows are filled as -1
| Pixel properties | Quadrant properties | ||||||
|---|---|---|---|---|---|---|---|
| Quadrant | DetID | PixID | Counts | Sigma | Mean | Median | Sigma |
| A | 10 | 83 | 113657 | 825.46 | 680 | 668 | 136.9 |
| A | 8 | 192 | 44082 | 317.17 | 680 | 668 | 136.9 |
| A | 9 | 143 | 32174 | 230.17 | 680 | 668 | 136.9 |
| B | 5 | 236 | 3824441 | 35409.96 | 554 | 537 | 108.0 |
| B | 5 | 172 | 3009660 | 27864.95 | 554 | 537 | 108.0 |
| B | 15 | 85 | 26076 | 236.49 | 554 | 537 | 108.0 |
| C | 15 | 214 | 248917 | 1601.14 | 665 | 670 | 155.0 |
| C | 0 | 10 | 211745 | 1361.39 | 665 | 670 | 155.0 |
| C | 4 | 254 | 155052 | 995.73 | 665 | 670 | 155.0 |
| D | 10 | 118 | 607608 | 3769.01 | 653 | 635 | 161.0 |
| D | 8 | 195 | 531845 | 3298.56 | 653 | 635 | 161.0 |
| D | 7 | 80 | 224815 | 1392.05 | 653 | 635 | 161.0 |
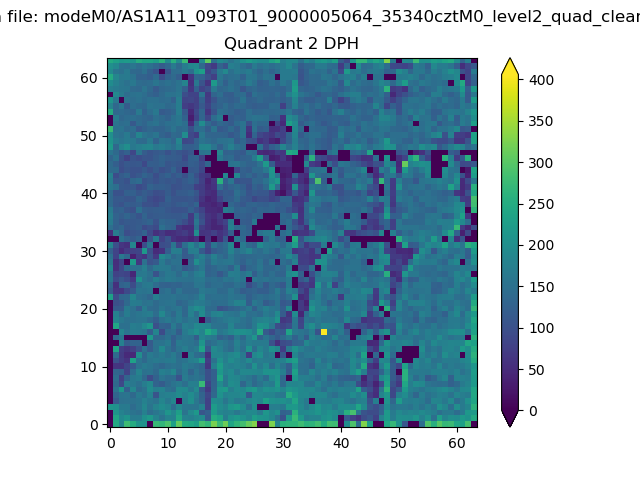
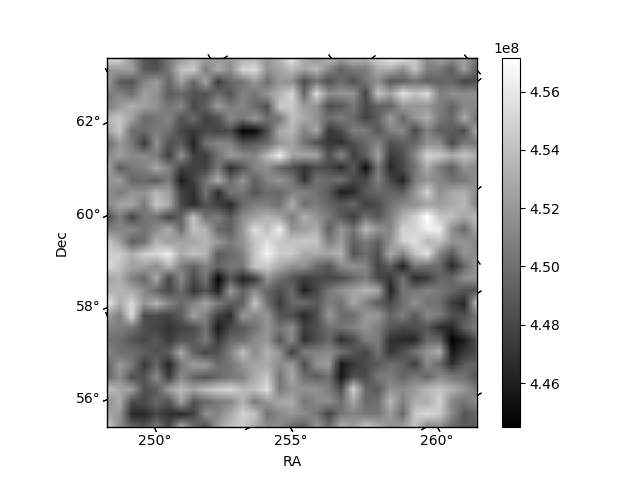
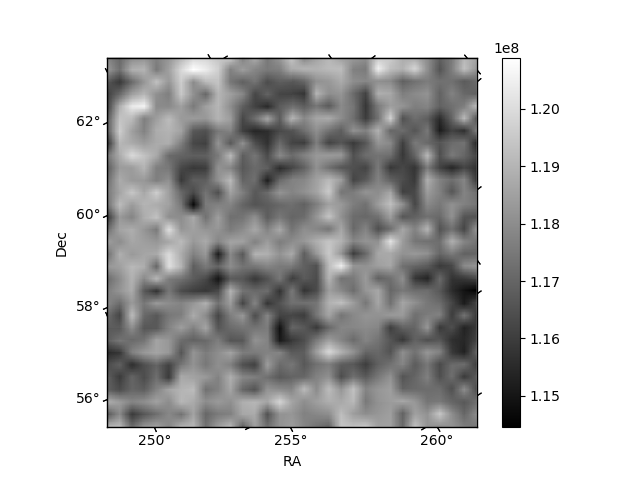
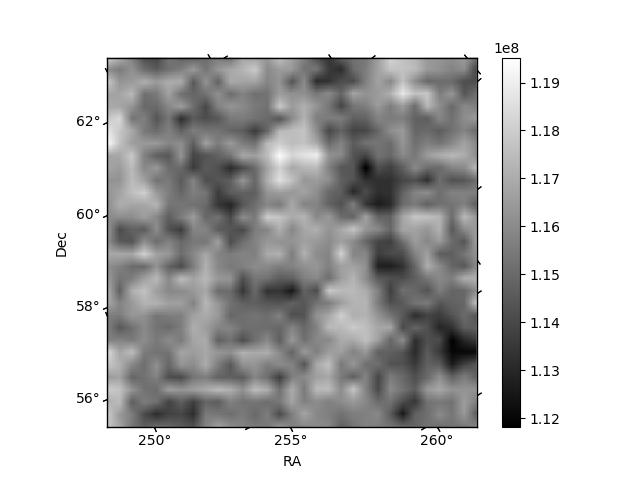
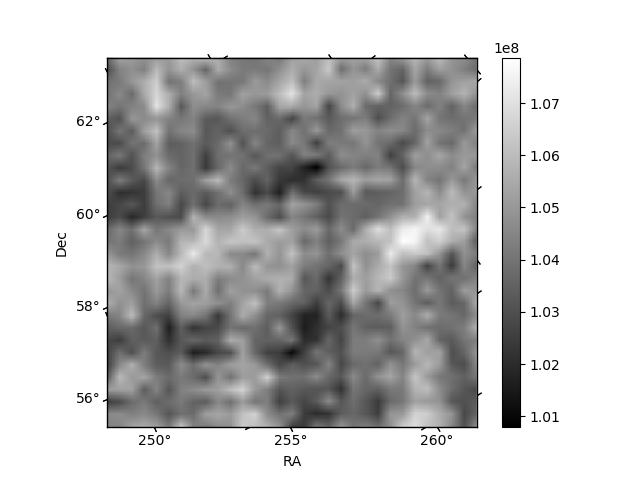
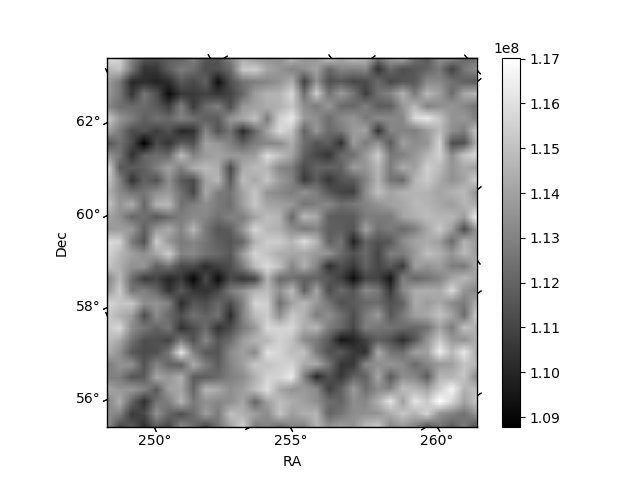
Histogram calculated using DETX and DETY for each event in the final _common_clean file
| Quadrant A | 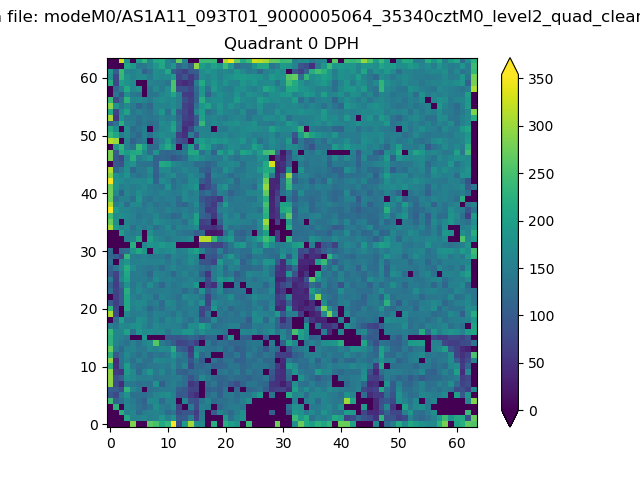 |
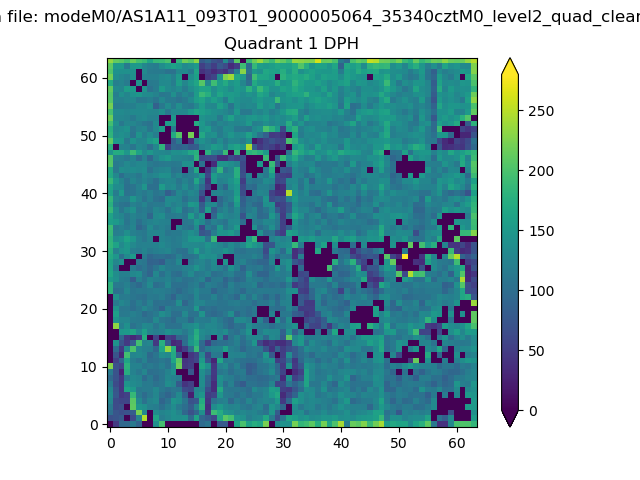 |
Quadrant B |
|---|---|---|---|
| Quadrant D | 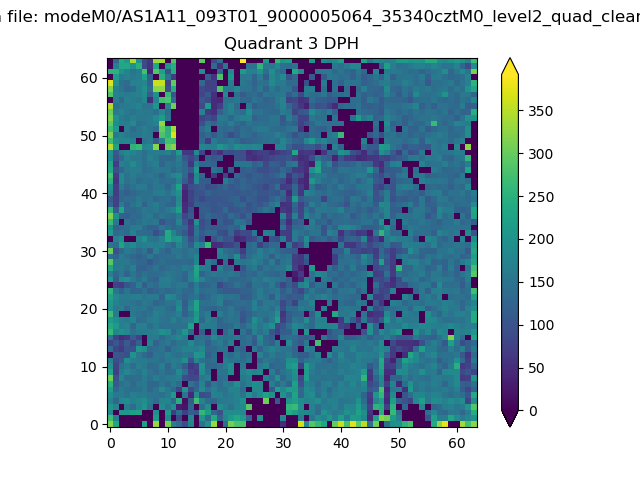 |
 |
Quadrant C |
| Plot type | Count rate plots | Images |
|---|---|---|
| Comparison with Poisson distribution Blue bars denote a histogram of data divided into 1 sec bins. Red curve is a Poisson curve with rate = median count rate of data. |
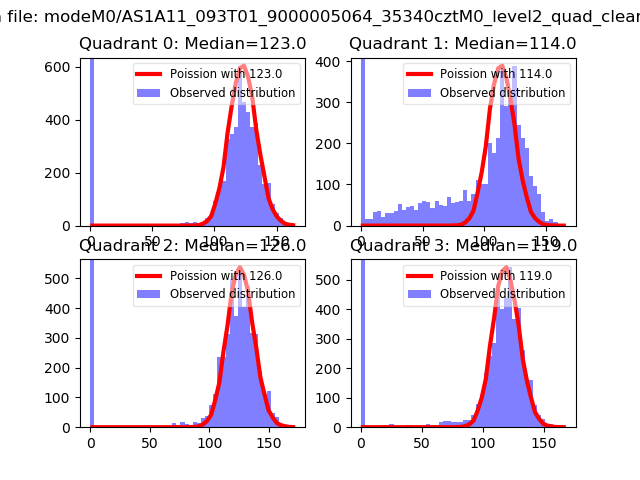 |
 |
| Quadrant-wise count rates Data is divided into 100 sec bins |
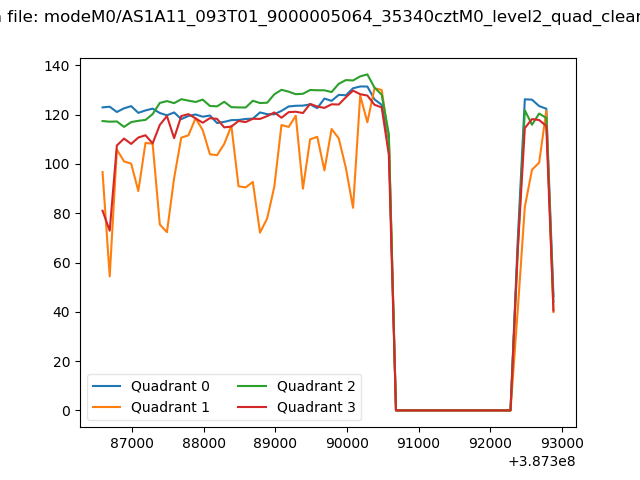 |
|
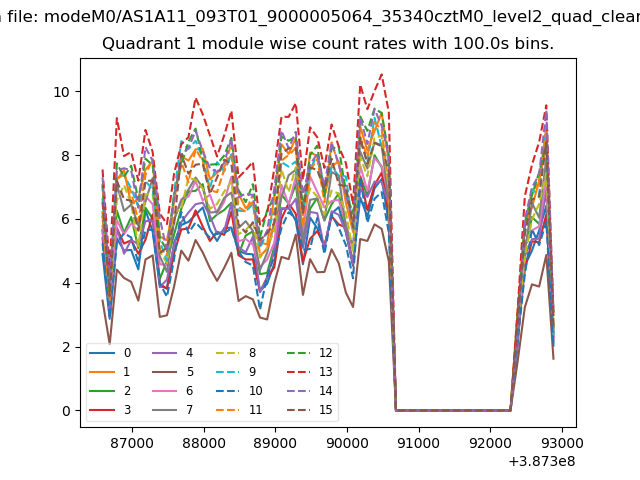
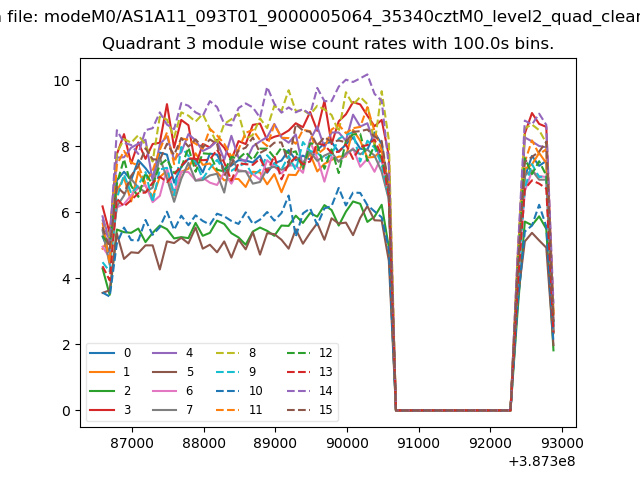
| Module-wise count rates for Quadrant A Data is divided into 100 sec bins |
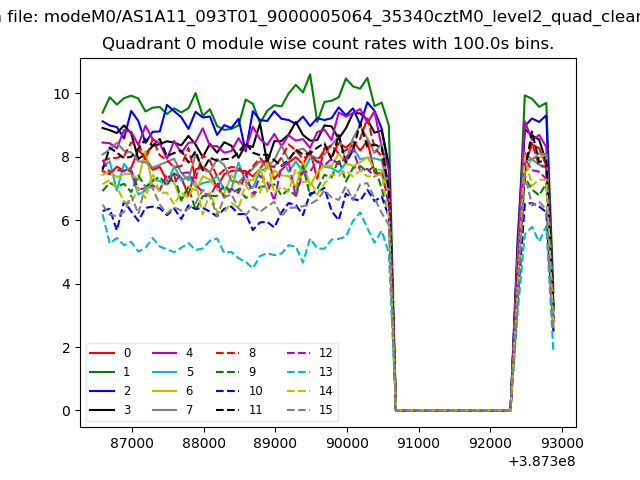 |
 |
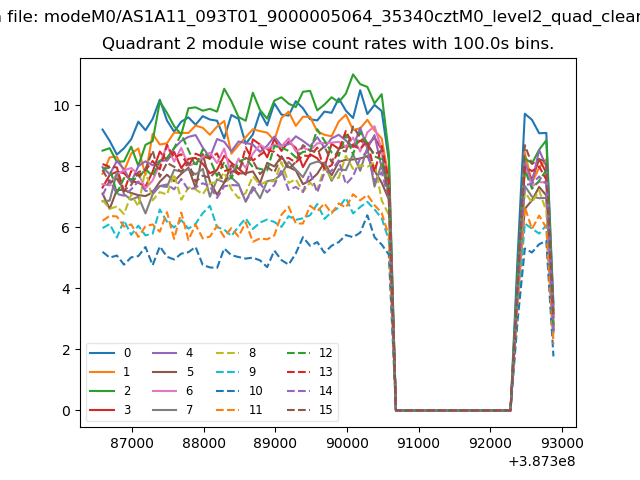
| Module-wise count rates for Quadrant B Data is divided into 100 sec bins |
 |
 |
| Module-wise count rates for Quadrant C Data is divided into 100 sec bins |
 |
 |
| Module-wise count rates for Quadrant D Data is divided into 100 sec bins |
 |
 |
| Parameter | Plot |
|---|---|
| CZT HV Monitor | 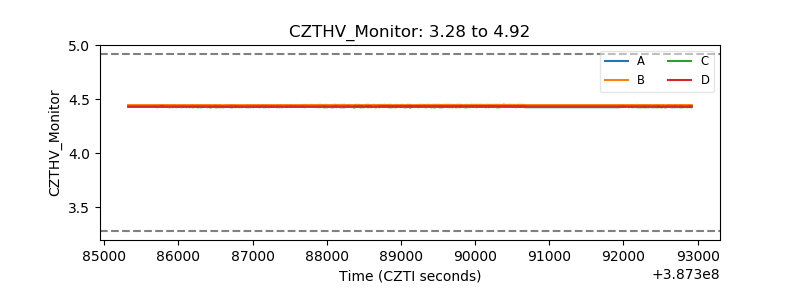 |
| D_VDD | 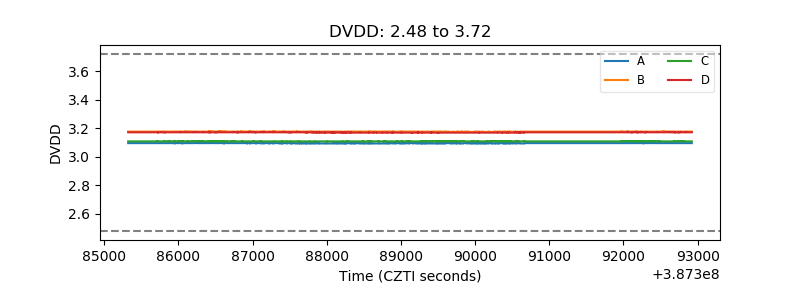 |
| Temperature 1 | 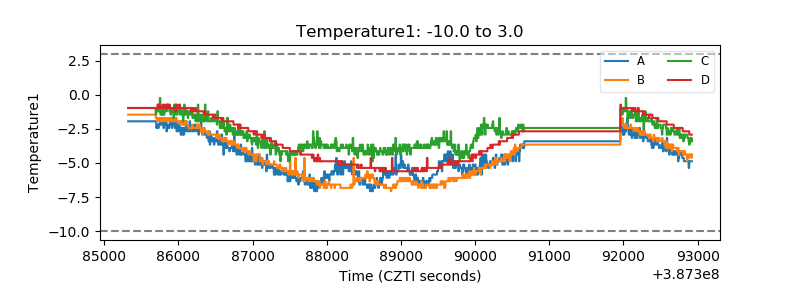 |
| Veto HV Monitor | 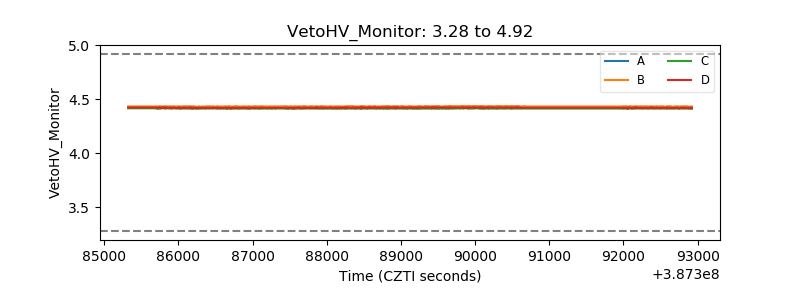 |
| Veto LLD | 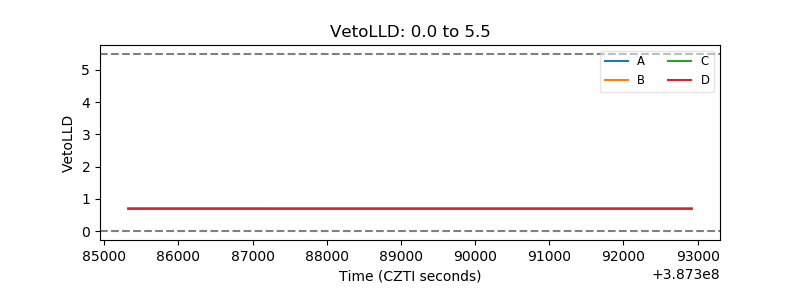 |
| Alpha Counter | 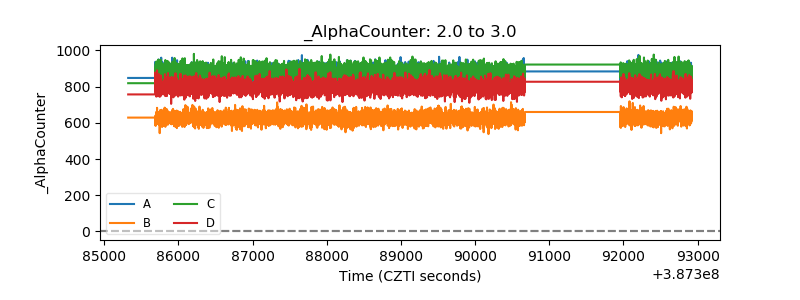 |
| _CPM_Rate | 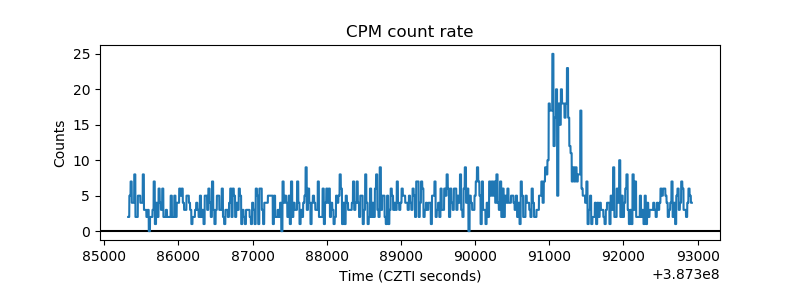 |
| CZT Counter | 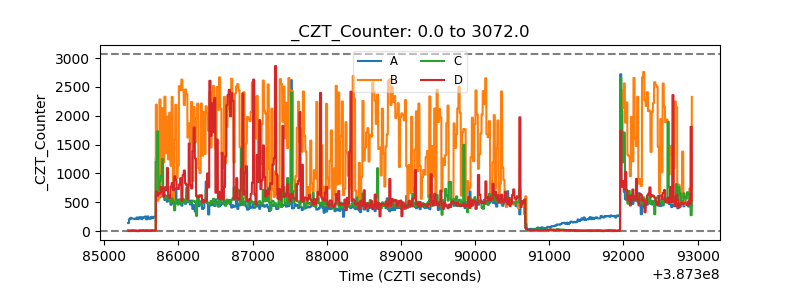 |
| +2.5 Volts monitor | 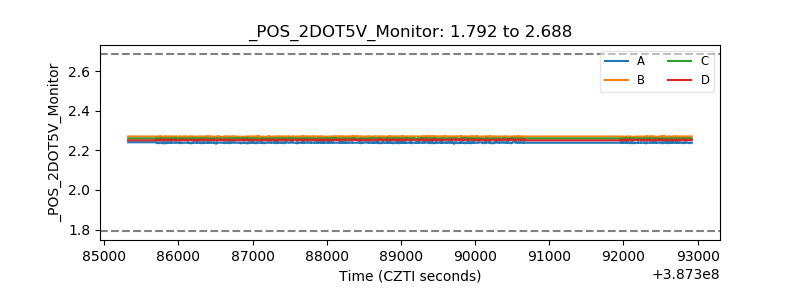 |
| +5 Volts monitor | 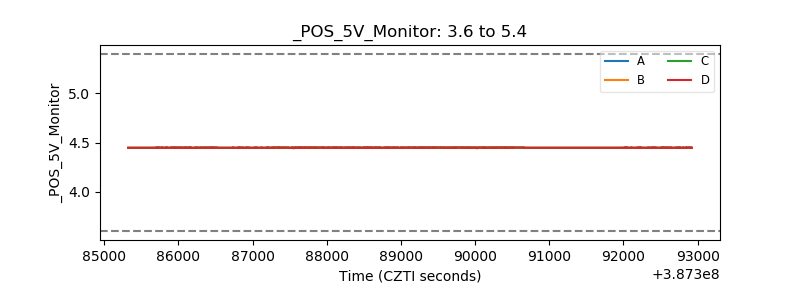 |
| _ROLL_ROT | 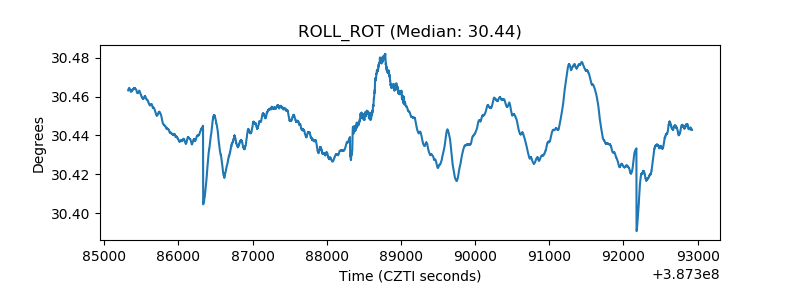 |
| _Roll_DEC | 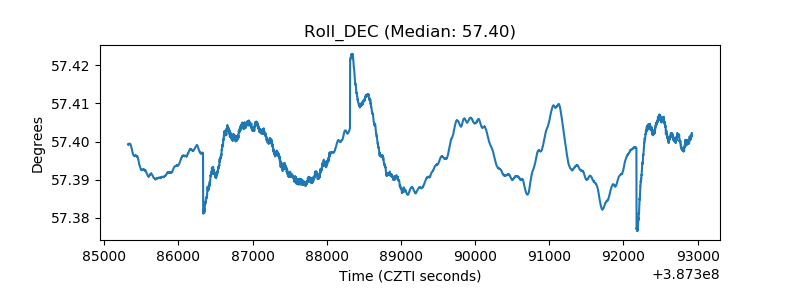 |
| _Roll_RA | 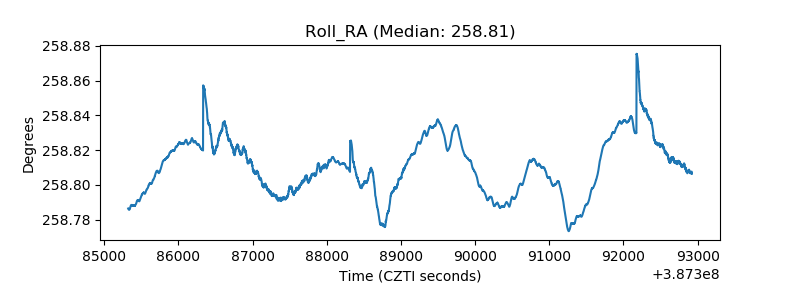 |
| Veto Counter | 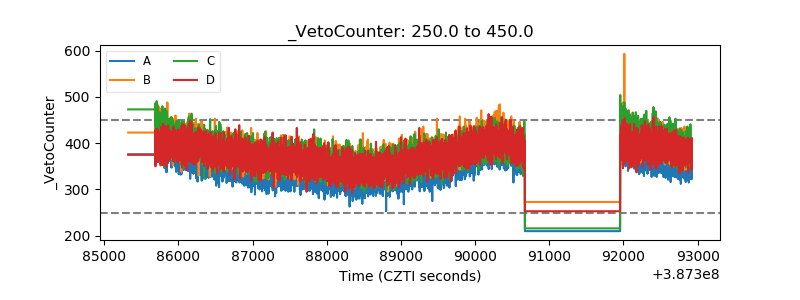 |