| Param | Original file | Final file |
|---|---|---|
| Filename | modeM0/AS1A11_093T01_9000005064_35337cztM0_level2.evt | modeM0/AS1A11_093T01_9000005064_35337cztM0_level2_quad_clean.evt |
| Size (bytes) | 540,581,760 | 61,865,280 |
| Size | 515.5 MB | 59.0 MB |
| Events in quadrant A | 2,583,935 | 388,976 |
| Events in quadrant B | 6,662,018 | 348,035 |
| Events in quadrant C | 2,993,043 | 388,614 |
| Events in quadrant D | 3,769,471 | 372,071 |
| Mode M0 | |||
|---|---|---|---|
| Quadrant | BADHDUFLAG | Total packets | Discarded packets |
| A | 0 | 11054 | 3 |
| B | 0 | 23471 | 2 |
| C | 0 | 11944 | 2 |
| D | 0 | 14662 | 2 |
| Mode SS | |||
|---|---|---|---|
| Quadrant | BADHDUFLAG | Total packets | Discarded packets |
| A | 0 | 110 | 0 |
| B | 0 | 110 | 0 |
| C | 0 | 110 | 0 |
| D | 0 | 110 | 0 |
| Mode M9 | |||
|---|---|---|---|
| Quadrant | BADHDUFLAG | Total packets | Discarded packets |
| A | 0 | 20 | 0 |
| B | 0 | 20 | 0 |
| C | 0 | 20 | 0 |
| D | 0 | 21 | 0 |
| Quadrant | Total seconds | Saturated seconds | Saturation percentage |
|---|---|---|---|
| A | 5352 | 20 | 0.373692% |
| B | 5352 | 1413 | 26.401345% |
| C | 5352 | 94 | 1.756353% |
| D | 5352 | 189 | 3.531390% |
Noise dominated data is calculated using 1-second bins in cleaned event files. If a bin has >2000 counts, and if more than 50% of those come from <1% of pixels, then it is considered to be noise-dominated and hence unusable.
| Quadrant | # 1 sec bins | Bins with >0 counts | Bins with >2000 counts | High rate bins dominated by noise | Noise dominated (total time) | Noise dominated (detector-on time) | Marked lightcurve |
|---|---|---|---|---|---|---|---|
| A | 7294 | 5352 | 15 | 15 | 0.21% | 0.28% | 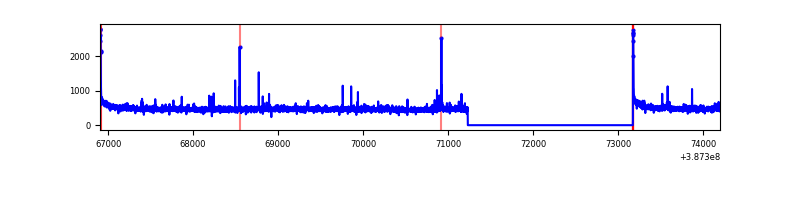 |
| B | 7295 | 5353 | 1135 | 1135 | 15.56% | 21.20% | 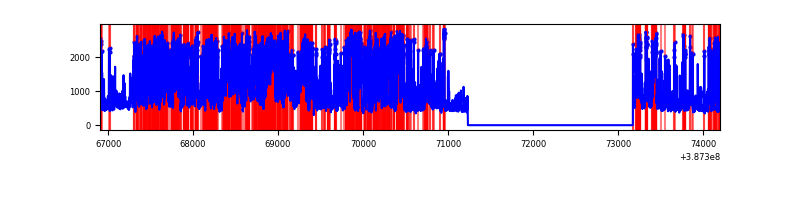 |
| C | 7295 | 5352 | 85 | 85 | 1.17% | 1.59% | 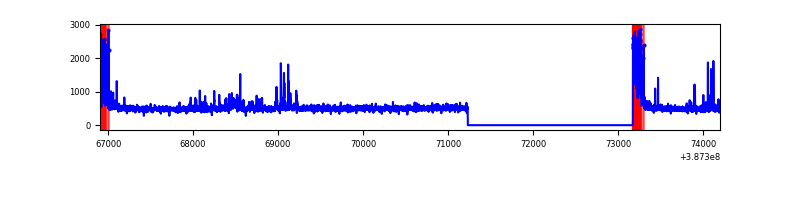 |
| D | 7294 | 5352 | 178 | 178 | 2.44% | 3.33% | 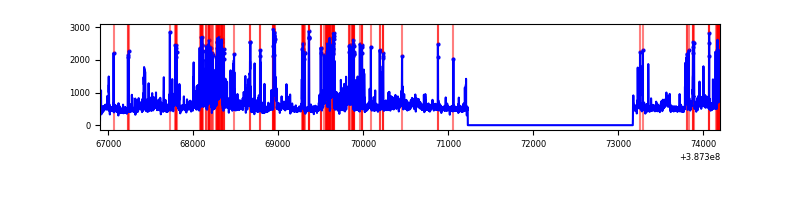 |
Top three noisy pixels from each quadrant. If the there are fewer than three noisy pixels in the level2.evt file, extra rows are filled as -1
| Pixel properties | Quadrant properties | ||||||
|---|---|---|---|---|---|---|---|
| Quadrant | DetID | PixID | Counts | Sigma | Mean | Median | Sigma |
| A | 10 | 83 | 98790 | 793.4 | 621 | 611 | 123.7 |
| A | 8 | 192 | 28208 | 223.02 | 621 | 611 | 123.7 |
| A | 7 | 3 | 14907 | 115.53 | 621 | 611 | 123.7 |
| B | 5 | 236 | 3294513 | 31614.47 | 553 | 540 | 104.2 |
| B | 5 | 172 | 1152444 | 11055.59 | 553 | 540 | 104.2 |
| B | 3 | 112 | 17331 | 161.15 | 553 | 540 | 104.2 |
| C | 0 | 10 | 319541 | 2324.5 | 597 | 601 | 137.2 |
| C | 15 | 214 | 222475 | 1617.06 | 597 | 601 | 137.2 |
| C | 3 | 233 | 79252 | 573.22 | 597 | 601 | 137.2 |
| D | 8 | 195 | 438394 | 3017.93 | 596 | 578 | 145.1 |
| D | 12 | 233 | 311599 | 2143.92 | 596 | 578 | 145.1 |
| D | 2 | 249 | 192986 | 1326.3 | 596 | 578 | 145.1 |
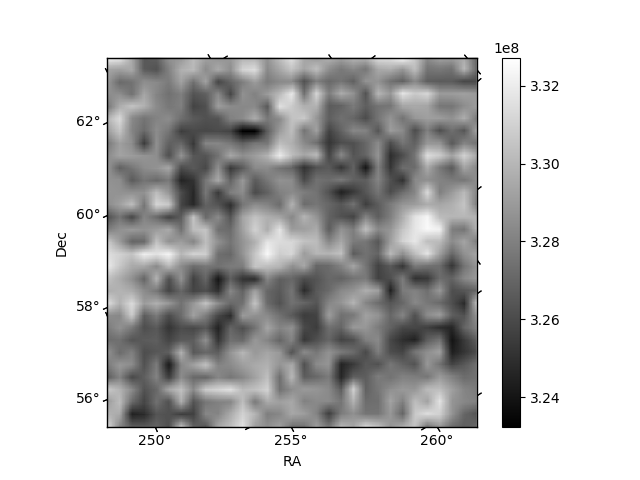
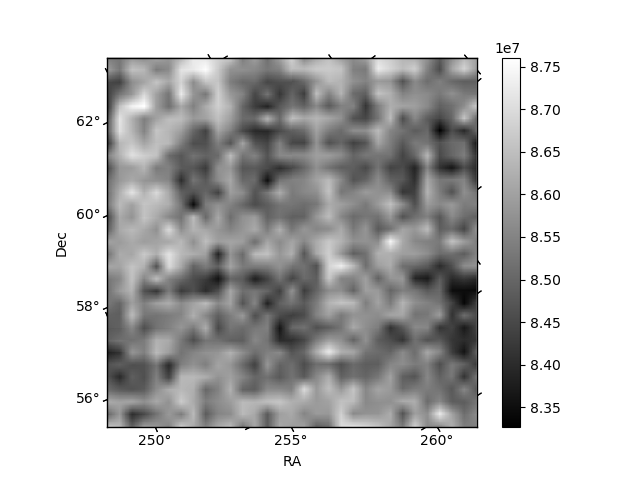
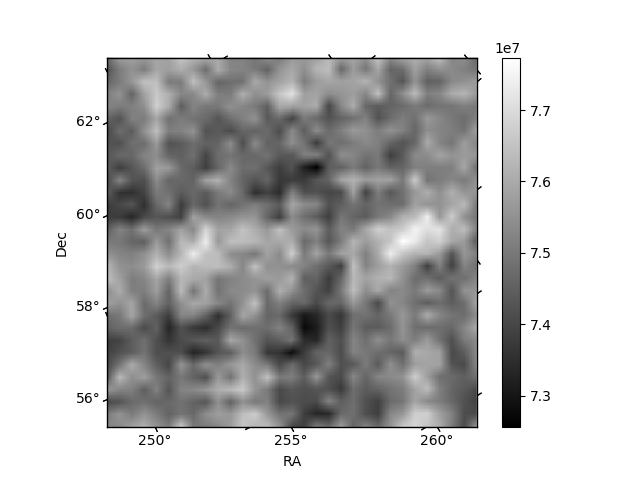
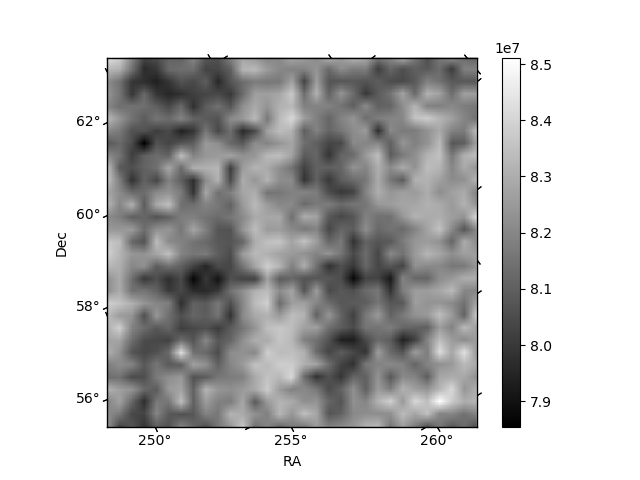
Histogram calculated using DETX and DETY for each event in the final _common_clean file
| Quadrant A | 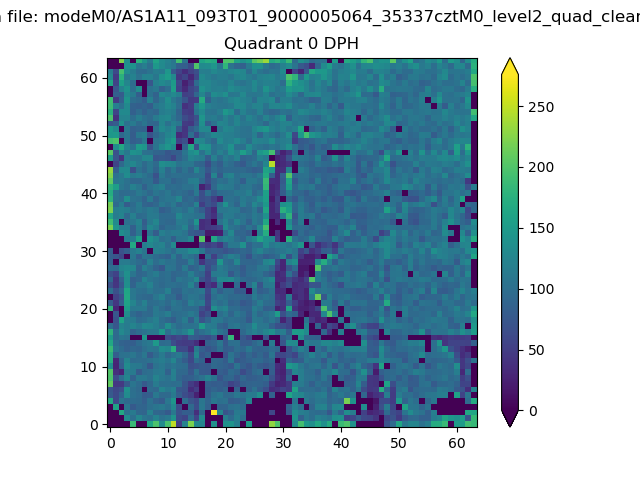 |
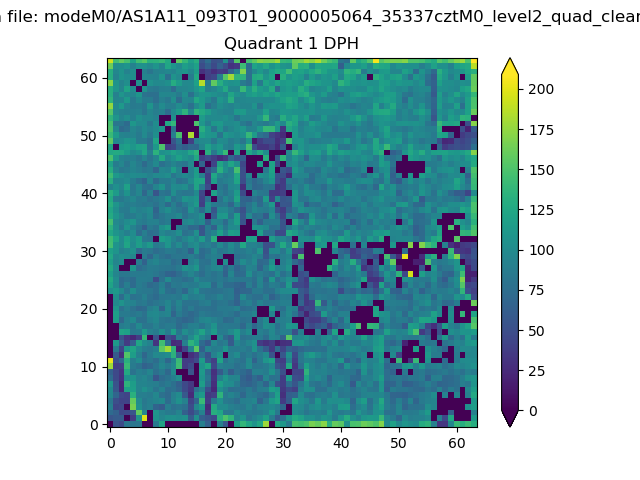 |
Quadrant B |
|---|---|---|---|
| Quadrant D | 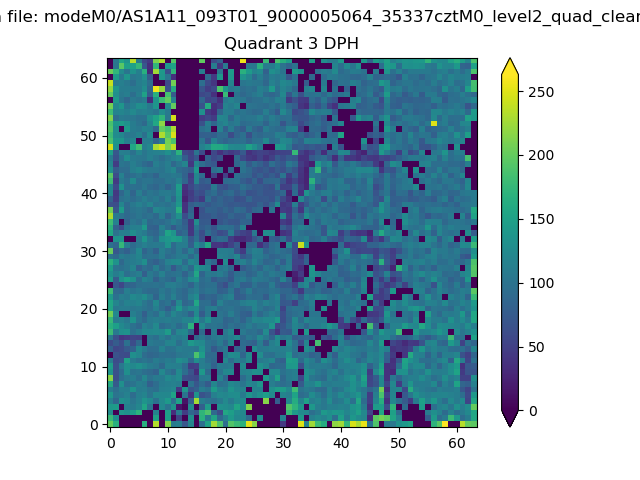 |
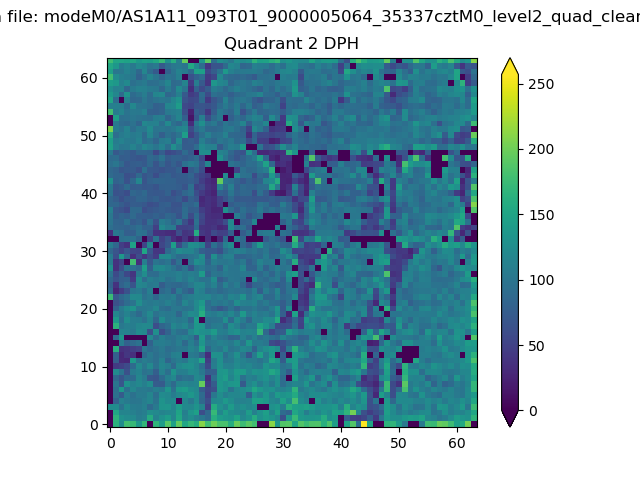 |
Quadrant C |
| Plot type | Count rate plots | Images |
|---|---|---|
| Comparison with Poisson distribution Blue bars denote a histogram of data divided into 1 sec bins. Red curve is a Poisson curve with rate = median count rate of data. |
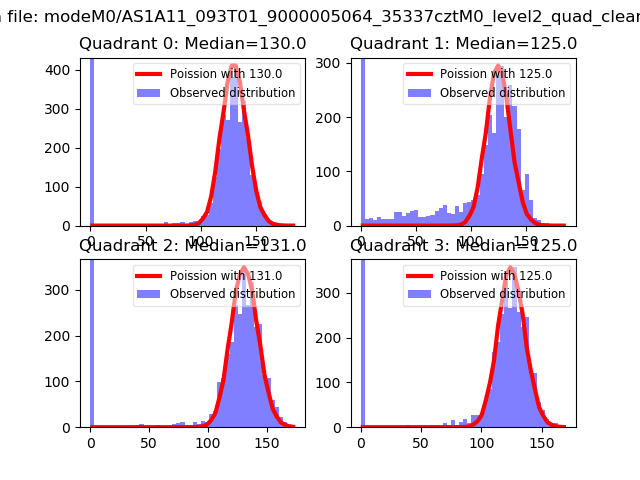 |
 |
| Quadrant-wise count rates Data is divided into 100 sec bins |
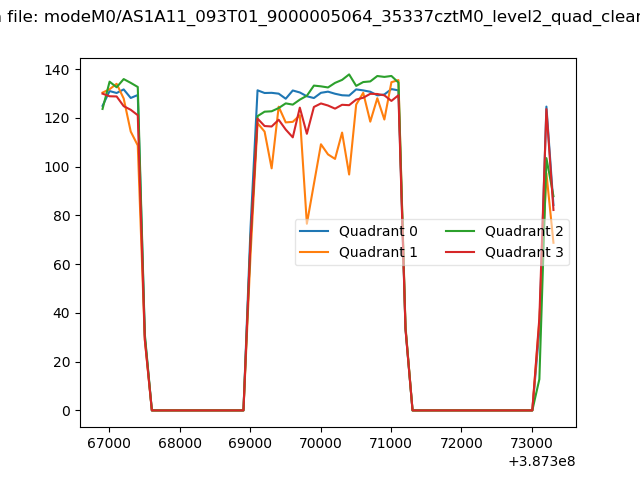 |
|
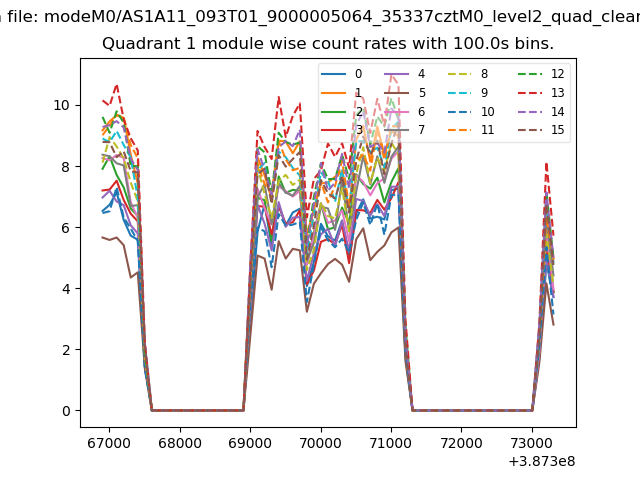
| Module-wise count rates for Quadrant A Data is divided into 100 sec bins |
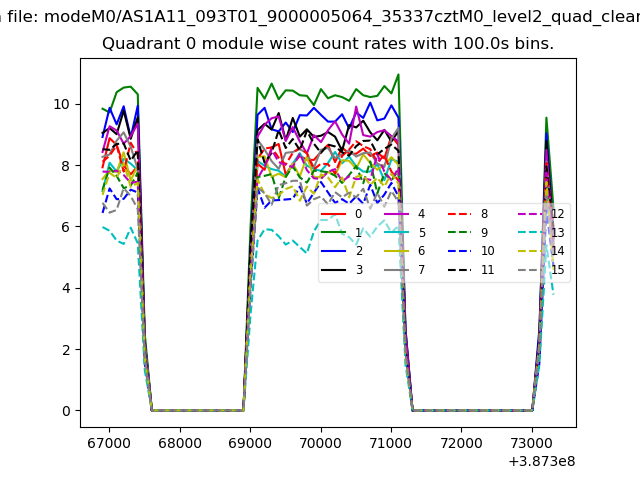 |
 |
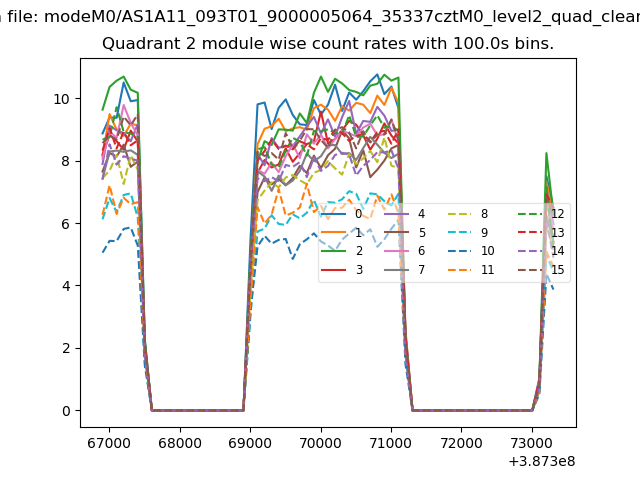
| Module-wise count rates for Quadrant B Data is divided into 100 sec bins |
 |
 |
| Module-wise count rates for Quadrant C Data is divided into 100 sec bins |
 |
 |
| Module-wise count rates for Quadrant D Data is divided into 100 sec bins |
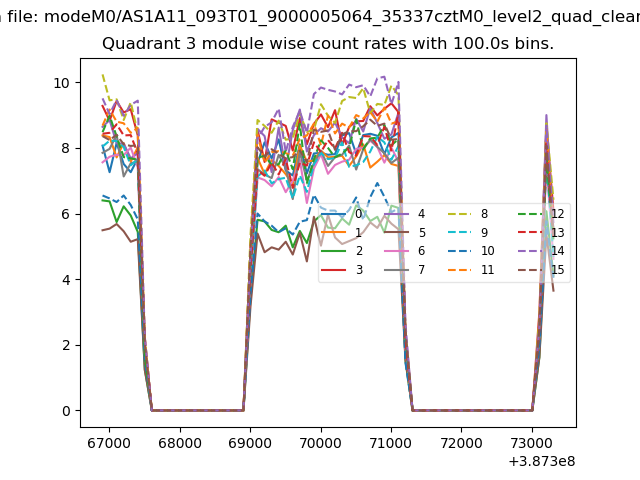 |
 |
| Parameter | Plot |
|---|---|
| CZT HV Monitor | 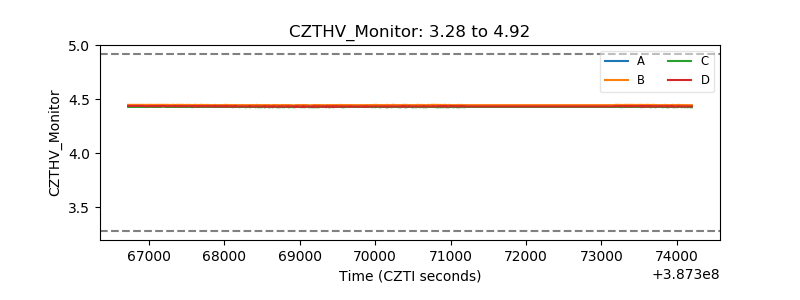 |
| D_VDD | 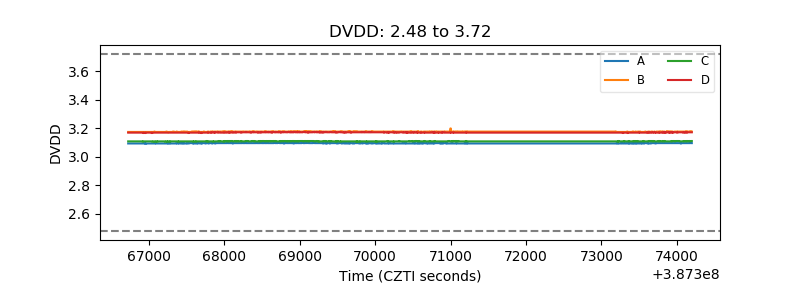 |
| Temperature 1 | 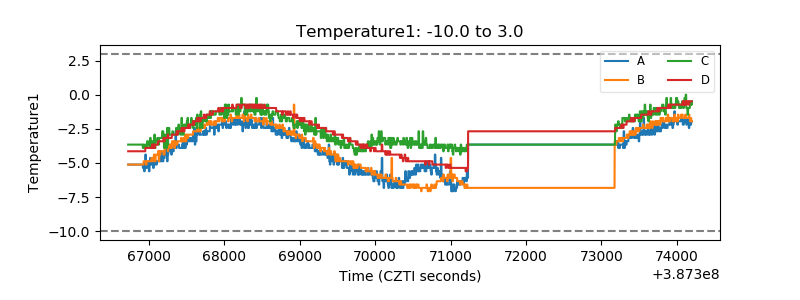 |
| Veto HV Monitor | 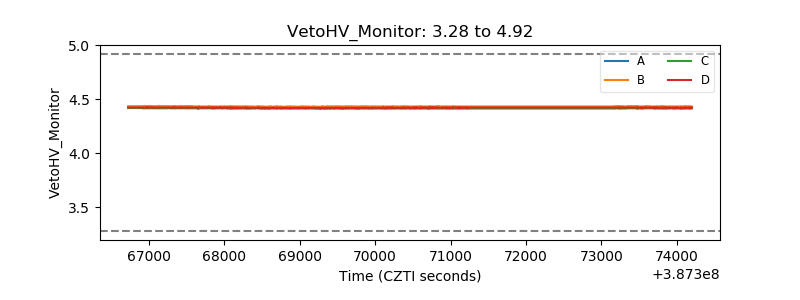 |
| Veto LLD | 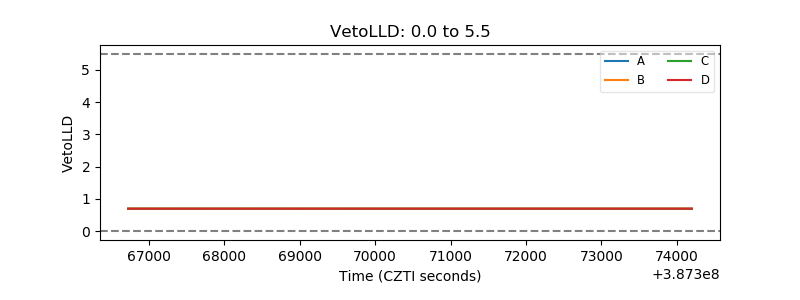 |
| Alpha Counter | 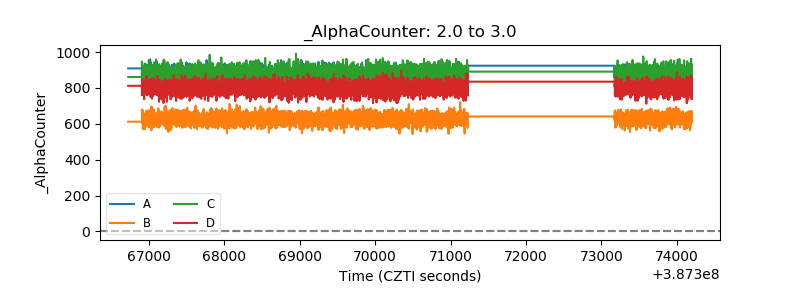 |
| _CPM_Rate | 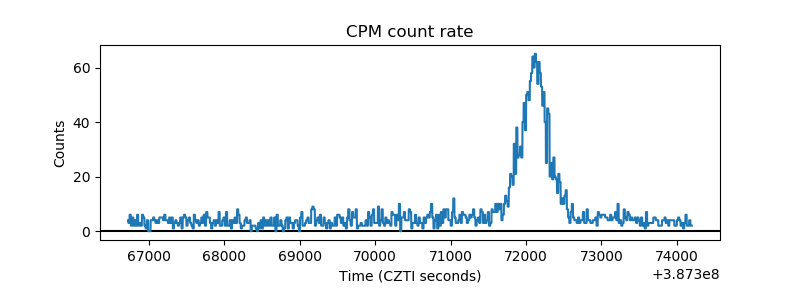 |
| CZT Counter | 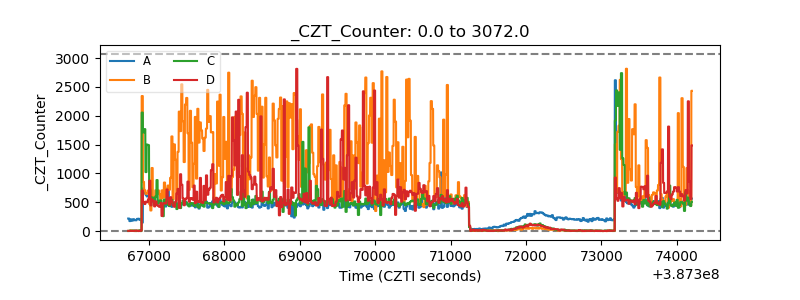 |
| +2.5 Volts monitor | 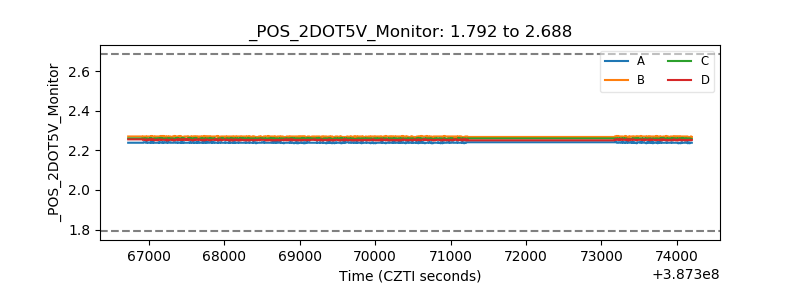 |
| +5 Volts monitor | 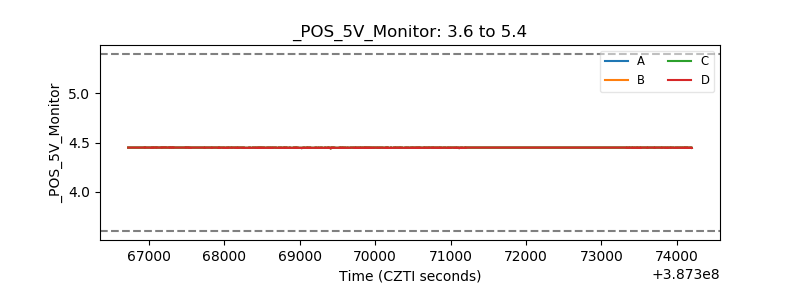 |
| _ROLL_ROT | 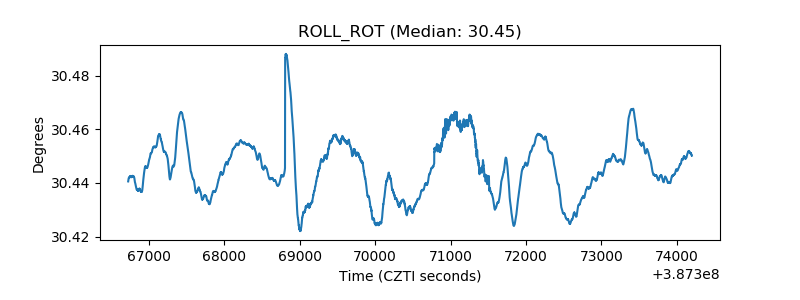 |
| _Roll_DEC | 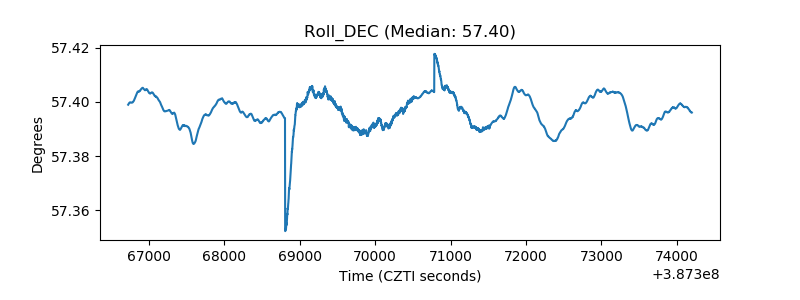 |
| _Roll_RA | 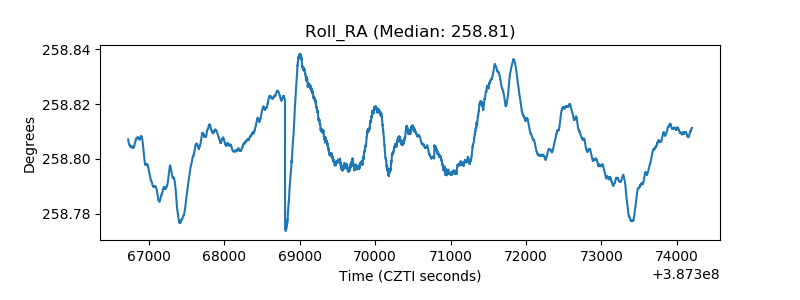 |
| Veto Counter | 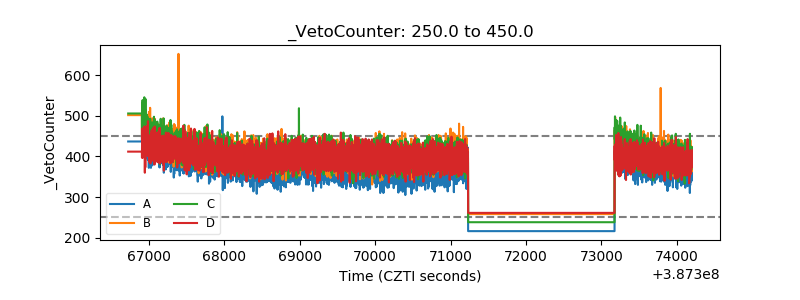 |